
My publication The Impact of human CO2 on atmospheric CO2 – edberry.com supersedes my Preprint #3 below.
Download Excel file here.
Comments by scientists:
- “Dear Ed, Congratulations – a wonderful piece of work.” – Dr. Nils-Axel Morner
- “Ed does not make mathematical mistakes in solving his rate equations.” – Dr. William Happer
Dr. Richard Courtney wrote in his email to global-warming-realists@googlegroups.com on November 21, 2019:
Dear Ed,
I again provided my 2008 paper as an attachment to an email earlier today. Its conclusion to which you refer is on its pages 6 and 7 and says,
“In the light of all the above considerations it would appear that the relatively large increase of CO2 concentration in the atmosphere in the twentieth century (some 30%) is likely to have been caused by the increased mean temperature that preceded it. The main cause may be desorption from the oceans. The observed time lag of half a century is not surprising. Assessment of this conclusion requires a quantitative model of the carbon cycle, but – as previously explained – such a model cannot be constructed because the rate constants are not known for mechanisms operating in the carbon cycle.”
Your “physics model” quantifies the anthropogenic and natural contributions to changes in atmospheric CO2 concentration without need for knowledge of rate constants for individual mechanisms. This is a breakthrough in understanding which Segalstad, Harde, Salby, and myself all failed to make.
Richard
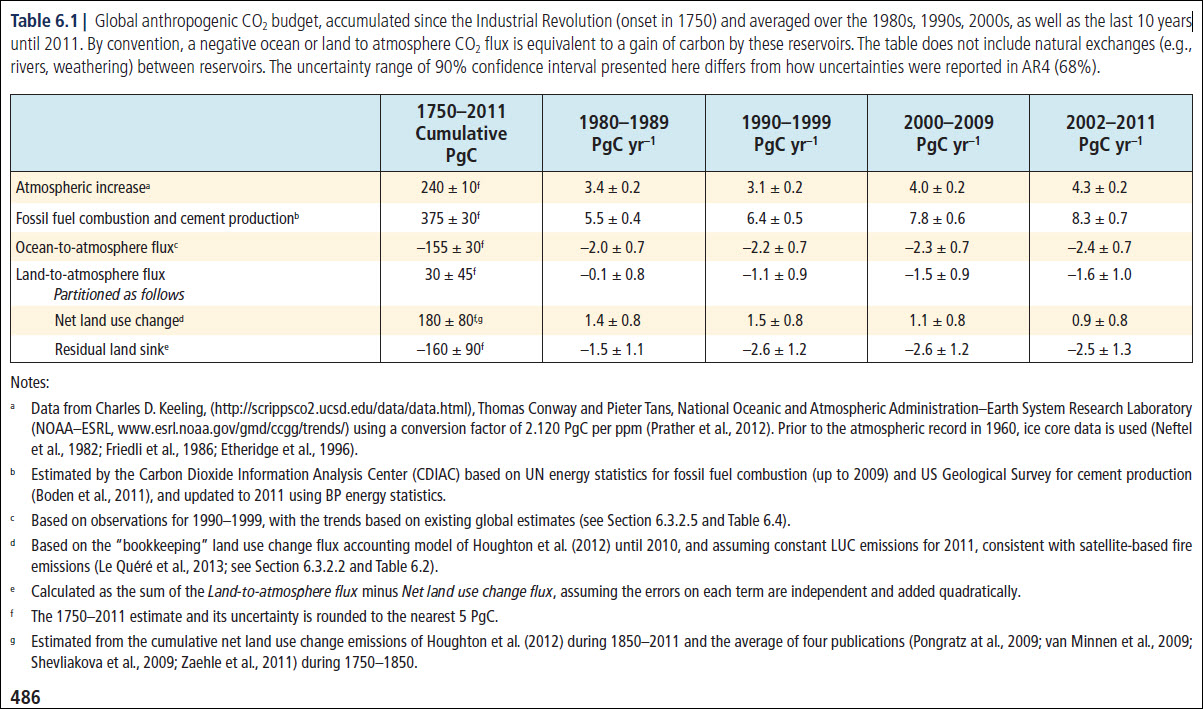
IPCC’s Table 6.1 relevant to comments beginning June 22, 2021.
As a British farmer, who was being told in the 1970’s that the next Ice Age was about to happen, since winters were 10 days longer, glaciers were growing 100 ft per year, your paper has been refreshing. From 1940-1980 temperatures were falling while CO2 was rising. I regret it was Margaret Thatcher who set up the Hadley Centre in c 1984, after a brief rise in global temperatures to try to reduce power from British coal miners. As she was the only European PM with a science degree, she was believed in saying CO2 was responsible. She later admitted (her autobiography) the science was complicated and economic problems from it could be severe.
Well, nothing has changed… The world is still cooling down, as it has been for the last 8k to 6k years. The climate shall never again be as hot as it was 6,000 years ago, as we are well past the hottest part of this current inter-glacial period.
Just look at the temperature graphs for the last 4 Ice Ages… It looks like a heart-beat monitor in a hospital room… It is just going to get colder…not hotter. The raise in mean temps in modern times started in 1750..or so..when the LIA ended. This increase ended in the 1940s, then started to cool down until the 1980s, when things began to heat up again. But, now…the mean temperatures are no longer climbing…and haven’t been for the past several years.
How could this be? Did the CO2 in the atmosphere suddenly reduce itself? No? You mean the atmospheric CO2 is still increasing? Well, why the stall in mean temperature increasing? Doesn’t the Earth’s Mean Temperature depend on atmospheric CO2? It doesn’t?
Well, what could possibly explain the rise and fall of Earth’s Mean Temperatures…if not CO2?
Why are you pointing at the Sun?
Cant say I understand the complexities of your paper but does it matter if CO2 can`t be the cause of warming the earth?
It only matters to the people trying to gain control over the means of production, while looting your wallet, and telling you want to do…and how to live.
It really only matters to the Socialists and the Collectivists… Oh, and the people they have already brainwashed, who are so pathetically emotionally disturbed.
Dr. Berry,
Your final revision of Preprint #3 is outstanding. While I know many of Jerry Elwood’s comments were based upon IPCC talking points; he is definitely a sharp man, only wrong. Your “back and forth” with him was very educational and helped sharpen some of your arguments, and added clarity to your paper. It could and should be published in Nature. It probably will be one day, but you probably won’t be around.
Here is a peer reviewed paper that corroborates what I have been asserting for years: That water vapor controls the climate and CO2 has no significant influence. The sun matters because it provides the energy to drive the water vapor into the atmosphere http://thelightfootinstitute.ca/imglib/Earth_temp_paper.pdf
Statements therein include:
“In other words, the non-condensing GHGs are passive and do not affect Earth’s temperature because they are always rendered ineffective by the much larger warming by water vapor.”
“The increase in temperature over the decades mid-1970s to 2011 was caused by an increase in water vapor and not by an increase in CO2.”
“Carbon dioxide and the other non-condensing greenhouse gases (GHGs) as in Figure 3 are small, passive, and have no effect on the Earth’s temperature.”
A recent update of my work which focuses on the observation that WV controls climate because it has been increasing faster than possible from just planet warming is at https://www.researchgate.net/publication/338805648_Water_vapor_vs_CO2_for_planet_warming_14
Have you seen Dr Peter Wards site …. https://whyclimatechanges.com/ In which he proposes that the rise in temperatures are because of O2 depletion ??
Pingback: Fight for Truth - edberry.com
Pingback: The World's most costly Scientific Error - edberry.com
Pingback: The World's most costly Scientific Error - edberry.com
Pingback: IPCC Data: Rising CO2 is 75% Natural – Climate- Science.press
Dear Ed
R. Cultz published my charts on his website a number of times on the basics of CO2.
I’m interested in adding your chart (CO2 above 280 ppm) to the list.
I’m no scientist, but have always been interested in the sciences. I did one year of environmental studies many years back and have been following the growing ECO hype ever since. What always strikes me the most is how little people know about the basics. That’s why I created these Charts.
https://www.ric-communications.ch/projekte/simple-science-1
The world of CO2
Infographics can be helpful, in making things simple to understand. CO2 is a complex topic with a lot of information and statistics. These simple step by step charts should help to give you an idea of CO2’s importance. Without CO2, plants wouldn’t be able to live on this planet. Just remember, that if CO2 falls below 150 ppm, all plant life would cease to exist.
– N° 1 Earth’s atmospheric composition
– N° 2 Natural sources of CO2 emissions
– N° 3 Global anthropogenic CO2 emissions
– N° 4 CO2 – Carbon dioxide molecule
– N° 5 The global carbon cycle
– N° 6 Carbon and plant respiration
– N° 7 Plant categories and abundance (C3, C4 & CAM Plants)
– N° 8 Photosynthesis, the C3 vs C4 gap
– N° 9 Plant respiration and CO2
– N° 10 The logarithmic temperature rise of higher CO2 levels.
– N° 11 Earth’s atmospheric composition in relationship to CO2
– N° 12 Human respiration and CO2 concentrations.
– N° 13 600 million years of temperature change and atmospheric CO2
– N° 14 The composition of the human body
Thanks for your feedback!
Pingback: The Impact of human CO2 on atmospheric CO2 - edberry.com
Pingback: The Impact of human CO2 on atmospheric CO2 - edberry.com
Pingback: Origen del CO2 atmosférico – El Palo de Hockey
Pingback: By the Numbers: CO2 Mostly Natural - Climate- Science.press
Pingback: PREPRINT #2: The Physics Model Carbon Cycle For Human CO2
Pingback: You Are Not Causing Global Warming