
by Richard S. Courtney
New plot to compare with Figure 1
Compare Richard Courtney’s Figure 1 with the figure below that I (Ed) plotted using IPCC-approved data with monthly resolution with the bonus that the data extend to 2015.
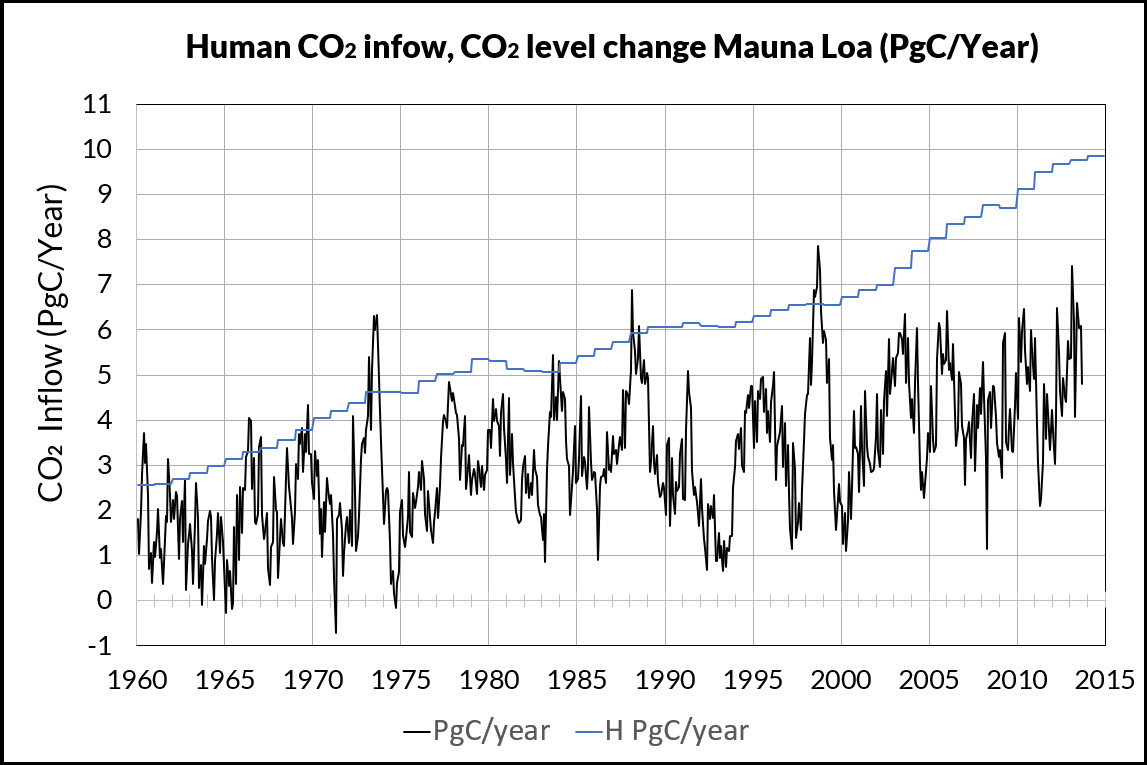
The plot shows that Richard Courtney’s Figure 1 is correct. The annual change in the Mauna Loa data is calculated by subtracting the data for 12-months prior from the data for each month.
“However, the annual pulse of anthropogenic CO2 into the atmosphere should relate to the annual increase of CO2 in the atmosphere if one is causal of the other,” (See Synopsis and Introduction)
no, that is not correct, as has been explained repeatedly on climate blogs over the years. We have known since the 1970s, starting with the work of Bacastow, that there is considerable natural variation in the atmospheric growth rate of CO2. This is generally correlated with ENSO and is though to be due to the changes in precipitation in the tropics that are caused by ENSO affecting the growth of terrestrial plants. This variation is quasi-cyclic and hence does not affect the long term increasing trend. We would expect to see a good correlation between anthropogenic emissions and the annual growth rate only if natural emissions and uptake were approximately constant, but *nobody* that has studied the carbon cycle thinks that is actually true.
Richard Betts has co-authored a recent paper on this
https://ore.exeter.ac.uk/repository/bitstream/handle/10871/123682/Ch%2020%20ENSO%20and%20the%20carbon%20cycle%20-%20for%20production.pdf?sequence=2&isAllowed=y
Gavin Cawley,
I prefer people to quote what I said in Context.
You rightly say I wrote,
“However, the annual pulse of anthropogenic CO2 into the atmosphere should relate to the annual increase of CO2 in the atmosphere if one is causal of the other,”
My statement is correct. How could it be otherwise?
However, that self-evidently true fact is discussed later in my text where I write,
“It is clear that Figure 6 shows the two models both provide calculated values for Cair that fit with the observed values rather well, and they can hardly be distinguished from each other.
Figures 1 and 6 provide an apparent paradox. The annual anthropogenic emission of CO2 should relate to the annual increase of CO2 in the atmosphere if one is causal of the other, but Figure 1 shows these two parameters do not correlate. However, Figure 6 shows that – using each of these different models – we were able to model the increase of CO2 in the atmosphere as being a function solely of the annual anthropogenic emission of CO2. It is important to note that we did not use any ‘fiddle factors’ such as the 5-year-averageing used by the IPCC (that cannot be justified because there is no known physical mechanism that would have such effect).
The apparent paradox is resolved by consideration of the calculated equilibrium CO2 concentration values, Ce. These are shown in Figure 7.
Each model indicates that the calculated CO2 concentration for the equilibrium state in each year is considerably above the observed values. This demonstrates that each model indicates there is a considerable time lag required to reach the equilibrium state when there is no accumulation of CO2 in the atmosphere. In other words, one has to reckon with a considerable time lag to reach the equilibrium state Fa = 0 when Fin increases to a certain value with increasing Fem. As Figure 2 shows, the short-term sequestration processes can easily adapt to sequester the anthropogenic emission in a year. But, according to these models, the total emission of that year affects the equilibrium state of the entire system. Some processes of the system are very slow with rate constants of years and decades. Hence, the system takes decades to fully adjust to the new equilibrium. And Figure 6 shows the models predicting the atmospheric CO2 concentration slowly rising in response to the changing equilibrium condition that is shown in Figure 7.
This slow rise in response to the changing equilibrium condition also provides an explanation of why the accumulation of CO2 in the atmosphere continued when in two subsequent years the flux into the atmosphere decreased (the years 1973-1974, 1987-1988, and 1998-1999). ”
IN SUMMATION OF YOUR CLAIM OF AN ERROR IN MY PAPER
I have discussed reality and our use of models to assess the range of possible explanations for empirical data (i.e. results of quantitative observations of reality) pertaining to atmospheric CO2 concentration changes
but
you have confused annual changes with changes over multiple years.
And that is not your only mistake, as I explain below.
In 2008 my paper (which you are commenting) said,
“Qualitative consideration of the carbon cycle suggests the carbon cycle cannot be very sensitive to relatively small disturbances such as the present anthropogenic emissions of CO2. However, the system could be quite sensitive to temperature. Indeed, the considerations suggest that the relatively large increase of CO2 concentration in the atmosphere in the twentieth century is likely to have been caused by the increased mean temperature that preceded it. The main cause may be desorption from the oceans. The observed time lag of half a century is not surprising.”
The paper you link is not dated but cites data from 2018 which indicates it was published at least a decade after my paper. Your linked paper says,
“Observational studies of atmospheric CO2, land ecosystem and ocean processes show that variability in the carbon cycle is closely related with ENSO. Years with a warm anomaly in the tropical Pacific show a faster CO2 rise due to weaker land carbon sinks, particularly in the tropics, with a partial offset by stronger net uptake by oceans. The opposite happens in years with cool Pacific SST anomalies. This relationship holds for small ENSO SST anomalies as well as large ones, and is robust enough for the annual CO2 growth rate anomaly to be highly predictable on the
basis of SST observations and forecasts.”
IN SUMMATION OF THE INFORMATION IN MY PAPER AND YOUR LINK
Your link says sea surface temperature (SST) changes can predict annual changes to atmospheric CO2 concentration by assuming sea surface temperature effects CO2 emission from from the oceans. That supports the suggestion in my paper that the rise in atmospheric CO2 concentration is induced by CO2 emissions from the oceans.
The sole difference between these conclusions in the two papers is that
(a) my considerations are of both short-term (i.e. two year) changes and long term (i.e. 50 year changes)
but
(b) your link only considers short term changes.
Richard
“My statement is correct. ”
No it isn’t. You would only see a clear correlation if anthropogenic emissions were the only factor that had a significant effect on the annual growth rate, but it is not. Anthro emissions do show up in the annual growth rate, but they are obscured by the effects of ENSO. However the effects of ENSO are cyclical and average out to near zero, but anthropogenic emissions do not average to zero, and hence accumulate in the atmosphere.
“I prefer people to quote what I said in Context. ”
LOL, figure 6 is *twelve* pages after the quote!
“Figures 1 and 6 provide an apparent paradox. The annual anthropogenic emission of CO2 should relate to the annual increase of CO2 in the atmosphere if one is causal of the other, but Figure 1 shows these two parameters do not correlate. ”
Repeating a claim doesn’t make it true. Annual anthropogenic emissions do show up in the annual increase, AFTER you cancel the effects of the other factors that affect it, such as ENSO.
As you are just repeating yourself without addressing the criticism, I’ll leave you to it.
Gavin Cawley,
I answered your silly post patiently and in detail.
You began by quoting and disputing a statement in my paper: i.e.
““However, the annual pulse of anthropogenic CO2 into the atmosphere should relate to the annual increase of CO2 in the atmosphere if one is causal of the other,” (See Synopsis and Introduction)”
The Synopsis and Introduction are NOT the context: they are brief summaries of what the paper says. The context of something is how it is presented and explained in the paper, and – in this case – I answered your point by quoting the statement and its explanation from within my paper; i,e. you quoted me out of context and I replied by quoting the statement in its context in my paper.
Furthermore, my immediate reply to your dispute of that quotation was to say and to ask,
“My statement is correct. How could it be otherwise?”
Your response is to ignore my question and to claim,
“Anthro emissions do show up in the annual growth rate, but they are obscured by the effects of ENSO. However the effects of ENSO are cyclical and average out to near zero, but anthropogenic emissions do not average to zero, and hence accumulate in the atmosphere.”
That does not answer my question but it DOES say at least one other effect (i.e. ENSO) dominates the effect of the anthropogenic emission. It also repeats the untrue assertion in your first post and which my answer had refuted by quoting from the reference you provided.
Also, I wonder about your claim that “the effects of ENSO are cyclical and average out to near zero”.
You know that? How?
You conclude your illogical response to my refutation of your silly criticisms by writing,
“Repeating a claim doesn’t make it true. Annual anthropogenic emissions do show up in the annual increase, AFTER you cancel the effects of the other factors that affect it, such as ENSO.
As you are just repeating yourself without addressing the criticism, I’ll leave you to it.”
THAT IS RISIBLE. It is a clear example of psychological transference.
As everybody can see, I have fully refuted your errors with quotations from my paper and the link which you provided. Your response is to ignore everything I replied to you, to repeat your incorrect assertions, and to add another unjustified (and probably untrue) assertion (which in this post I have asked you to say how you know).
Richard
“Also, I wonder about your claim that “the effects of ENSO are cyclical and average out to near zero”.
You know that? How?”
LOL, you do know what the O in ENSO stands for don’t you?
“Furthermore, my immediate reply to your dispute of that quotation was to say and to ask,
“My statement is correct. How could it be otherwise?”
I clearly explained how it could be otherwise. ENSO has a large effect on the annual growth rate which obscures the effect of the inter-annual variation in anthropogenic emissions. I also pointed out that this has been known since the 1970s but everybody apparently except you.
There is no paradox at all between figures 1 and 6. The long term increase in atmospheric CO2 is caused by the average value of the annual growth rate, not the variability in the growth rate (which gets averaged out as you integrate the annual growth). Thus ENSO creates a lot of variation in the growth rate, but it averages out to near zero in the long run. Anthropogenic contributions on the other hand are always positive (and about twice the growth rate), so it does contribute to the long term increase, even though the interannual variability is not clearly evident in the growth rate.
So you can claim that I haven’t answered your question, but claiming it doesn’t make it true. My first post on this thread answered your question already, you just ignored it.
Gavin Crawley,
Please stop digging in your hole.
Of course I know what ENSO means, but you clearly don’t.
My question was how you know the oscillation (O) cancels to zero as you claim it does. Since step changes to global temperature coincide with ENSO phases it is reasonable to suppose the oscillations don’t cancel to zero.
I remind of my saying that if changes to one parameter are causal of another then the changes in the two parameters must relate, and I asked,
“My statement is correct. How could it be otherwise?”
You iterate your previous evasion of that question when you write,
“I clearly explained how it could be otherwise. ENSO has a large effect on the annual growth rate which obscures the effect of the inter-annual variation in anthropogenic emissions. I also pointed out that this has been known since the 1970s but everybody apparently except you.”
NO! and NO!
Firstly, I refuted that twaddle when I wrote,
“That does not answer my question but it DOES say at least one other effect (i.e. ENSO) dominates the effect of the anthropogenic emission. It also repeats the untrue assertion in your first post and which my answer had refuted by quoting from the reference you provided.”
I do not intend to refute your twaddle again when you have twice ignored my previous refutations.
Secondly, You say,
“I also pointed out that this has been known since the 1970s but everybody apparently except you.”
Well, I told you I knew it and I quoted my discussion of it in my 2008 paper which you purport to be criticising.
Indeed, you laughably demonstrate I did know it when you by misquote my comment about an apparent paradox when you say,
“There is no paradox at all between figures 1 and 6.”
I agree and I did NOT say there was. As I said in my 2008 paper, there is an “apparent paradox”, not a paradox. And I quoted from my 2008 paper my explanation of the apparent paradox when I wrote,
“Figures 1 and 6 provide an apparent paradox. The annual anthropogenic emission of CO2 should relate to the annual increase of CO2 in the atmosphere if one is causal of the other, but Figure 1 shows these two parameters do not correlate. However, Figure 6 shows that – using each of these different models – we were able to model the increase of CO2 in the atmosphere as being a function solely of the annual anthropogenic emission of CO2. It is important to note that we did not use any ‘fiddle factors’ such as the 5-year-averageing used by the IPCC (that cannot be justified because there is no known physical mechanism that would have such effect).
The apparent paradox is resolved by consideration of the calculated equilibrium CO2 concentration values, Ce. These are shown in Figure 7.” etc.
Please, Gavin, stop digging in your hole.
I have “ignored” nothing you have written in you posts above. On the contrary.
I have refuted every and all of your criticisms of my 2008 paper with quotations from that paper and from the link you provided..
You have failed to address any clarifying questions I have put to you but have persisted in claiming your fallacious evasions are answers. That persistence is despite my having explained to you that those evasions are untrue assertions which don’t answer the questions (and would not answer the questions if they were true).
Richard
“Gavin Crawley,”
my name is not *that* hard to get right.
” Since step changes to global temperature coincide with ENSO phases it is reasonable to suppose the oscillations don’t cancel to zero.”
It is an OSCILLATION. There are both steps up and steps down. Energy is not created by ENSO, merely redistributed between the atmosphere and oceans, thus on long enough timescales, it will average out to zero.
““That does not answer my question but it DOES say at least one other effect (i.e. ENSO) dominates the effect of the anthropogenic emission.”
It does answer your question. ENSO dominates anthropogenic emissions on short timescales, which is why year-to-year variation in anthropogenic emissions do not show up in the annual growth rate. However, anthropogenic emissions are strictly positive, so they cause an accumulation in the atmosphere, whereas the variability due to ENSO does not because it is an OSCILLATION. Atmospheric CO2 levels had been pretty much constant for several thousand years prior to the industrial revolution. If the effects of ENSO did not average out to zero, that would not be the case.
Gavin Cawley,
I apologise for the typo. in writing your name.
Please understand that assertion is NOT evidence.
You say to me,
“It does answer your question. ENSO dominates anthropogenic emissions on short timescales, which is why year-to-year variation in anthropogenic emissions do not show up in the annual growth rate. However, anthropogenic emissions are strictly positive, so they cause an accumulation in the atmosphere, whereas the variability due to ENSO does not because it is an OSCILLATION. Atmospheric CO2 levels had been pretty much constant for several thousand years prior to the industrial revolution. If the effects of ENSO did not average out to zero, that would not be the case.”
Again, NO! and NO!
Iterating your mistaken assertion that the oscillation sums to zero does NOT answer my question of how you know what you assert.
And the atmospheric CO2 concentration was NOT constant prior to the industrial revolution. The ice core data suggest that may be true, but the stomata data refute it. And since we are discussing on Ed Berry’s blog I think it proper to point out that he has determined the atmospheric CO2 rise prior to ~1940 was larger than can be accounted by the anthropogenic CO2 emission.
Also, redistribution of heat DOES alter global temperature because it causes a response to maintain the planet’s energy budget (radiative heat loss is proportional to the fourth power of temperature and temperatures vary e.g. with latitude).
Please stop digging because you are embarrassing yourself.
Richard
Richard,
Your Figure 1 claims to show that the rate of increase in atmospheric CO2 (“Fa observed”) has been changing by up to a factor of three from one year to the next in recent decades. That is a remarkable claim that I do not believe. You refer us to Reference 4, which I cannot access, but you can since you wrote it. I am particularly interested in whether Reference 4 contains any discussion of the uncertainty in the measurement of Fa observed. It certainly should, but I doubt that it does, since you do not put estimated error bars on the points in Figure 1.
Roughly speaking atmospheric CO2 concentration has been increasing by about .3% per year. Therefore, to compute Fa observed for a given year, you must take the difference between two numbers that differ by only .3%. Even if you thought you knew the beginning and year end concentrations to .1% , you would have about a 50% uncertainty in Fa observed. While you might convince me that, say, the Mauna Loa data got the local concentration to an accuracy of .1%, good luck convincing me that whatever combination of measurements you used in Reference 4 got the global average concentration correct to .1%.
You are not alone in erroneously making statistical inferences from data without consideration of uncertainty in the data. Salby does the same in his infamous video.
The difficulty discussed above in measuring a yearly Fa observed certainly justifies being satisfied with an average over several years. When I do that by eyeball to your Figure 1, I see the expected correlation between Fa observed and emissions. Both are increasing. That is, the Keeling curve has a positive second derivative because emissions have increased.
In summary, the reason your “annual pulse of anthropogenic CO2 into the atmosphere” does not correlate to your “annual increase of CO2 in the atmosphere” is that there is too much noise in the measurement of the annual increase.
Dave
David Andrews,
Thank you for your comment. I will address your final point first because – in my opinion – it is the most important.
You say to me,
“In summary, the reason your “annual pulse of anthropogenic CO2 into the atmosphere” does not correlate to your “annual increase of CO2 in the atmosphere” is that there is too much noise in the measurement of the annual increase.”
You may be right but if so then we know nothing.
The data are useless junk if the inherent errors in one or both of the data sets are so large that the errors obscure the causal relationship between the two parameters.
Please note that my paper admits the problem you address at the start of its Section 3.5 where it says,
“It should first be noted that there are few available empirical data that can be trusted. In fact, these are limited to the observed increase of the concentration of CO2 in the atmosphere, well recorded at Mauna Loa since 1958 (see Figure 2). The annual flow Fa into the atmosphere can be derived from this (see Figure 1). Second best are the data collected by cdiac.ornl on the human emission (Fem ), but they may be an underestimate if nations have not provided the correct figures.”
As the quotation states, the Mauna Loa data are more reliable than the human emission data, but both data sets can be challenged (the Mauna Loa measurements are made on the side of an active volcano). And, as you point out, the stated error estimates provided for both data sets are clearly not correct and they are rarely plotted by the providers of the data; see https://www.esrl.noaa.gov/gmd/ccgg/trends/
However, if one accepts your claim that the error estimates are so large that they obscure the causal relationship you assert then one has to reject your assertion of the existence of that causal relationship because the existence is an unknown (i.e. it is obscured). And your “eyeball” does not overcome this problem because – as you say – the most it indicates is ‘both parameters are rising’.
I and others have decided to accept the data and to assess if it can be used to support or to reject the assertion which you support. My 2008 paper demonstrates the data can be interpreted to encompass both completely anthropogenic and completely natural causes of the recent rise of atmospheric CO2 concentration although a natural cause is most likely.
Importantly, Ed Berry builds on a finding in my paper by making a breakthrough in understanding (which I and all others failed to make). This has enabled him to assess the data in a way that quantifies the natural and anthropogenic contributions to the cause.
Richard
Richard,
I appreciate your acknowledgement that a central argument of your 2008 paper was wrong. We now agree that the lack of short-term correlations between emissions and measured annual CO2 increases does not rule out the former being the cause of the latter. The changes in CO2 concentration from one year to the next are too small to be accurately measured. Figure 1 of your paper is misleading because the large errors on concentration changes (“Fa observed”) were omitted. We are making progress, because just a few days ago you were defending that wrong inference. As I said in my first post, others (e.g. Salby) have made the same mistake. If there is anyone out there that wants to defend that particular argument, now would be a good opportunity. Be sure to include a competent error analysis.
While focusing on annual fluctuations might be a fool’s errand, long term trends are easy to see. As emissions have risen, the rate of increase in CO2 concentration have increased. It is pretty simple. To suggest that “the data are useless junk” is silly.
You seem to suggest that the match between emissions and concentration increases is the only evidence we have to go on. Since the total carbon in the atmosphere plus oceans plus land is conserved, consider what you must also explain if you postulate that the growth in atmospheric CO2 is coming from the sea. Then why are the oceans becoming more acidic? Where is the anthropogenic carbon going? If your answer is “to the sea and that is why the sea is becoming acidic”, then what is the physics that makes “natural” carbon from the oceans switch places with anthropogenic carbon? Then there are other details such as the behavior of carbon isotope, but I have discussed them elsewhere on this blog.
Dave
David Andrews,
I have only read the first sentence of your response to me. It says,
“I appreciate your acknowledgement that a central argument of your 2008 paper was wrong. ”
I DID NOT – AND I DO NOT – ACKNOWLEDGE, SAY OR IMPLY THAT ANYTHING IN MY PAPER WAS OR IS “WRONG”.
If you start your comment with so gross a falsehood then I see no purpose in reading anything else from you unless and until you retract and apologise.
Richard
If you say you are still defending the Fa observed plot in Figure 1 of your paper, then please post your Reference 4, which you coauthored, so that we can see your methodology. E&E is not a widely circulated journal. I will take your unwillingness to post it as confirmation that your methodology is indefensible.
Dear David,
Your comment is unfair. I could post Richard’s Reference 4 but in doing so, according to my interpretation of the publisher’s copyright, I would be breaking the law. The same would be true for Richard.
Therefore, if you are truly interested in pursuing your argument, I suggest you go to this reference and purchase your own copy for $37.50:
https://journals.sagepub.com/doi/abs/10.1260/0958305053749589
Dear Ed,
You are correct and I am now a Member of the Editorial Board of E&E so I can’t give away property of E&E.
However, the demanded provision is not needed because the purported need for it is this incorrect claim to me by David Andrews,
“I will take your unwillingness to post it as confirmation that your methodology is indefensible.”
MY FIRST REPLY TO DAVID ANDREWS FULLY JUSTIFIED THE METHODOLOGY by saying,
“I and others have decided to accept the data and to assess if it can be used to support or to reject the assertion which you support. My 2008 paper demonstrates the data can be interpreted to encompass both completely anthropogenic and completely natural causes of the recent rise of atmospheric CO2 concentration although a natural cause is most likely.”
The data are widely used and all assertions e.g. of the IPCC are based on them.
So, if the data were to provide a specific indication of support or rejection of an anthropogenic or a natural cause of the rise of atmospheric CO2 concentration
then the validity of the data would warrant investigation to see if that rejects the conclusion.
But the investigation in my paper demonstrates the data encompasses the possibilities that the cause of rise is entirely natural, entirely anthropogenic or some combination of anthropogenic and natural causes. And my paper concludes saying,
“Hence, it cannot be known what if any effect altering the anthropogenic emission of CO2 will have on the future atmospheric CO2 concentration.”
It is perhaps interesting to note that the IPCC has also reported that it is not known what if any effect altering the anthropogenic emission of CO2will have on the future atmospheric CO2 concentration. Chapter 2 from Working Group 3 in the IPCC’s Third Assessment Report (TAR) says; “no systematic analysis has published on the relationship between mitigation and baseline scenarios”.[9]”
I add that the IPCC has made no change to that statement in its TAR.
Simply, my paper demonstrates the data indicates nothing of use and showing the data is inadequate would not alter that finding.
I said this in my first answer to David Andrews, when I wrote,
“As the quotation states, the Mauna Loa data are more reliable than the human emission data, but both data sets can be challenged (the Mauna Loa measurements are made on the side of an active volcano). And, as you point out, the stated error estimates provided for both data sets are clearly not correct and they are rarely plotted by the providers of the data; see https://www.esrl.noaa.gov/gmd/ccgg/trends/
However, if one accepts your claim that the error estimates are so large that they obscure the causal relationship you assert then one has to reject your assertion of the existence of that causal relationship because the existence is an unknown (i.e. it is obscured). And your “eyeball” does not overcome this problem because – as you say – the most it indicates is ‘both parameters are rising’.”
In other words, the validity of the data is not pertinent to the conclusion of my paper and I told David Andrews of that in my first reply to him.
Richard
Dear David,
Apologies for interrupting your discussion with Richard, but you wrote:
“if you postulate that the growth in atmospheric CO2 is coming from the sea. Then why are the oceans becoming more acidic? Where is the anthropogenic carbon going? If your answer is “to the sea and that is why the sea is becoming acidic”, then what is the physics that makes “natural” carbon from the oceans switch places with anthropogenic carbon?”
If nature frees carbon in the sea, then that alone makes the seas more acidic. So increased ocean acidity does not support your hypothesis nor contradict Richard’s paper.
Your conceptual view that human and natural carbon “switch places” has no basis in physics. A more valid physical view is that all subsets of carbon in the carbon cycle can be considered to flow independently from other subsets. This model, which is the Preprint #3 physics model, explains what happens to human CO2.
This proper concept is in harmony with Dalton’s law of Partial Pressures that assumes each subset of molecules in the air act independently. Subsets don’t “switch places” with each other.
Preprint #3 shows why human carbon flows from the atmosphere to the land and sea as natural carbon flows from the atmosphere to the land and sea. Human carbon flows through the carbon cycle to make the distribution of human carbon among the reservoirs approach the equilibrium distribution defined by the distribution of natural carbon in the reservoirs.
As I explained to you before, your conceptual model is not correct and therefore the conclusions you derive from your conceptual model are incorrect.
Dear Ed,
You say,
“If nature frees carbon in the sea, then that alone makes the seas more acidic. So increased ocean acidity does not support your hypothesis nor contradict Richard’s paper.”
I agree, and I add two points.
Firstly, the claims that “oceans are becoming more acidic” are dubious because meaningful global measurements are not possible. In reality, the claims derive from the fact that atmospheric CO2 concentration has risen, and there is an equilibrium between air and ocean surface concentrations.
Secondly, the equilibrium between atmospheric and ocean surface layer CO2 concentrations is affected by the pH of the surface layer (hence, the assertions of ‘ocean acidification’), but it is difficult to obtain much change to the pH by altering the CO2 in the oceans because of the carbonate buffer. However, small changes to sulphate dissolved in the surface layer are not affected by the carbonate buffer and, therefore, have relatively large effect on the pH.
Sulphate is injected into deep ocean by sub-sea volcanism and it takes decades or centuries for it to be transported to the ocean surface layer e.g by the thermohaline circulation. Hence, all the observed rise in atmospheric CO2 concentration could have been induced by increased sulphur in the ocean surface layer resulting from variations in sub-sea volcanism decades or centuries ago.
These facts and possibilities make any claims pertaining to changes in ocean surface layer pH pure speculation.
Richard
Richard and Ed,
It is ludicrous to suggest, Richard, that you are barred from elucidating a key part of a paper that you yourself coauthored because of copyright concerns. And the issue is not with the overall validity of the Mauna Loa data. The issue is with your mishandling of that data by ascribing too much significance to the differences between successive years. Your plot of Fa observed in Figure 1 with no indication of the obvious large errors either shows incompetence in data analysis or intentional dishonesty. OK, I understand that you are a “Merchant of Doubt” so you try to play it both ways. “Look, short term Fa observed doesn’t correlate with emissions! They should if there is a causal connection. There must not be!” This is followed by “You may be right but if so then we know nothing. The data are useless junk…” Your goal is not to clarify, it is to confuse and create the illusion of a scientific controversy where there is none.
Thanks, Ed, for the link to Richard’s Reference 4. I bought it, but it was not worth $37.50. The Figure 1 of Richard’s unrefereed conference submission appears in this E&E publication as Figure 3. It is identical except for the Figure number. But in this paper there is no mention at all as to where the data came from!! So Richard has cited his own paper to justify a plot, and that paper does not tell the reader what data was used. Reputable peer-reviewed journals REQUIRE data cited in analyses to be available to the reader, if not in the paper itself then in accessible data bases. If you are now on the Editorial Board of E&E, Richard, you should tell your colleagues they need to get their act together if they want to be taken seriously.
I have the Mauna Loa annually averaged data in a spreadsheet, which I used to convert “deltaC14” to C14 concentration in the process of correcting another example of mishandled data. If I take the difference between successive years to get a measure of annual CO2 accumulation, I get a plot very similar to, but not identical to, Richard’s Figure 1. I suspect he, or whoever first made the plot, averaged in other CO2 measurements as well. That would be the best thing to do, but all sources mentioned are in the northern hemisphere. I suggest you both look at Richard’s Figure 2 and estimate the uncertainty in Fa observed for 1998 and 1999.
There is absolutely no doubt that a central theme of your paper, the one you led with Richard, is wrong whether you choose to acknowledge that or not. But sure, go ahead and distract us with tales of ancient, undersea, sulfur belching volcanos.
Dave
David Andrews,
You say to me
“There is absolutely no doubt that a central theme of your paper, the one you led with Richard, is wrong whether you choose to acknowledge that or not. But sure, go ahead and distract us with tales of ancient, undersea, sulfur belching volcanos.”
Firstly, I have clearly explained there is absolutely no doubt that there is no basis in reality for your assertion that “a central theme” of my paper is “wrong”. Please justify your attack by refuting my explanation of your – n.b. NOT my – error which I have twice provided above. And if you wish to pursue your silly assertion with the publisher then there is nothing stopping you.
Secondly, YOU – not me – raised the distraction of ocean surface layer pH change. I refuted it.
Additionally, I explained that as a Member of the Editorial Board of E&E I cannot disobey the publisher’s procedures by giving away pay-walled information. Your refusal to accept that fact says much about you and it says nothing about anybody else nor anything else.
Richard
David Andrews,
This is a deliberately separate response to your comment because it does not address anything I have written. I am replying to your attempt to smear a reputable journal.
You say,
“Reputable peer-reviewed journals REQUIRE data cited in analyses to be available to the reader, if not in the paper itself then in accessible data bases. If you are now on the Editorial Board of E&E, Richard, you should tell your colleagues they need to get their act together if they want to be taken seriously.”.
The IPCC takes E&E seriously and has cited and quoted papers in E&E dozens of times.
Also, you justify your smear by citing a procedure that most journals now apply but was not a common practice in 2005 when E&E published the excellent paper you are trying to discredit.
Richard
Richard,
As you know, my focus is on Figure 1 of your paper. I suspect that the reason you have not clarified what data are shown, is that you do not know. Probably one of your coauthors in Ref 4 did the calculations. Correct me if I am wrong.
Since Arthur Rorsch is listed as the contact author for Ref 4, I wrote to him at the email address given. However I got an “undeliverable” message. If you have an updated email address for him, or for the third author, I would appreciate getting it. I note that Rorsch has a website, but when I try to go there my software warns me that that communications are not private, me data may be stolen, etc, so I am staying away.
According to some internet accounts, Energy and the Environment is a journal which will publish climate skeptic articles other journals will not. You probably take that as a badge of honor. But I assure you that the Ref 4 paper would be rejected by any reputable journal in its current form because of the PROCESS issues, not because of its conclusions. Not even referencing, let alone including, critical data causes the kind of problem we are having now. Perhaps it is a better journal than would be inferred from the one paper I have read, but I do not know.
Perhaps you think I am being pedantic insisting on footnotes and clear explanations of data processing. But without those disciplines we get garbage. And your Figure 1 is indeed garbage.
Dave
David Andrews,
You say to me,
“Perhaps you think I am being pedantic.”
No! I think you are being obnoxious, egregious and offensive because you are pained by factual information which refutes your superstitious belief in anthropogenic global warming.
The ONLY pertinent point is the surprising fact (which is as I have repeatedly explained to you above) that. THE VALIDITY OF THE DATA IS NOT PERTINENT TO THE CONCLUSION OF MY PAPER.
I yet again repeat why that is (from above where I expanded on it to Ed Berry) because I suspect you are persisting in your iterations of your nonsense in hope that readers will appear who read your twaddle away from its refutation.
“MY FIRST REPLY TO DAVID ANDREWS FULLY JUSTIFIED THE METHODOLOGY by saying,
“I and others have decided to accept the data and to assess if it can be used to support or to reject the assertion which you support. My 2008 paper demonstrates the data can be interpreted to encompass both completely anthropogenic and completely natural causes of the recent rise of atmospheric CO2 concentration although a natural cause is most likely.”
The data are widely used and all assertions e.g. of the IPCC are based on them. So, if the data were to provide a specific indication of support or rejection of an anthropogenic or a natural cause of the rise of atmospheric CO2 concentration then the validity of the data would warrant investigation to see if that rejects the conclusion.
But the investigation in my paper demonstrates the data encompasses the possibilities that the cause of rise is entirely natural, entirely anthropogenic or some combination of anthropogenic and natural causes. And my paper concludes saying,
“Hence, it cannot be known what if any effect altering the anthropogenic emission of CO2 will have on the future atmospheric CO2 concentration.”
It is perhaps interesting to note that the IPCC has also reported that it is not known what if any effect altering the anthropogenic emission of CO2 will have on the future atmospheric CO2 concentration. Chapter 2 from Working Group 3 in the IPCC’s Third Assessment Report (TAR) says:
“no systematic analysis has published on the relationship between mitigation and baseline scenarios”.[9]”
I add that the IPCC has made no change to that statement in its TAR.
Simply, my paper demonstrates the data indicates nothing of use and showing the data is inadequate would not alter that finding.
I said this in my first answer to David Andrews, when I wrote,
“As the quotation states, the Mauna Loa data are more reliable than the human emission data, but both data sets can be challenged (the Mauna Loa measurements are made on the side of an active volcano). And, as you point out, the stated error estimates provided for both data sets are clearly not correct and they are rarely plotted by the providers of the data; see https://www.esrl.noaa.gov/gmd/ccgg/trends/
However, if one accepts your claim that the error estimates are so large that they obscure the causal relationship you assert then one has to reject your assertion of the existence of that causal relationship because the existence is an unknown (i.e. it is obscured). And your “eyeball” does not overcome this problem because – as you say – the most it indicates is ‘both parameters are rising’.”
In other words, the validity of the data is not pertinent to the conclusion of my paper and I told David Andrews of that in my first reply to him.”
Richard
True, data is unimportant in your world. You said it, I didn’t.
Dear David,
Your recent comments have departed from science and evolved into baseless attacks on Richard’s paper and even the E&E journal. You also attacked Segalstad’s paper without any scientific justification.
I can make more relevant attacks on your paper that completely misinterprets how 14C data influence CO2 e-time, but I have more important things to do.
Like, c’mon, there are many things we can conclude in theoretical physics without using data.
Please get back to discussing science.
David Andrews:
You say to me,
“True, data is unimportant in your world. You said it, I didn’t.”
I SAID NOTHING OF THE KIND.
This is the second case of you claiming in this thread that I have said other than I did. As I did in the previous case, I am writing to reject your nonsense.
I wrote to you repeatedly above – and in the post which your most recent falsehood claims to be commenting – these statements,
“I and others have decided to accept the data and to assess if it can be used to support or to reject the assertion which you support. My 2008 paper demonstrates the data can be interpreted to encompass both completely anthropogenic and completely natural causes of the recent rise of atmospheric CO2 concentration although a natural cause is most likely.”
AND
“Simply, my paper demonstrates the data indicates nothing of use and showing the data is inadequate would not alter that finding.”
AND
“However, if one accepts your claim that the error estimates are so large that they obscure the causal relationship you assert then one has to reject your assertion of the existence of that causal relationship because the existence is an unknown (i.e. it is obscured). And your “eyeball” does not overcome this problem because – as you say – the most it indicates is ‘both parameters are rising’.”
AND
“In other words, the validity of the data is not pertinent to the conclusion of my paper and I told David Andrews of that in my first reply to him.”
THOSE QUOTATIONS EACH SAY THAT I THINK THE DATA MATTERS SO MUCH THAT I INVESTIGATED
(a) WHAT THE DATA DOES INDICATE
AND
(b) WHAT THE DATA CANNOT INDICATE.
The fact that my analysis demonstrates the data does not and cannot indicate what you want it to indicate does NOT mean I “don’t think the data matters”.
Richard
Dear Ed,
I have received an email comment on my last response to David Andrews.
I copy it to here because it may give others the laugh that it gave to me. It says to me,
“The main problem with your argument is that it is based on logic. People don’t want that anymore. They want to be entertained, shocked, judge.
It’s no good giving them the truth. They wouldn’t know what to do with it.
What they want to read is something like,
“Dear David Andrews,
If you took the trouble to read and comprehend what we wrote you’d be able to work out for yourself why I think you’re complete arse”.
I reckon that’s pretty subtle.”
Richard
Dear Dave,
To respond to your continued nagging of Richard over his Figure 1, please see the plot that I added below his PDF above. This plot uses Mauna Loa data with monthly resolution, and it extends beyond 2000.
This plot supports Richard’s Figure 1 and answers your questions about the data resolution. Surely, you could have plotted this yourself.
Dear Ed,
Thanks for your posting of the graph which “supports [my] Figure 1.
I do appreciate your effort. However, as I have repeatedly told David Andrews, the issue about the data resolution is a distraction; i.e. I have repeatedly told him,
“Simply, my paper demonstrates the data indicates nothing of use and showing the data is inadequate would not alter that finding.”
Having said that, I now draw attention to the final paragraph of my first reply to David Andrews because I think it is why David Andrews has mounted his campaign of distraction. It says that – while the data indicates nothing of use – you have extracted something very useful from the data.
The final paragraph of my first reply to David Andrews said,
“Importantly, Ed Berry builds on a finding in my paper by making a breakthrough in understanding (which I and all others failed to make). This has enabled him to assess the data in a way that quantifies the natural and anthropogenic contributions to the cause.”
THAT IS WHAT THIS THREAD SHOULD HAVE BEEN DISCUSSING AND WHICH DAVID ANDREWS HAS (I THINK DELIBERATELY) TRIED TO OBSCURE,
Richard
Dear Richard,
I agree with your comment. David Andrews is having a difficult time moving from basic physics to atmospheric physics. He incorrectly thinks Segalstad, all the authors Segalstad quotes, you, Harde, Salby, me, and many others are wrong. Yet, he cannot show with science that he is correct.
In his own paper, he incorrectly interpreted the 14C data to conclude the e-time for CO2 to exit the atmosphere is very long. He thinks he saved the world but he is only making a fool of himself. Even IPCC’s own data and papers agree the CO2 e-time is 3 to 5 years.
He so believes the alarmist climate dogma with his group-think buddies, that he cannot do good science.
Ed and Richard,
So Ed and I are both able to reproduce something like Richard’s Figure 1 with Mauna Loa data alone. The plot I made (see earlier post), like Richard’s Figure 1, was of the difference between yearly averages of successive years. The plot Ed made is of differences between monthly averages, separated by a year. He has apparently missed the point of my earlier comments, since he has not included error bars. But now that we data with a known origin, we can try to understand it.
I look at your plot Ed, I and see that the good correlation between human emissions and the CO2 “infow” trend (you have a typo, I think you meant “net inflow”), which was already apparent in Richard’s Figure 1, continues when the data is extended to about 2013. [It all makes sense. The more CO2 we humans put into the atmosphere, the faster the CO2 level grows in the atmosphere, though a good bit seems to be going to the oceans.] You Ed, I gather, are supporting Richard’s original claim that the fluctuations in the measured “infow” are significant, and their lack of correlation with the emissions precludes a causal relationship between emissions and CO2 concentration. You have made that wrong argument elsewhere. (I am not sure if Richard is still arguing that point or not, since he is emphatic in saying that his conclusions are independent of the validity of the Figure 1 data.)
I pointed out in my first post on the infamous Figure 1, that the net inflow data are the difference between two nearly equal concentration numbers. If you ever took a freshmen physics lab course, alarm bells should sound. If the two concentration numbers differ by only .3%, as in this case, then the relative error of their difference is multiplied by a factor of more than 300! That has always been my point. The fluctuations are nothing but noise. Meanwhile you dismiss the clear fact that increases in atmospheric CO2 level DO correlate with emissions when decade time scales are used! The data are not good enough to establish this on annual time scales.
An additional reason I wanted to know more about the particulars of Richard’s data, is the following. It is well known (even to a basic physicist like me), that atmospheric mixing is much faster east and west, than it is north and south, and mixing is especially slow crossing the equator. Emissions in the southern hemisphere don’t reach Mauna Loa for about a year. Trying to correlate yearly fluctuations in Mauna Loa measurements, let alone the monthly fluctuations in Ed’s plot, with global emissions is foolish. No doubt if a good source of southern hemisphere data were available, you would stand a better chance.
SO ACT LIKE A SCIENTIST AND ESTIMATE ERROR BARS FOR THE GRAPH YOU GENERATED, ED. You will learn something.
On to some other points. A couple of posts ago you accused me, Ed, of “departing from science” with my criticisms of Richard’s and Segelstad’s paper “without any scientific justification”. You urged me to “get back to science.” SCIENCE IS FIRST AND FOREMOST ABOUT USING DATA INTELLIGENTLY. So when I criticize Richard (or E&E) for being sloppy with data, I am very much talking about and defending science. Salby’s mistake, judging from his video, was the same as Richard’s: not paying attention to uncertainties in the data. Based on his support of the Essenhigh paper, Segelstad erroneously believed that “deltaC14” was equivalent to C14 concentration. Hence his concentration “data” were wrong. If you start with wrong data, you are led to wrong conclusions, e.g., how long carbon stays in circulation. You are likely to conclude that anthropogenic carbon is sequestered much sooner than it really is. Segelstad misinterpreted DATA and reached a wrong conclusion. Harde made the same mistake and unsurprisingly reached the same wrong conclusion. You, Ed, made the same mistake in your 2019 publication and inevitably reached the same wrong conclusion. There is a clear commonality here. All of you misinterpreted someone else’s data, whether the uncertainties or the definition of the variables measured, and all of you paid for it. Maybe you can sometimes reach correct conclusions from general principles, without data. But you can hardly ever reach correct conclusions with wrongly interpreted data.
Finally Ed, let’s talk again about C14 data and your model, since you have brought it up again. In your 2019 paper you proudly showed the agreement between your model of C14 concentration and the evolution of the “bomb pule” of “deltaC14” following atmospheric nuclear testing in the 1950’s and 1960’s. Nine months after I pointed out that “delta C14” is not the same as concentration, you finally conceded I was right. You now have the capability to correctly calculate C14 concentration versus time after the bomb pulse, and the curve looks nothing like the one in your 2019 paper. If your model fit the wrongly interpreted data, how on earth can it fit the corrected data? It does not. Compare Figure 17 of your preprint with Figure 2 in my paper. Then listen to Richard Feynman whom we both respect: “If the theory doesn’t match the data, the theory is wrong.”
You and Harde both are fixated on single time constant models. They are inadequate. The initial rapid C14 concentration decay measures the time it takes for the C14 to mix with other carbon in the carbon cycle. Once mixing is complete, there is no reason to expect the concentration to continue to fall at the same rate. Notice that the data resemble the Bern Model, which you criticize without understanding. Notice that Caldeira et al were not only able to fit the data, but also make predictions that were born out.
Your understanding of science, Ed, has a blind spot. DATA DATA DATA.
Dave
David Andrews,
Your long (and erroneous) diatribe addressed to Ed and me yet again ignores all you have been told in this thread; e.g. my repeated explanation to you that
“Simply, my paper demonstrates the data indicates nothing of use and showing the data is inadequate would not alter that finding.”
And your daft diatribe concludes saying,
“Your understanding of science, Ed, has a blind spot. DATA DATA DATA.
Dave”
Whatever the truth of that assertion, some things are very clear; i.e.
Your understanding of science, Dave, has several omissions. They include LOGIC, REASON and THE SCIENTIFIC METHOD.
Richard
David Andrews,
I answered your long ( and erroneous) diatribe which you addressed to Ed and me.
For the benefit of onlookers,
I NOW CALL UPON YOU TO APOLOGISE FOR YOUR ATTACKS OF MY PAPER, MY WORDS AND ME because you have now admitted your attacks have no foundation:
i.e. I expect retraction and apology for your attacks because – as I explain in this post – you have now admitted those attacks were – and are – wrong.
My first reply to you said,
“It should first be noted that there are few available empirical data that can be trusted. In fact, these are limited to the observed increase of the concentration of CO2 in the atmosphere, well recorded at Mauna Loa since 1958 (see Figure 2). The annual flow Fa into the atmosphere can be derived from this (see Figure 1).”
And your response to that began by saying,
“Richard,
Your Figure 1 claims to show that the rate of increase in atmospheric CO2 (“Fa observed”) has been changing by up to a factor of three from one year to the next in recent decades. That is a remarkable claim that I do not believe. ”
But your erroneous diatribe addressed to Ed and me begins by saying,
“Ed and Richard,
So Ed and I are both able to reproduce something like Richard’s Figure 1 with Mauna Loa data alone. The plot I made (see earlier post), like Richard’s Figure 1, was of the difference between yearly averages of successive years. The plot Ed made is of differences between monthly averages, separated by a year. He has apparently missed the point of my earlier comments, since he has not included error bars. But now that we data with a known origin, we can try to understand it.”
i.e. YOU HAVE NOW ADMITTED THAT MY FIGURE 1 IS CORRECT – n.b. NOT “a remarkable claim” – AND YOUR DISBELIEF WAS WITHOUT FOUNDATION.
1.
As I have quoted in this post, my first reply to you stated the source of the data, and that reply also provided a link to that source data; viz. https://www.esrl.noaa.gov/gmd/ccgg/trends/
2.
You now admit you can reproduce the graph which is an admission that my graph was correct.
3..
You lie that I have “apparently missed the point of [your] earlier comments, since [I have] not included error bars” when I have repeatedly addressed that point.
For example, in my first reply to you I quoted from my paper and explained the quotation by saying,
“As the quotation states, the Mauna Loa data are more reliable than the human emission data, but both data sets can be challenged (the Mauna Loa measurements are made on the side of an active volcano). And, as you point out, the stated error estimates provided for both data sets are clearly not correct and they are rarely plotted by the providers of the data; see https://www.esrl.noaa.gov/gmd/ccgg/trends/
However, if one accepts your claim that the error estimates are so large that they obscure the causal relationship you assert then one has to reject your assertion of the existence of that causal relationship because the existence is an unknown (i.e. it is obscured). And your “eyeball” does not overcome this problem because – as you say – the most it indicates is ‘both parameters are rising’.”
And I later said of that,
“In other words, the validity of the data is not pertinent to the conclusion of my paper and I told David Andrews of that in my first reply to him.”
SO, DAVID ANDREWS, I NOW EXPECT A COMPLETE REBUTTAL AND APOLOGY FROM YOU FOR YOUR LIES, INSULTS AND MISREPRESENTATIONS OF MY PAPER, MY WORDS AND ME.
(They are a pain in the fundament).
Richard
Richard
I guess being a shill for the coal industry that employed you has made you sensitive.
Dave
David Andrews,
I am not a “shill” for anybody or anything. You on the other hand …?
As for my “sensitivity”, I object to lies and smears of me and my work especially when they come from an obnoxious troll such as yourself. If you had any decency at all then you would have apologised but you don’t so, instead, you have added another offensive lie.
Richard
FWIW, gavin cawley also goes by the name of dikran marsupial (a well known promoter of the mass balance fallacy). Thank you, Richard (as well as dr. ed in posting) for this important work & have always enjoyed your commentary over at watts’.
Dear fonzie,
Thank you for your comment and information. I respond by pointing out that opinions on the web should be rejected when they are presented by people who hide behind fake identities (if they are not willing to put their name(s) to their opinions then there is no reason to assume those opinions have any credibility), and anyone who accepts the silly mass balance fallacy deserves ridicule.
Richard
Richard, i thought you might enjoy this one from the archives:
non se·qui·tur
/ˌnän ˈsekwədər/
noun
a conclusion or statement that does not logically follow from the previous argument or statement
•Paul Birch
August 5, 2010 at 12:06 pm
The mass balance claim is a non sequitur. We know that the total fluxes are far higher than the anthropogenic flux and we know that many of the other components are variable, but we do not know how variable. We simply do not know how much CO2 there would have been in the atmosphere at this time in the absence of anthropogenic emission. CO2 levels might have risen at the same rate, or stayed constant, or even gone down. They might even have risen faster!
•Paul Birch
August 6, 2010 at 1:10 pm
Dikran Marsupial says:
August 6, 2010 at 9:56 am
“(ii) “the CO2 increase is man made” does not have to mean that the rise would not have ocurred if not for anthropogenic emissions, it only means that the particular rise that we have actually observed is man made. That is not the same thing at all.”
This is weaseling of high order. The clear implication of any such statement is that if its weren’t for man it wouldn’t have happened. This is the only interpretation that has any significance for climatology in general or the AGW issue in particular.
•Paul Birch
August 7, 2010 at 6:54 am
I have to wonder what Ferdinand & Co think they mean by saying “the CO2 increase is man made”. When they can seriously attribute a rise in lake levels to a boy’s peeing in it, arguing with them is like … er… peeing into the ocean!
What any normal scientist or English speaker would understand by the claim is
1) CO2 levels would not have increased if man had not emitted this CO2.
It doesn’t necessarily imply they would have stayed the same – they could have fallen – but if they would have risen at all then we could only say “part of the CO2 increase is man-made”.
Ferdinand & Co, with their insistence that what would have happened to other components of the mass balance is irrelevant, do not seem to give their claim this standard meaning.
Another possible interpretation is:
2) Most of the extra CO2 molecules in the air are the ones put there by man.
But they don’t seem to mean this either – correctly pointing out that since there has been interchange with other reservoirs this isn’t actually true, and arguing that the precise origin of particular molecule doesn’t matter, only the net bulk quantities.
We seem to be left with the residual “meaning”:
3) CO2 levels have risen by no more than the amount of CO2 man has added to the atmosphere.
Yet they flatly deny that this is all they mean. And indeed, if that were all they meant, the original claim would have been pretty pointless; why not just say (3) straight out?
So I’m left with a claim completely empty of meaning. I have no idea what they think they mean. (This isn’t quite true; I suspect they did mean (1) at the beginning, but because their argument has been soundly debunked, are now resorting to endless sophistries to avoid admitting it, even to themselves) . So I challenge them to state, clearly and categorically, what the statement means to them.
•Paul Birch
August 10, 2010 at 5:23 am
Ferdinand Engelbeen says:
August 9, 2010 at 9:21 am
“That is the fundamental difference in our opinions:
The temperature would have increased the CO2 level in absence of human emissions. But it didn’t, because there were human emissions which were much larger than the observed increase (except for the period 1850-1900). “
fonzie,
Thank you. I did enjoy your archive material (as you say you suspected I would).
I especially enjoyed the ending which is a quote of an inane assertion from Ferdinand E.
I am amazed that anybody would compose a sentence which claims
(a)
temperature change alters the equilibrium level of atmospheric CO2 concentration
but
(b) a temperature change did not alter the equilibrium level of atmospheric CO2 concentration for a reason unrelated to the temperature and unrelated to the equilibrium.
Richard
Yes, i think it’s a sorry testament to the climate blogosphere when men as intelligent as these two can get away with saying just about anything — and make it stick, too. (very difficult to do “science” in the blogosphere when cogent argumentation can’t even begin to emerge from the noise)
Richard, i’m in a somewhat awkward spot here as i’ve been relegated to lurker status well over a year now. My good neighbor’s wifi went out here in the french quarter during the months leading up to covid. (it came and went for a few months before finally going kaput) Given the shut downs and all, i suppose that the cable company just didn’t bother with the fix. So, my responses will be very slow. i actually like being without — unplugged, if you will — as it’s been quite refreshing. It also has given me a chance to stand back and think about all things climate in a more objective manner.
i actually have something interesting (and relevant to your post) to share with you here that i noticed in the ice core data. Firstly, i just want to show you the data. And, then secondly, i want to take a stab at what i think is going on. Feel free to critique away — as i learn a lot from people that i disagree with. (you might say the F.E. has taught me well… 😉)
First, i have to check my “woodfortrees” graphs as they may be slightly out dated. (hope to be back soon)…
O.K., here goes nuthin’…
First, i want to give the derivative plot which i know you’re familiar with. (perfectly matched trend lines as you can see — this is pertinent):
https://www.woodfortrees.org/plot/esrl-co2/from:1958/mean:12/derivative/plot/hadsst3sh/from:1958/scale:0.26/offset:0.099/plot/esrl-co2/from:1958/mean:12/derivative/trend/plot/hadsst3sh/from:1958/scale:0.26/offset:0.099/trend
Then we’ll take the integrals of both. Again, nothing new here:
http://www.woodfortrees.org/plot/esrl-co2/from:1958/mean:12/derivative/integral/plot/hadsst3sh/from:1958/scale:0.26/offset:0.099/integral/plot/esrl-co2/from:1958/mean:12/derivative/trend/plot/hadsst3sh/from:1958/scale:0.26/offset:0.099/trend
So as not to potentially overload dr. ed’s software, i’ll continue in another comment. (also, to make sure that i’ve avoided a snafu… 😖)
So far so good…
Next, let’s go back to the derivative plot, but this time extend the temperature data all the way back to 1850:
http://www.woodfortrees.org/plot/esrl-co2/from:1958/mean:12/derivative/plot/hadsst3sh/from:1850/scale:0.26/offset:0.099/plot/esrl-co2/from:1958/mean:12/derivative/trend/plot/hadsst3sh/from:1958/scale:0.26/offset:0.099/trend
Then, we’ll take the integral:
http://www.woodfortrees.org/plot/hadsst3sh/from:1850/scale:0.26/offset:0.099/integral
Eyeballing my last wft graph, i’m getting about a 127 ppm increase from 1850. Ice cores tell us that co2 concentrations in 1850 were 287 ppm. That would peg current concentrations at 414 ppm. Let’s see how i did (as compared to this year and a half old graph):
https://www.sealevel.info/co2.html
Not bad. It’s been a while, but i have in the past compared my calculated data with the actual data. The greatest diversion between the two is just 10ppm circa 1920. (of course, that’s no surprise given that ice cores are a smoothed product)
Lastly, Richard, i want to show you a graph of law dome and the moberg temperature reconstruction going back centuries courtesy of david middleton. You, yourself, linked to his 2012 post which contained the graph. (so, thank you oh so much!):
https://i0.wp.com/i90.photobucket.com/albums/k247/dhm1353/LawMob1.png
i need to take a look at it before i add commmentary. So, i’ll post this now and get back with another comment.
Richard, my battery is dying, — ah the perils of lurking in a coffee shop — so i’ll be brief. Take a close look at the data from about 1600 to 1850 or so. You can see that, with a level of exactitude, low temps correlate with slow (or even negative growth). Higher temps correlate with faster growth. Keep in mind that these are centuries, so we’re also seeing a change in the equilibrium temperature over time, too. (you might need to use the straight edge of a device to check this out) So, it appears in the data that the so called “derivative plot” holds true for the past 500 years at which point the relationship abruptly ends. Wish i had more time, but it’s time now to post. Back later to discuss what might be going on here. Always a pleasure…
“…what is the physics that makes “natural” carbon from the oceans switch places with anthropogenic carbon?”
“I guess being a shill for the coal industry that employed you has made you sensitive.”
Mister Dave would do well to focus more on science and less on insolence. (he’s obviously having a hard time walking and chewing gum at the same time)…
O.K., fonzie’s back…
i know just enough about the carbon cycle to know that i don’t know enough about the carbon cycle. (so ignorance is bliss… 🤔) That won’t stop me from pontificating here. At the very least, i might find out where i’m going wrong.
A long time ago, when watts had an abundance of (quite good) technical posts, there was an interesting post at wuwt on carbon dioxide levels over the holocene. Apparently, the holocene was unique among interglacials in that co2 levels rose (from 260ppm to 280ppm) when they should not have. The commentary for that particular post was also interesting, as commenters were postulating as to how an anthropogenic influence might have made that happen.
Returning to the middleton graph,
https://i0.wp.com/i90.photobucket.com/albums/k247/dhm1353/LawMob1.png
we can easily see carbon dioxide growth taking off circa 1750 coincident with a sudden step rise in temperature. One has to wonder what that co2 rise would have looked like were there no anthropogenic influence. Particularly at that time land usage would have been the predominant issue. Seems to me like natural CO2 was having a difficult time sinking out with land clearance (and later on with competition from fossil fuel emissions). Thus, perhaps, we see a build up in the atmosphere that would not be there were it not for man.
The ipcc tells us that, since 1750, we have cut down about just as many trees as have regrown. So we have effectively taken away trees as a carbon dioxide sink. And, of course, the addition from fossil fuels is twice that of land clearance. Add to that the resultant warming since 1750, exceptional and presumably anthropogenic (even if indirectly so), which causes greater outgassing from the oceans. These various factors may be producing the unusual rise in atmospheric carbon dioxide that we have seen.
If we assume the validity of ice cores, carbon dioxide levels change very little with time (certainly so since 1750). If an anthropogenic influence has caused a build up of natural and anthropogenic carbon dioxide, then we can expect that build up to eventually subside. The ocean/atmospheric system holds CO2 at a ratio of 75 to 1 at current equilibrium. And that’s not going to change — even with the paltry 1% addition of fossil fuels to the mix. So, the historic rise in CO2 is only temporary, even though it looks permanent to our parochial time scales.
O.K., Richard — if you’re still there — tear me up (🤕)…
Thank you again, Richard, for this post. You’ve referenced this paper over at watts in the past and now i finally get to see it. It’s always been my complaint that the carbon data needs greater scrutiny in the skeptic blogosphere. (it’s probably the only argument that can actually undo the agw juggernaut) And thanks to Dr. Ed for shining the light on the carbon cycle as well.
fonzie,
I see no need to “tear [you] up”.
My opinion is clear from the above paper and it explains that there is little data which is definitive because the world is big and complex.
However, I don’t trust the ice core data which I am certain are misleading, see
https://www.heartland.org/multimedia/videos/richard-courtney-zbigniew-iccc1
Richard
Yeah… Everything that i wrote was predicated on assumption of the validity of ice cores. (i should have made that clear from the get go) If ice cores are false, then anything goes — we can all break out the cigars. On the other hand, even if true, ice cores present a problem for the party line. And that’s what i’m getting at. Plus, even if cores are erroneous, we might still be able to learn a little something from them. Bottom line, ice cores to date have never been verified (and are not likely to ever be).
Thanks for the link. i look forward to watching it when time permits. (battery issues again… 😖)
“If we assume the validity of ice cores, carbon dioxide levels change very little with time (certainly so since 1750).”
should read
“levels should change”
https://edberry.com/blog/climate/climate-physics/limits-to-carbon-dioxide-concentation/#comment-97317
(testing)…