
by Edwin X Berry
On December 14, 2021, Science of Climate Change published my scientific paper:
The impact of human CO2 on atmospheric CO2 – SCC (klimarealistene.com)
The United Nations Intergovernmental Panel on Climate Change (IPCC) assumes natural CO2 stayed constant at 280 ppm after 1750 and human CO2 dominated the CO2 increase.
This paper proves this IPCC assumption is wrong because it conflicts with IPCC’s own natural carbon cycle which is valid data.
This paper has worldwide political and economic importance because it overturns the basis of all climate laws, regulations, treaties, and taxes. It does this with a simplicity that can win in a court of law.
This paper shows the 14CO2 e-time is 10.0 years which limits the 12CO2 e-time to less than 10 years, contrasting with IPCC’s claim that human CO2 stays in the atmosphere for thousands of years.
There are three kinds of scientific papers. The first, most prevalent kind adds new data to our knowledge base. The second kind develops ideas or theories that can make testable predictions. The third, most rare kind proves a widely accepted belief is wrong. This paper is the third kind.
Proof that a theory is wrong is the most powerful way to advance science because it overrides all the evidence and published papers that claim or assume the theory is true. Scientific truth lies in what is left over after proving a theory is false.
This paper shows the physics and references that back up Chapters 3, 4, and 5 of my book Climate Miracle.
My published paper is an expanded version of my Preprint #3. After you read my published paper, you may discuss it here.
I would love to post my full paper here but if I did, I would be unethical because SCC needs to make a profit to stay in business and their business model requires them to receive $10 per paper or $60 to download a full year of their published papers.
Below are the Contents, Abstract, Data, Conclusions, and References.
Contents
Abstract
1. Introduction
- 1.1 Definitions
- 1.2 The IPCC basic assumption
- 1.3. The IPCC ice-core assumption
- 1.4 Isotope data show CO2 increase is natural
2. Method
- 2.1 The data
- 2.2 The basics
- 2.3 The physics carbon cycle model
- 2.4 Data contradict IPCC’s basic assumption
- 2.5 The Bern model
3. Carbon data review
- 3.1 IPCC’s carbon cycle data
- 3.2 IPCC’s natural carbon cycle
- 3.3 IPCC’s human carbon cycle
4. Physics model
- 4.1 Physics model for one reservoir
- 4.2 Physics model properties
- 4.3 Physics carbon-cycle model
- 4.4 RC Network analogy
- 4.5 Method of calculation
5. Physics model results
- 5.1 The physics human carbon cycle
- 5.2 Values at IPCC’s extreme error bounds
- 5.3 Physics model carbon cycle pulse decay
- 5.4 The physics model vs the Bern model
6. Discussion
- 6.1 δ14C data show the CO2 increase is natural
- 6.2 How nature may have increased its CO2 level
- 6.3 COVID-19 CO2 data suggest the increase is natural
- 6.4 The physics model will help future research
Conclusions
Data and Calculations Availability
Acknowledgments:
References
Abstract
A basic assumption of climate change made by the United Nations Intergovernmental Panel on Climate Change (IPCC) is natural CO2 stayed constant after 1750 and human CO2 dominated the CO2 increase. IPCC’s basic assumption requires human CO2 to stay in the atmosphere longer than natural CO2. But human CO2 and natural CO2 molecules are identical. So, human CO2 and natural CO2 must flow out of the atmosphere at the same rate, or e-time.
The 14CO2 e-time, derived from δ14C data, is 10.0 years, making the 12CO2 e-time less than 10 years. The IPCC says the 12CO2 e-time is about 4 years and IPCC’s carbon cycle uses 3.5 years.
A new physics carbon cycle model replicates IPCC’s natural carbon cycle. Then, using IPCC’s natural carbon cycle data, it calculates human carbon has added only 33 [24-48] ppmv to the atmosphere as of 2020, which means natural carbon has added 100 ppmv. The physics model calculates if human CO2 emissions had stopped at the end of 2020, the human CO2 level of 33 ppmv would fall to 10 ppmv in 2100.
After the bomb tests, δ14C returned to its original balance level of zero even as 12CO2 increased, which suggests a natural source dominates the 12CO2 increase.
2.1 The data
This paper uses these data,
- IPCC’s natural carbon cycle data (IPCC, 2013, pp. 470-486)
- δ14C data (Turnbull et al., 2017)
- 14C data (Turnbull et al., 2017)
- 12C data before 1960 (Etheridge et al., 1996; Jaworowski, 2007)
- 12C data after 1960 (Keeling et al., 2001)
- Human carbon emissions data (Gilfillan et al., 2020)
Conclusions
IPCC’s basic climate change assumption is natural CO2 stayed constant after 1750 as human CO2 causes all (or dominates) the increase in atmospheric CO2.
To support its basic assumption, the IPCC claims “The removal of human-emitted CO2from the atmosphere by natural processes will take a few hundred thousand years (high confidence).” But the human-carbon e-time must equal the natural-carbon e-time because human and natural CO2 molecules are identical.
The 14CO2 e-time, derived from δ14C data, is 10.0 years, making the 12CO2 e-time less than 10 years. The IPCC says the 12CO2 e-time is about 4 years and IPCC’s carbon cycle uses 3.5 years.
After the bomb tests, δ14C returned to its original balance level of zero even as 12CO2 increased. This suggests the added 12CO2 came from a natural source.
The physics model calculates, deductively, the consequences of IPCC’s natural carbon cycle data. The physics model first replicates IPCC’s natural carbon cycle. Then, using the same IPCC data, it calculates that human carbon has added only 33 [24-48] ppmv to the atmosphere as of 2020, which means natural carbon has added 100 ppmv. The physics model further calculates if human CO2 emissions had stopped at the end of 2020, the human CO2 level of 33 ppmv would fall to 10 ppmv by 2100.
The IPCC argues the absence of ice-core data – that might show the natural CO2 level was greater than 280 ppmv before 1750 – supports its basic assumption. But the physics model shows IPCC’s basic assumption, and therefore IPCC’s ice-core assumption, contradict IPCC’s natural carbon cycle data.
References
Andrews, D.E. 2020: Correcting an Error in Some Interpretations of Atmospheric 14C Data, Earth Sciences, 9(4), pp. 126-129, https://doi:10.11648/j.earth.20200904.12. http://www.sciencepublishinggroup.com/j/earth
Ballantyne, A.P., Alden, C.B., Miller, J.B., Tans, P.P., and White, J.W.C. 2012: Increase in observed net carbon dioxide uptake by land and oceans during the past 50 years, Nature 488, pp. 70-73. doi:10.1038/nature11299. https://www.nature.com/articles/nature11299
Beck, E. 2007: 180 years of atmospheric CO2 gas analysis by chemical methods. Energy & Environment. Volume 18, No. 2. https://21sci-tech.com/Subscriptions/Spring%202008%20ONLINE/CO2_chemical.pdf https://doi.org/10.1260/095830507780682147
Berry, E.X. 2019: Human CO2 emissions have little effect on atmospheric CO2. International Journal of Atmospheric and Oceanic Sciences. Volume 3, Issue 1, June, pp 13-26. http://www.sciencepublishinggroup.com/journal/paperinfo?journalid=298&doi=10.11648/j.ijaos.20190301.13
Berry, E.X. 1967: Cloud droplet growth by collection. J. Atmos. Sci. 24, 688-701. DOI: https://doi.org/10.1175/1520-0469(1967)024<0688:CDGBC>2.0.CO;2
Berry, E.X. 1969: A mathematical framework for cloud models. J. Atmos. Sci. 26, 109-111. https://moam.info/a-mathematical-framework-for-cloud-models-edberrycom_59a6a1c81723dd0c40321bda.html
Berry, E. X and Reinhardt, R.L. 1974a: An analysis of cloud drop growth by collection. Part I. Double distributions. J. Atmos. Sci., 31, 1814–1824. https://journals.ametsoc.org/view/journals/atsc/31/7/1520-0469_1974_031_1814_aaocdg_2_0_co_2.xml
Berry, E. X and Reinhardt, R.L. 1974b: An analysis of cloud drop growth by collection. Part II. Single initial distributions. J. Atmos. Sci., 31, 1825–1831. https://journals.ametsoc.org/view/journals/atsc/31/7/1520-0469_1974_031_1825_aaocdg_2_0_co_2.xml
Berry, E. X and Reinhardt, R.L. 1974c: An analysis of cloud drop growth by collection. Part III. Accretion and self-collection. J. Atmos. Sci., 31, 2118–2126. https://journals.ametsoc.org/view/journals/atsc/31/8/1520-0469_1974_031_2118_aaocdg_2_0_co_2.xml
Berry, E. X and Reinhardt, R.L. 1974d: An analysis of cloud drop growth by collection. Part IV. A new parameterization. J. Atmos. Sci., 31, 2127–2135. https://journals.ametsoc.org/view/journals/atsc/31/8/1520-0469_1974_031_2127_aaocdg_2_0_co_2.xml
Caillon, N., Severinghaus, J.P., Jouzel. J., Barnola, J., Kang, J., and Lipenkov, V.Y., 2003: Timing of atmospheric CO2 and Antarctic temperature changes across Termination III. Science, Vol. 299, No. 5613. https://www.science.org/doi/10.1126/science.1078758
Courtney, R.S. 2008: Limits to existing quantitative understanding of past, present and future changes to atmospheric CO2 concentration. International Conference on Climate Change, New York. https://www.heartland.org/multimedia/videos/richard-courtney-iccc1. https://edberry.com/blog/climate/climate-physics/limits-to-carbon-dioxide-concentation/
Courtney, R.S. 2019: Public email communication to global-warming-realists@googlegroups.com, 21 November 2019. https://edberry.com/blog/climate/climate-physics/preprint3/
Essenhigh, R.E. 2009: Potential dependence of global warming on the residence time (RT) in the atmosphere of anthropogenically sourced CO2. Energy Fuel 23, pp. 2773-2784. https://pubs.acs.org/doi/abs/10.1021/ef800581r
Etheridge, D.M., Steele, L.P., Langenfelds, R.L., Francey, R.J., Barnola, J.-M., and Morgan, V.I. 1996: Natural and anthropogenic changes in atmospheric CO2 over the last 1000 years from air in Antarctic ice and firn. Journal of Geophysical Research. 101:4115-4128. https://www1.ncdc.noaa.gov/pub/data/paleo/icecore/antarctica/law/law_CO2.txt
Fischer, H., Wahlen, M., Smith, J., Mastroianni, D., and Deck, B., 1999: Ice core records of atmospheric co2 around the last three glacial terminations. Science, Vol. 283, No. 5408. https://www.science.org/doi/10.1126/science.283.5408.1712
Gilfillan D., Marland, G., Boden, T., and Andres, R. 2020: Global, Regional, and National Fossil-Fuel CO2 Emissions: 1751-2017. CDIAC-FF, Research Institute for Environment, Energy, and Economics, Appalachian State University. doi:10.15485/1712447. https://data.ess-dive.lbl.gov/view/doi:10.15485/1712447
Global Monitoring Laboratory. 2020a: Trends in Atmospheric Carbon Dioxide: Monthly Average Mauna Loa CO2. Earth Systems Research Laboratories. https://www.esrl.noaa.gov/gmd/ccgg/trends/
Global Monitoring Laboratory. 2020b: Can we see a change in the CO2 record because of COVID-19?Earth Systems Research Laboratories. https://www.esrl.noaa.gov/gmd/ccgg/covid2.html
Gruber, N., Clement, D., Carter, B., Feely, R., van Heuven S., Hoppema, M., Ishii, M., Key, R., Kozyr, A., Lauvset, S., Lo Monaco, C., et al. 2019: The oceanic sink for anthropogenic CO2 from 1994 to 2007. Science, 15. March (363) pg. 1193. https://www.sciencemagazinedigital.org/sciencemagazine/15_march_2019_Main/MobilePagedArticle.action?articleId=1472451#articleId1472451
Happer, W., and van Wijngaarden, W.A. 2020: Physics Rate Equations. Princeton U. Princeton, NJ, USA. (Unpublished Work)
Harde, H. 2017: Scrutinizing the carbon cycle and CO2 residence time in the atmosphere. Global and Planetary Change. 152, 19-26. https://www.sciencedirect.com/science/article/abs/pii/S0921818116304787
Harde, H. 2019: What Humans Contribute to Atmospheric CO2: Comparison of Carbon Cycle Models with Observations. International Journal of Earth Sciences. Vol. 8, No. 3, pp. 139-159. http://www.sciencepublishinggroup.com/journal/paperinfo?journalid=161&doi=10.11648/j.earth.20190803.13
Harde, H. and Salby, M. L. 2021: What Controls the Atmosphere CO2 Level? Science of Climate Change, Vol. 1, No. 1, August 2021, pp. 54-69. https://doi.org/10.53234/scc202111/28. https://scc.klimarealistene.com/produkt/what-controls-the-atmospheric-CO2-level/
Hua, Q., Barbetti, M., and Rakowski, A.Z. 2013: Atmospheric radiocarbon for the period 1950–2010. Radiocarbon. Vol 55, pp. 2059–2072. Table S2c. https://doi.org/10.2458/azu_js_rc.v55i2.16177
Humlum, O., Stordahl, K., and Solheim, J.E. 2013: The phase relation between atmospheric CO2 and global temperatures. Global and Planetary Change, 100, pp 51-69. https://www.sciencedirect.com/science/article/abs/pii/S0921818112001658
IPCC, 2013: Ciais, P., Sabine, C., Bala, G., Bopp, L., Brovkin, V., Canadell, J., Chhabra, A., DeFries, R., Galloway, J., Heimann, M., Jones, C., Le Quéré, C., Myneni, R.B., Piao, S., and Thornton, P. 2013: Carbon and Other Biogeochemical Cycles. In: Climate Change 2013: The Physical Science Basis. Contribution of Working Group I to the Fifth Assessment Report of the Intergovernmental Panel on Climate Change [Stocker, T.F., Qin, D., Plattner, G.-K., Tignor, M., Allen, S.K. Boschung, J., Nauels, A., Xia, Y., Bex, V., and Midgley, P.M. (eds.)]. Cambridge University Press, Cambridge, United Kingdom and New York, NY, USA.https://www.ipcc.ch/site/assets/uploads/2018/02/WG1AR5_Chapter06_FINAL.pdf
IPCC. 2007: Climate Change 2007 – The Physical Science Basis. Contribution of Working Group 1 to the Fourth Assessment Report of the IPCC. Annex 1: Glossary: Lifetime. https://www.ipcc.ch/site/assets/uploads/2018/02/ar4-wg1-annexes-1.pdf
Jaworowski, Z. 2007: CO2: The greatest scientific scandal of our time. 21st CENTURY Science & Technology. https://21sci-tech.com/Articles%202007/20_1-2_CO2_Scandal.pdf
Joos, F. 2002: Parameters for tuning a simple carbon cycle model. UNFCCC. https://unfccc.int/resource/brazil/carbon.html
Joos, F., Roth, R., Fuglestvedt, J.S., Peters, G.P., Enting, I.G., von Bloh, W., Brovkin, V., Burke, E.J., Eby, M., Edwards, N.R., et al. 2013: Carbon dioxide and climate impulse response functions for the computation of greenhouse gas metrics: a multi-model analysis. Atmos. Chem. Phys. 13, 2793-2825. doi:10.5194/acpd-12-19799-2012, https://acp.copernicus.org/articles/13/2793/2013/acp-13-2793-2013.pdf
Keeling, C.D., Piper, S.C., Bacastow, R.B., Wahlen, M., Whorf, T.P., Heimann, M., and Meijer, H.A. 2001: Exchanges of atmospheric CO2 and 13CO2 with the terrestrial biosphere and oceans from 1978 to 2000. I. Global aspects, SIO Reference Series, No. 01-06, Scripps Institution of Oceanography, San Diego. 88 pages. https://scrippsCO2.ucsd.edu/data/atmospheric_CO2/primary_mlo_CO2_record.html
Kohler, P., Hauck, J., Volker, C., Wolf-Gladrow, D.A., Butzin, M., Halpern, J.B., Rice, K., and Zeebe, R.E. 2017: Comment on ‘Scrutinizing the carbon cycle and CO2 residence time in the atmosphere’ by H. Harde. Global and Planetary Change. 2017. https://www.soest.hawaii.edu/oceanography/faculty/zeebe_files/Publications/KoehlerGPC17.pdf
Kouwenberg, L.L.R. 2004: Application of Conifer Needles in the Reconstruction of Holocene CO2 Levels. Ph.D. Thesis. Univ. Utrecht, Netherlands. https://dspace.library.uu.nl/bitstream/handle/1874/243/full.pdf
Kouwenberg, L., Wagner, R., Kürschner, W., and Visscher, H. 2005a: Atmospheric CO2 fluctuations during the last millennium reconstructed by stomatal frequency analysis of Tsuga heterophylla needles. Geology, 33 (1): 33–36. https://doi.org/10.1130/G20941.1
Kouwenberg, L., Wagner, R., Kürschner, W., and Visscher, H. 2005b: CO2 fluctuations during the last millennium reconstructed by stomatal frequency analysis. https://plantstomata.wordpress.com/2019/03/18/CO2-fluctuations-during-the-last-millenium-reconstructed-by-stomatal-frequency-analysis/
Kuo, C., Lindberg, C., and Thomson, D. 1990: Coherence established between atmospheric carbon dioxide and global temperature. Nature 1990, 343, 709–714. https://www.nature.com/articles/343709a0
MacRae, A. 2008: CO2 is not the primary cause of global warming: the future cannot cause the past. Icecap. http://icecap.us/images/uploads/CO2vsTMacRae.pdf )
Munshi, J. 2015a: Responsiveness of Atmospheric CO2 to Anthropogenic Emissions: A Note (August 21, 2015). Available at SSRN: https://ssrn.com/abstract=2642639 or http://dx.doi.org/10.2139/ssrn.2642639
Munshi, J. 2015b: Decadal Fossil Fuel Emissions and Decadal Warming: A Note (September 19, 2015). Available at SSRN: https://ssrn.com/abstract=2662870 or http://dx.doi.org/10.2139/ssrn.2662870
Quirk, T. 2009: Sources and sinks of CO2. Energy & Environment. Volume: 20 Issue: 1, pp. 105-121. https://journals.sagepub.com/doi/10.1260/095830509787689123
Quirk, T. and Asten, M. 2022: Atmospheric CO2 source analysis. Melbourne, Victoria, Australia. (Preprint to be submitted) https://edberry.com/blog/climate/climate-physics/preprint-atmospheric-co2-source-analysis/
Revelle, R., and Suess, H. 1957: CO2 exchange between atmosphere and ocean and the question of an increase of atmospheric CO2 during past decades. Tellus. 9: 18-27. https://onlinelibrary.wiley.com/doi/epdf/10.1111/j.2153-3490.1957.tb01849.x
Rorsch, A., Courtney, R.S., and Thoenes, D. 2005: The Interaction of Climate Change and the CO2 Cycle. Energy & Environment. Volume 16, No 2. https://journals.sagepub.com/doi/pdf/10.1260/0958305053749589
Salby, M.L. 2012: Physics of the Atmosphere and Climate. Cambridge University Press. 666 pp. https://www.amazon.com/Physics-Atmosphere-Climate-Murry-Salby/dp/0521767180/ref=mt_hardcover?_encoding=UTF8&me=.
Salby, M.L. 2013: CO2 follows the Integral of Temperature, video. http://edberry.com/blog/climate-physics/agw-hypothesis/murry-salby-CO2-follows-integral-of-temperature/.
Salby, M.L. and Harde, H. 2021: Control of Atmospheric CO2: Part I: Relation of Carbon 14 to the Removal of CO2. Science of Climate Change, 1, no.2. https://doi.org/10.53234/scc202112/210
Segalstad, T.V. 1998: Carbon cycle modelling and the residence time of natural and anthropogenic atmospheric CO2: on the construction of the Greenhouse Effect Global Warming dogma. In: Bate, R. (Ed.): Global warming: the continuing debate. ESEF, Cambridge, U.K. (ISBN 0952773422): 184-219. http://www.CO2web.info/ESEF3VO2.pdf
Siegenthaler, U. and Joos, F. 1992: Use of a simple model for studying oceanic tracer distributions and the global carbon cycle. Tellus, 44B, 186-207; https://onlinelibrary.wiley.com/doi/epdf/10.1034/j.1600-0889.1992.t01-2-00003.x
Skrable, K., and French, C.G. 2022: World atmospheric CO2, its 14C specific activity, anthropogenic-fossil component, non-fossil component, and emissions (1750 – 2018). Health Physics: February 2022 – Volume 122 – Issue 2 – p 291-305. doi: 10.1097/HP.0000000000001485. https://journals.lww.com/health-physics/Fulltext/2022/02000/World_Atmospheric_CO2,_Its_14C_Specific_Activity,.2.aspx
Starr, C. 1992: Atmospheric CO2 residence time and the carbon cycle. Science Direct, 18, 12, pp. 1297-1310; https://www.sciencedirect.com/science/article/abs/pii/0360544293900178
Strassmann, K.M., Joos, F. 2018: The Bern Simple Climate Model (BernSCM) v1.0: an extensible and fully documented open-source re-implementation of the Bern reduced-form model for global carbon cycle-climate simulations. Geosci. Model Dev, 11, 1887-1908. https://gmd.copernicus.org/articles/11/1887/2018/
Stuiver, M. and Polach, H. 1977: Discussion: Reporting of 14C data. Radiocarbon, 19(3), 355-363. extension://bfdogplmndidlpjfhoijckpakkdjkkil/pdf/viewer.html?file=http%3A%2F%2Fwww.imprs-gbgc.de%2Fuploads%2FRadiocarbonSchool%2FReading%2Fstuier_polach.pdf
Turnbull, J.C., Mikaloff Fletcher, S.E., Ansell, I., Brailsford, G.W., Moss, R.C., Norris, M.W., and Steinkamp, K. 2017: Sixty years of radiocarbon dioxide measurements at Wellington, New Zealand: 1954–2014. Atmos. Chem. Phys., 17, pp. 14771–14784. https://doi.org/10.5194/acp-17-14771-2017
Van Langenhove, A. 1986: Isotope effects: definitions and consequences for pharmacologic studies. J. Clinical Pharmacology. https://doi.org/10.1002/j.1552-4604.1986.tb03545.x
Added for discussion. Not in published paper.
I added this section on January 22, 2022
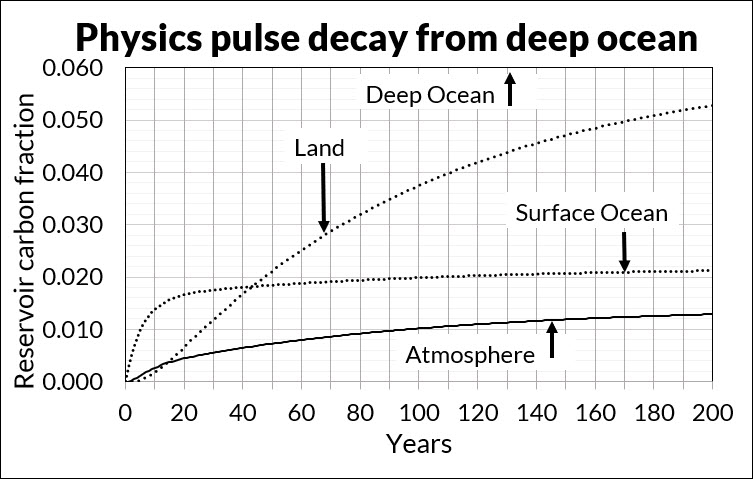
Figure 20 begins with all carbon in the deep ocean and shows how fast carbon moves from the deep ocean to the land, atmosphere, and surface ocean. The percentages move toward the natural carbon cycle equilibrium percentages shown in Figure 3 of 6.1%, 1.4%, 2.2%, and 90.3% for land, atmosphere, surface ocean, and deep ocean.
Figure 20 shows these percentages at 100 years are 3.8%, 1.0%, 2.0%, and 93.3%, and at 200 years are 5.3%, 1.3%, 2.1%, and 91.3%.
In summary, an increase in the deep ocean carbon will bring the atmosphere and surface ocean carbon almost to equilibrium in 100 years and the land carbon almost to equilibrium in 200 years.
For example, if nature adds, say 3%, to the deep ocean carbon, the flows out of the deep ocean as this new carbon moves to equilibrium will increase the other reservoirs by about 3% in 100 to 200 years.
Congratulations Ed Berry on the publishing of your landmark paper. It’s been a long campaign thus far, and it’s not over. Your paper will be attacked by the usual suspects. Here, in advance, is my response to them:
The ability to predict is the best objective measure of scientific and technical competence. I have one of the best (earliest and most accurate) predictive track records on climate and energy.
In contrast, climate doomsters have a perfect NEGATIVE predictive track record – every very-scary climate prediction, of the ~80 they have made since 1970, has FAILED TO HAPPEN.
“Rode and Fischbeck, professor of Social & Decision Sciences and Engineering & Public Policy, collected 79 predictions of climate-caused apocalypse going back to the first Earth Day in 1970. With the passage of time, many of these forecasts have since expired; the dates have come and gone uneventfully. In fact, 48 (61%) of the predictions have already expired as of the end of 2020.”
By the end of 2020, the climate doomsters were proved wrong in their scary climate predictions 48 times. At 50:50 odds for each prediction, that is like flipping a coin 48 times and losing every time! The probability of that being mere random stupidity is 1 in 281 trillion!
It’s not just global warming scientists being stupid – they have been 100% wrong about every scary climate prediction – so nobody should continue to believe them.
There is a powerful logic that says no rational person or group could be this wrong for this long – they have followed a corrupt agenda – in fact, they knew from the beginning of their catastrophic global warming narrative that they were lying.
The radical greens have NO credibility, make that NEGATIVE credibility – their core competence is propaganda, the fabrication of false alarm.
Excerpted from my latest paper:
“SCIENTIFIC COMPETENCE – THE ABILITY TO CORRECTLY PREDICT”
by Allan MacRae, B.A.Sc., M.Eng., October 20, 2021, Update Nov. 8, 2021
http://correctpredictions.ca/
Regards, Allan
“Yet not so long ago the news media issued dire warnings about global cooling and a coming Ice Age. Consider these headlines:
• “The Earth’s Cooling Climate,” Science News, November 15, 1969. • “Colder Winters Held Dawn of New Ice Age,” Washington Post, January 11, 1970. • “Science: Another Ice Age?” Time Magazine, June 24, 1974. • “The Ice Age Cometh!” Science News, March 1, 1975. • “The Cooling World,” Newsweek, April 28, 1975. • “Scientists Ask Why World Climate is Changing; Major Cooling May Be Ahead,” New York Times, May 21, 1975. • “In the Grip of a New Ice Age?” International Wildlife July-August, 1975. • “A Major Cooling Widely Considered to Be Inevitable,” New York Times, September 14, 1975. • “Variations in the Earth’s Orbit, Pacemaker of the Ice Ages,” Science magazine, December 10, 1976.
Reporters told the public about global cooling in the same confident tone used in today’s coverage about global warming, creating the strong impression that no reasonable person could disagree. Here are some examples:
“The evidence in support of these predictions [global cooling] has now begun to accumulate so massively that meteorologists are hard-pressed to keep up with it.” The Cooling World “A study release last month by two NOAA scientists that the amount of sunshine reaching the ground in the continental U.S. diminished by 1.3% between 1964 and 1972.” The Cooling World “Telltale signs are everywhere…the thickness of the pack ice…the southward migration of warmth-loving creatures like the armadillo…” Another Ice Age? “Since the 1940s the mean global temperature has dropped about 2.7 degrees.” Another Ice Age? “The threat of a new ice age must now stand alongside nuclear war as a likely source of wholesale death and misery for mankind,” The Ice Age Cometh!”
https://www.washingtonpolicy.org/publications/detail/today-its-global-warming-in-the-70s-it-was-the-coming-ice-age
Allan MacRae published on September 1, 2002, based on a conversation with Dr. Tim Patterson:
3. “If [as we believe] solar activity is the main driver of surface temperature rather than CO2, we should begin the next cooling period by 2020 to 2030.”
https://correctpredictions.ca/
This was compiled by ‘Yale Climate Connections’ that is a global warming site if there ever was one.
Major weather stations’ new all-time heat or cold records in January 2021
Among global stations with a record of at least 40 years, 34 set, not just tied, a new all-time cold record in January, and two stations set all-time heat records:
Vega de Liordes (Spain) min. -35.8°C, January 7: New national record low for Spain (unofficial, recorded in a sinkhole);
Huailai (China) min. -24.3°C, January 7;
Chengde (China) min. -27.2°C, January 7;
Xingtai (China) min. -17.1°C, January 7;
Zhangjiakou (China) min. -26.8°C, January 7;
Baoding (China) min. -22.0°C, January 7;
Datong (China) min. -31.1°C, January 7;
Mount Wutai (China) min. -32.8°C, January 7;
Naran Bulag (China) min. -39.2°C, January 7;
Jining (China) min. -30.0°C, January 7;
Chifeng (China) min. -29.5°C, January 7;
Shangdianzi (China) min. -26.5°C, January 7;
Tongzhou (China) min. -22.4°C, January 7;
Shunyi (China) min. -20.6°C, January 7;
Changping (China) min. -19.7°C, January 7;
Haenam (South Korea) min. -17.1°C, January 8;
Uljin (South Korea) min. -16.1°C, January 8;
Towada (Japan) min. -20.1°C, January 9;
Furue (Japan) min. -6.9°C, January 9;
Wakayanagi (Japan) min. -19.9°C, January 9;
Kawatabi (Japan) min. -14.3°C, January 9;
Komanoyu (Japan) min. -15.5°C, January 9;
Furukawa (Japan) min. -17.6°C, January 9;
Shiogama (Japan) min. -9.6°C, January 9;
Kamigori (Japan) min. -10.3°C, January 9;
Fukuwatari (Japan) min. -10.1°C, January 9;
Wake (Japan) min. -10.6°C, January 9;
Soeda (Japan) min. -7.5°C, January 9;
Yorii (Japan) min. -9.2°C, January 9;
Seosan (South Korea) min. -19.7°C, January 9;
Rakna (United Arab Emirates) min. -2.0°C, January 9: New national record low for the United Arab Emirates (for low-elevation places);
Ras Al Khaimah Airport (United Arab Emirates) min. 4.3°C, January 9;
Madrid Cuatro Vientos Airport (Spain) min. -13.0°C, January 12;
Madrid University (Spain) min. -11.0°C, January 12;
Maquinchao (Argentina) max. 38.9°C, January 22; and
Cipolletti (Argentina) max. 43.8°C, January 22.
One all-time national/territorial cold record set or tied in 2021
As of February 12, 2021, one nation or territory had set or tied an all-time national cold record:
United Arab Emirates (for places at low elevations): -2.0°C (28.4°F) at Rakna, January 9.
No all-time national/territorial heat records have been set thus far in 2021.
Ten monthly national/territorial heat records beaten or tied as of February 12
– January (10): Mexico, Bangladesh, Nigeria, Japan, Malta, Tunisia, Turkey, Russia, Georgia, Spain
No national/territorial monthly cold records in addition to the one all-time national record in the UAE mentioned above have been set thus far in 2021.
Hemispherical and continental temperature records in 2021
None.
https://yaleclimateconnections.org/2021/02/noaa-january-2021-was-ninth-warmest-on-record-in-the-u-s-seventh-warmest-globally/
This is the caption for the photo in the Yale report. “Spain lies blanketed in heavy snow on January 12, 2021, in the wake of Windstorm Filomena, Earth’s most expensive weather-related disaster of January, with $2.2 billion in damage to Madrid alone. (Image credit: Modified Sentinel-3 satellite data from Pierre Markuse) Why are all alarmist such bald faced liars?
50 years of failed apocalyptic predictions
https://dwahts.blogspot.com/2019/12/50-years-of-failed-apocalyptic.html?m=1&fbclid=IwAR2_z2sAKqohDmLg8cdMwRG9nWDUBTfBqZKtum8W-Xz44aIe8-Dv7IguO1U
Wrong Again: 50 Years of Failed Eco-pocalyptic Predictions
Myron Ebell • Steven J. Milloy • 09/18/2019
https://cei.org/blog/wrong-again-50-years-of-failed-eco-pocalyptic-predictions/?fbclid=IwAR1qX2j-AXZHbT4h3P2CTLdnj4C510PkpyvClkregTWxqGQq6mCgYm80pdc
It appears that the modern day Nostradamus, Dr. Neil Ferguson, has never encountered a potential pandemic that he could be close to 90% wrong about when he pulls his predictions out of thin air about what the outcome of such occurrences will be. His predictions almost put an end to the livestock business in the UK when he made such grossly wrong predictions back in 2001. I for sure agree with you about Fauci who for sure did not serve President Trump well.
Bird flu pandemic ‘could kill 150m’ Fri 30 Sep 2005
A highly pathogenic form of bird flu, known as the H5N1, has led to the culling of tens of millions of birds in south-east Asia, but efforts to contain it have not prevented it spreading as far as the Ural mountains in Russia.
Carried by wildfowl, it spreads quickly among poultry flocks and has killed people living or working in close proximity to infected birds. Scientists fear the virus could evolve into a form which could be passed from human to human with catastrophic consequences.
Last month Neil Ferguson, a professor of mathematical biology at Imperial College London, told Guardian Unlimited that up to 200 million people could be killed.
“Around 40 million people died in 1918 Spanish flu outbreak,” said Prof Ferguson. “There are six times more people on the planet now so you could scale it up to around 200 million people probably.”
A Department of Health contingency plan states anywhere that there could be between 21,500 and 709,000 deaths in Britain.
https://www.theguardian.com/world/2005/sep/30/birdflu.jamessturcke
British scientist Neil Ferguson ignited the world’s drastic response to the novel Wuhan coronavirus when he published the bombshell report predicting 2.2 million Americans and more than half a million Brits would be killed. After both the U.S. and U.K. governments effectively shut down their citizens and economies, Ferguson is walking back his doomsday scenarios.
https://gellerreport.com/2020/03/models-dont-match-reality-white-house-coronavirus-chief-rejects-doomsday-predictions.html/
17 March 2020 Professor Neil Ferguson, head of the MRC GIDA team and director of the Abdul Latif Jameel Institute for Disease and Emergency Analytics (J-IDEA), said: “The world is facing the most serious public health crisis in generations. Here we provide concrete estimates of the scale of the threat countries now face.
“We use the latest estimates of severity to show that policy strategies which aim to mitigate the epidemic might halve deaths and reduce peak healthcare demand by two-thirds, but that this will not be enough to prevent health systems being overwhelmed. More intensive, and socially disruptive interventions will therefore be required to suppress transmission to low levels. It is likely such measures – most notably, large scale social distancing – will need to be in place for many months, perhaps until a vaccine becomes available.”
https://www.imperial.ac.uk/news/196234/covid19-imperial-researchers-model-likely-impact/
Then 8 days later Professor Neil Ferguson said this below. He should have paid attention to what Yogi Berra observed; “It’s tough to make predictions, especially about the future.”
25 March 2020 He said that expected increases in National Health Service capacity and ongoing restrictions to people’s movements make him “reasonably confident” the health service can cope when the predicted peak of the epidemic arrives in two or three weeks. UK deaths from the disease are now unlikely to exceed 20,000, he said, and could be much lower.
https://www.newscientist.com/article/2238578-uk-has-enough-intensive-care-units-for-coronavirus-expert-predicts/
Neil Ferguson was still being listened to even after his predictions in 2001 were so far off about Mad cow disease.
Estimates of Future Human Death Toll From Mad Cow Disease Vary Widely
“Finally, genetics play a huge role that needs to be included in any modeling of variant C.J.D. projections. It is now assumed that all victims of the disease have the same genetic profile; their normal prion protein has two copies of the same amino acid, methionine, at a single point called codon 129. This so-called met-met trait is shared by 40 percent of the British population. But if this turns out to be false, Dr. Ferguson said, and the entire population is at risk, the worst case numbers would have to be multiplied by a factor of 2.5″.
”We won’t know which estimates are more likely until more cases are diagnosed,” Dr. Ferguson said.
https://www.nytimes.com/2001/10/30/health/estimates-of-future-human-death-toll-from-mad-cow-disease-vary-widely.html
The Earth is cooler with the albedo/atmosphere not warmer because at this distance from the Sun space is 394 K, 121 C, 250 F and NOT 5 K. Remove the atmos/GHGs and the Earth becomes much like the Moon. That’s NOT what the GreenHouseEffect theory says. See UCLA Diviner mission’s site, Nikolov “Airless celestial bodies,” Kramm (U of AK) “Moon as analog for Earth,” the Int’l Space Station HVAC refrigerant design criteria and the AC and chilled underwear of an astronaut’s space suit.
The K-T atmospheric energy balance diagram (TFK_bams09.pdf (ucar.edu)) and all of its clones contain a couple of egregious arithmetic and thermodynamic errors. The term 63 W/m^2 appears twice and the 396 upwelling Black Body calculation does not exist as actual energy.
1,368 W/m^2 arrives at the Earth. This discular value is divided by 4 to spread/average 342 over the entire spherical ToA 24/7. Dumb, btw. About 100 are reflected back into space by the 30% albedo and 80 are absorbed by the atmosphere (not possible) leaving 160 net/net making it to the surface.
According to the LoT 1 160 is ALL!!! that can leave. 160 in = 70 + 80 + 63 out. The incoming solar energy is balanced with and allocated to these three outputs. The balance is complete, there is no more!!!
Where does the 396 upwelling come from? It’s 54 more than the original from the Sun, 156 more than the net albedo and 236 more than the net/net 160 to the surface and 396 = 333 + a whole ‘nother second helping of 63! The 333 is a 100% efficient perpetual loop from cold to hot without adding work violating LoT 2.
The 396 is actually a theoretical, “What if?” S-B calculation for any surface at 16 C serving as the denominator of the emissivity ratio, i.e. 63/396 = 0.16. This is why IR instruments that assume 1.0 assume wrong.
This entire 396/333/63 GHG loop could be removed from the graphic and the balance would be unaffected!!
No GHE, no GHG warming, no man/CO2 driven climate change or global warming.
.
The most basic assumption made by the IPCC, that the Greenhouse Gas Effect is the major factor in removing excess heat (energy) from earth to outer space, is incorrect. For every pound of water that evaporates, 1,000 BTU’s of energy is extracted from the surroundings (latent heat of evaporation). When that water vapor condenses it expels that energy (latent heat of condensation) to outer space and the resulting condensate falls back to earth as rain. It acts as a thermostat because the warmer the temperature, the more evaporation and the more cloud cover reflecting more energy away from earth.
Please return my email. I don’t fine this process talked about in all my climate change studies.
The question remains why is the CO2 level in the atmosphere increasing if its not due to input of human emissions. Where is the CO2 coming from?
Dr. Ed’s paper and the three by Salby and Harde papers listed on the “Latest” tab on this page describe their answer to your question. Because natural emissions are on the order of 20 times human emissions and residence time in the atmosphere is short (less than 10 years) the growth is mostly natural. There are many emissions sources ie. oceans as they warm, decaying vegetation and volcanoes. These sources are largely unmeasured but knowing the net result from measures of atmospheric CO2 at sites like Mauna Loa and the human contribution the analyses mentioned above give reasonably accurate estimates of the mix and disprove the IPCC assumption that the increase is all due to human emissions.
Importantly, Salby and Harde 2 shows that increased CO2 comes from the tropics, not where man’s emissions are.
Oooops!
I put this on Roy Spencer’s site.
I think I’ve falsified Berry.
I’ll use ppm equivalent for convenience.
First to describe one year using Berry’s model and the IPCC model. Seasonal exchanges cancel out.
Berry
Atmospheric CO2 increases by 2ppm/year.
59% comes from human activity. That is 1.2ppmm.
41% transfers from Land and ocean to atmosphere. That is 0.8ppm.
Land and ocean show a net decrease of 0.8ppm/year.
IPCC
Human activity releases enough to raise atmospheric CO2 by 4ppm/year.
Atmospheric CO2 increases by 2ppm/year.
Land and ocean absorb 2ppm/year from atmosphere.
Land and ocean show a net increase increase of 2ppm/year.
Not the different predictions.
The Berry model predicts that the amount of carbon in the land and ocean will decrease.
The IPCC predicts that it will increase.
What is happening?
The pH of the ocean is decreasing as the ocean takes up more CO2 and buffering converts more carbon to bicarbonate and carbonate. This releases more H+. Ballentyne et al concur.
The Land is greening as vegetation stores more CO2 removed from the air.
Land and ocean are net absorbers of cO2 as predicted by the IPCC but not by Berry.
Berry is falsified.
Dear Entropic,
Thank you for your comment because I always like challenges.
However, you will have to do much better than your comment to have any impact on my paper. Your comment, as made above, is simply full of sweeping assumptions with no connection to data or physics.
You need to show the sources of your numbers and your calculations. And you need to point to the parts of my paper that you challenge. You have not shown that there is any error in my paper.
Have you even read my paper?
Are you sure you aren’t Stephen P Anderson? You sound very like him, right down to the uninformative debating style.
The IPCC model comes straight out of the literature. The numbers come from them.
The only significant assumptions for both models are that seasonal exchanges cancel out over the annual cycle, that except for human input the total circulating carbon remains constant and that the equilibrium distribution of carbon between land, ocean and atmosphere remains constant unless disturbed.
This is sufficient for our purposes since we are discussing the fast carbon cycle, not the slow cycle.
I have read your paper, courtesy of Willard and the Berry model is based on it.
The 59% human emissions and, and 41% natural emissions figures are yours. If they are wrong, then please indicate what they should be, how much you expect the land and ocean reservoirs change each year and in what direction.
Dear Entropic,
You say, “I have read your paper, courtesy of Willard and the Berry model is based on it.”
That won’t work because you don’t give a reference for Willard and the data you claim are mine are not my data.
So please get a copy of my paper and read what it says before you claim there is an error in my paper. Are you too cheap to spend $10?
Dr. BERRY,
From your preprint 3 you calculate the tau for ocean surface to deep ocean as being around 8 years, but this is not accounting for Revelle Factor.
The previous models, like those of the Bern group do account for it, and find a much longer tau.
What is your rationale for ignoring it?
Thanks.
Dear Nate,
As I explain in my paper, I use IPCC’s data for its natural carbon cycle. This data already includes the effects of the Revelle factor.
Also, as I explain in my paper, the Bern model is based on the assumption that human CO2 causes ALL the increase in atmospheric CO2. That is not a valid assumption. That is why the Bern model is wrong. This has nothing to do with the Revelle factor.
Entropic man appears to very hung up on what the extremely trace gas CO₂, that is only .038% of the Earth’s total atmosphere, is able to do as far as the Earth’s climate is concerned. Entropic man needs to face reality and come to understand that CO₂ has nothing to do with the Earth’s climate or if its temperature rises above what one would expect for a planet that is still recovering from a recent Little Ice Age.
There is no greenhouse effect caused by CO₂. The Earth is warmed by the Sun and kept warm due to the pressure of the gases in its atmosphere that is reflected in how much mercury that pressure will displace which amounts to the barometric pressure at various altitudes and that is directly reflected in the temperature range at that altitude. I know much about this relationship between altitude and temperature from having went over the 17,769 ft Tharong-La pass on the Annapurna circuit in Nepal and also on my hike to Everest Base camp in Nepal & also when on Kilimanjaro in Tanzania. Then we have alarmist maintaining that; “This research has improved our understanding of how much the world will eventually warm if the carbon dioxide in the atmosphere is maintained at double the level of pre-industrial times”. Plus this nonsense; “There is much greater certainty that, if left unchecked, global warming would be high enough to bring very severe impacts and risks worldwide”, when in fact there is no evidence that CO₂ has anything to do with the Earth’s temperature or its climate. I enjoy seeing what other fable that someone who is so illogical and gullible to believe that the trace gas, CO₂, that is only .03-.04% of the total atmosphere of the Earth has the unbelievable ability to now do to the planet since it became a tool of the unscrupulous people to use to try to control the citizens of the world. In today’s world, who controls the energy controls the world’s population.
Altitude Above Sea Level Temperature Barometer In. Hg. Abs. Atmospheric Pressure
500 feet 57⁰F 14⁰C 29.38 17.48 PSI
15,000 feet 6⁰F -14⁰C 16.89 8.29 PSI
http://meteorologytraining.tpub.com/14269/css/14269_75.htm
Greenhouse Effect is Invalidated
https://www.youtube.com/watch?v=WfuafZbpyII
Vacuum Implosion
https://www.youtube.com/watch?v=VS6IckF1CM0
In my day scientific debate took place in seminar rooms. It was the custom for one party to make their point and back it up with evidence. The second party reciprocated and they played evidence tennis until time ran out of one prevailed. So far I’ve given you a basic argument but got nothing back.
https://www.sciencepublishinggroup.com/journal/paperinfo?journalid=298&doi=10.11648/j.ijaos.20190301.13
Let’s start at the beginning.
The first two sentences in your 2019 abstract read:-O
“The United Nations Intergovernmental Panel on Climate Change (IPCC) agrees human CO2 is only 5 percent and natural CO2 is 95 percent of the CO2 inflow into the atmosphere. The ratio of human to natural CO2 in the atmosphere must equal the ratio of the inflows. ”
The first sentence is about right. The second sentence is nonsense.
First may I remind you of the difference between gross flow and net flow. In a year the land absorbs x Gt of carbon by photosynthesis and returns x Gt by respiration. The gross flow is the sum of the two flows. The net flow is zero. Similarly the oceans exchange considerable CO2 with the atmosphere in a year, but the net flow is zero.
In a year the net contribution of the natural sinks to increasing atmospheric CO2 is nothing. The only contribution to increasing CO2 is human emissions.
Now the third sentence:-
“Yet IPCC claims human CO2 has caused all the rise in atmospheric CO2 above 280 ppm, which is now 130 ppm or 32 percent of today’s atmospheric CO2. ”
Correct.
The total circulating carbon is located in three reservoirs. About half is in the atmosphere and the other half in the land and ocean. They are in equilibrium, so if you are 2xGt of carbon to the Atmosphere from an outside source such as fossil fuels, x remains in the Atmosphere and x transfers to the land and ocean over the next few years.
You can get the total emissions from records of total fossil fuel burn and cement manufacture. That figure is enough to increase total carbon in the atmosphere by twice the observed atmospheric 130ppm. Half of the emissions stay in the Atmosphere and the other half transfer to the land and ocean.
A cloud of dust blowing in the wind… from all of the hand waving.
Dear Entropic,
You wax poetic about how to conduct a scientific debate. Then you break all your own rules.
You have not read my paper. You have not referenced any part of the body of my paper. You are not even talking about my 2021 paper.
Your elaborations agree with much of my paper, but you assume my paper disagrees with your elaborations.
You are not debating my paper. You are debating your constructed strawman of my paper. I don’t have time for your nonsense.
If you want to debate any part of my paper, give section number and quote, or give equation number.
I will give you one more opportunity to make a intelligent comment. If you fail, I will block you from further comments.
EM says
“Similarly the oceans exchange considerable CO2 with the atmosphere in a year, but the net flow is zero.”
What mechanism causes this balance? What evidence do you present to make this striking statement?
Henry’s Law states that the ocean and atmosphere will be in equilibrium when they have the same partial presssure. Under those conditions diffusion will be equal in both directions and the net flow is zero. There are temperature corrections .
The IPCC record an increase in atmospheric CO2 of 135ppm since 1880. This will put ocean and atmosphere out. of equilibrium . You can infer that the system will move back towards equilibrium with more molecules diffusing into the ocean than out of it.
Look at Figure 1 in the paper. The IPCC data shows 80Pg uptake by the ocean and 77.7 leaving. The net uptake is 2.3Pg.
The same figure shows a total increase of 4Pg/year. If, as the paper’s title claims, 75% of the increase is natural, we should see a net outflow from the ocean, not a net uptake.
Dear Entropic,
As my paper shows using IPCC data, there is a natural equilibrium between all four reservoirs and the natural carbon cycle defines this equilibrium.
The IPCC data also show how fast the system will return to its equilibrium after any deviation from equilibrium. My model properly calculates the dynamics of IPCC’s carbon cycle data.
If you don’t follow my model, then you can draw incorrect conclusions. First, you must separate IPCC’s natural carbon cycle data from its human carbon cycle data. Second, you must recognize that IPCC’s natural carbon cycle is very close to equilibrium, so close that we can assume it IS at equilibrium.
We calculate the six e-times from the data at equilibrium.
Then, we use the same e-times to calculate the human carbon cycle, which is not at equilibrium so long as we keep pumping CO2 from the slow carbon cycle into the atmosphere. Now, one key to understanding what is happening is to realize we can (and should) calculate the natural and human carbon cycles independently.
So, look at my calculated human carbon cycle. It’s pretty obvious that this human carbon flows from the atmosphere to the land and ocean. But this calculation shows the limits of how much human carbon is in the atmosphere as of 2020. And this limit shows that natural carbon had to add to atmospheric CO2.
Where did this natural carbon come from? Skrable et al. (2022) and Quirk indicate most of this added natural carbon originated in the ocean and flowed to the atmosphere. The IPCC has no data for that because it assumes human carbon causes all the increase. So, you are not going to find that in IPCC’s Figure 6.1.
thank you for nice information, finally i found what I’m searching for.
visit our website: https://uhamka.ac.id/ , Journal UHAMKA
Dr. BERRY,
From your preprint 3 you calculate the tau for ocean surface to deep ocean as being around 8 years, but this is not accounting for Revelle Factor.
The previous models, like those of the Bern group do account for it, and find a much longer tau.
What is your rationale for ignoring it?
Thanks.
Dear Nate,
As I explain in my paper, I use IPCC’s data for its natural carbon cycle. This data already includes the effects of the Revelle factor.
Also, as I explain in my paper, the Bern model is based on the assumption that human CO2 causes ALL the increase in atmospheric CO2. That is not a valid assumption. That is why the Bern model is wrong. This has nothing to do with the Revelle factor.
Also, the bomb C14 decay curve does not look like your modeled pulse decay curve. Yours has too fast initial decay. The bomb curve has an etime of 16.5 y, and this does come close to your modeled 4 y. You cannot claim C12 should be 4x faster, without evidence.
Thanks.
Dear Nate,
There is no reason the delta C14 decay curve should look like my modelled pulse decay. Delta 14C is a function of the ratio of 14C/12C.
I don’t “claim” 12CO2 is 4x faster than 14CO2. I only use data. Data clearly show the e-time of 14CO2 is 10.0 years. The IPCC data says the e-time of 12CO2 is 3.5 years.
The only assumptions I make in my paper are (a) that IPCC’s natural carbon cycle is valid and (b) that IPCC’s assumption that e-time = level / outflow or my equation (2) is valid. Everything else is deduction.
Your deltaC14 shows your own excellent fit gives 16.5 y e time, as does everyone elses. This is not a match to the predicted 3.5 y.
Dear Nate,
The 3.5 years for 12CO2 comes from the data in IPCC’s Figure 6.1. Separately, the IPCC says this e-time is “about 4 years.” (Please see my paper for exact references and pages.)
In addition to this 12CO2 e-time, we can measure the 14CO2 e-time at 10.0 years.
The 16.5 years for delta 14C is the ratio of 14C / 12C. My main point about delta 14C is that it has returned to its equilibrium level of zero after 1970.
Dr. Berry, Im still confused by your graph legend, which clearly shows Te =16.5 y for D14C, not for the 14/12 ratio. The curve fit to the D14C data does indeed appear visually to have an e-time of 16.5 y. And this graph is shown elsewhere with a similar fit e-time.
Dear Nate,
My publication includes several updates to my Preprint #3. Among them is my improved description of my Figure 18 and its vertical axis. The new legend says:
Figure 18. δ14C data (Turnbull et al., 2017, black line), the physics model fit to δ14C (black dashed line), 14CR (blue sawtooth line), physics model curve fit to 14CR (black dashed line), and 12CO2 ppmv (red line).
If you can spring $10 to get a copy of my publication, you will find more valuable information.
Good Information
Regards, Unissula
I just submitted this that follows to Gavin A. Schmidt’s “Real Climate” site and I’m reasonably sure that it will never see the light of day on that site due to Jørgen Peder Steffensen not seeming to believe that carbon dioxide has much to do with the Earth’s climate or its temperature.
I hope that because Jørgen Peder Steffensen is an actual scientist who has spent a life time studying ice cores that would qualify him to have a voice on this subject on; “RealClimate is a commentary site on climate science by working climate scientists for the interested public and journalists”. It will be interesting to see if Gavin will ever chance letting the views of a real climate scientist appear on this site.
Jørgen Peder Steffensen has been appointed professor of ice core related research at the Centre for Ice and Climate at the Niels Bohr Institute at the University of Copenhagen. https://nbi.ku.dk/english/namely_names/2016/joergen-peder-steffensen-appointed-professor-of-glaciology/
“The gradual cooling appears to be caused by continental drift: Antarctica become isolated at the South Pole, the Himalayas were formed and the Isthmus of Panama appeared out of the sea (2 million years ago). With the current configuration of the continents the earth is apparently susceptible to climate effects through variations in the earth’s orbit around the sun (the so called Milankowich theory). Over the last 40 million years the CO2 level in the atmosphere has fallen from 1000-2000 ppmv to a minimum of 180 ppmv 20.000 years ago.
Not since the Perm period circa 250 million years ago has the CO2 level been so low.
[…]
One can conclude that man had nothing to do with the end of the ice age. CO2 and climate continued to change at the same rate until industrialisation. I could be worried that our CO2 emissions could very well go and have serious consequences; but one should not believe that nature will just remain at rest if we let it be: Ice ages and climate ripples are good examples that nature is neither environmentally neutral or politically correct.
https://nbi.ku.dk/english/sciencexplorer/earth_and_climate/golden_spike/video/spoergsmaal_svar1/
Whenever I post this You Tube for the anthropogenic climate change alarmist to view they seem to take exception to what Jørgen Peder Steffensen is maintaining about the Earth being 2.5⁰C warmer 4,000 years ago than what it is now. These are the same ones that have no problem with Michael Mann eliminating the well documented MWP with his hockey stick graph.
We Live in Cold Times
6,221 views
Apr 26, 2021
https://www.youtube.com/watch?v=WE0zHZPQJzA
Dr. Berry,
Your rate equations, 9 and 10 in your preprint 3 have no buffer (Revelle) factor in them.
Whereas the equivalent rate equations derived by Revelle and Seuss 65 y ago, DO have the buffer factor in them. As they showed, this factor dramatically decreases the sink-rate of atmospheric CO2 to the ocean, and thus increases the growth rate of atm CO2 due to fossil fuel burning, accounting for the rise that was observed.
https://onlinelibrary.wiley.com/doi/10.1111/j.2153-3490.1957.tb01849.x
See eqn 7
The significance explained here:
https://history.aip.org/climate/Revelle.htm
Similarly, in the 1970s and after, the papers from Bern have the equivalent rate equations, ALSO have the buffer factor in them.
https://onlinelibrary.wiley.com/doi/epdf/10.1111/j.2153-3490.1975.tb01671.x
See equation 1.
They explain: “If the atmospheric CO, content increases by x percent, the resulting relative increase of oceanic CO, (including carbonate) will in equilibrium only be x/chi percent. This buffer action of the sea water is taken into account by multiplying the excess CO, content n, by chi in the expression for the flux from the mixed layer to the atmosphere”
You are neglecting to include the buffer effect (Revelle Factor) in your rate-equations, without a clear rationale, and thus finding a much smaller growth rate atm CO2 due to fossil fuel burning.
I somewhat wonder what the point is that Nate is hoping to make with his comment when this is from his links.
“Present data on the total amount of CO2 in the atmosphere, on the rates and mechanisms of exchange, and on possible fluctuations in terrestrial and marine organic carbon, are inadequate for accurate measurement of future changes in atmospheric CO2”.
https://onlinelibrary.wiley.com/doi/10.1111/j.2153-3490.1957.tb01849.x
“Recent estimates of the residence time of a molecule of CO2 in the atmosphere, before entering the sea, range from 16 hours to the order of 1,000 years.”(6*)
https://history.aip.org/climate/Revelle.htm
“…estimation of the sensitivity of the CO, distribution between atmosphere and ocean to changes of the global surface temperature; an important point, for the discussion of climatic feedback mechanisms. We are well aware of remaining uncertainties and difficulties involved in modeling the natural CO, cycle. Nevertheless, we hope that this paper helps to solve some of its major problems”.
https://onlinelibrary.wiley.com/doi/epdf/10.1111/j.2153-3490.1975.tb01671.x
This information below appears to be more to the point and it is more consistent than what appears above from Nate’s information. This data shown below presents credence to the believe that CO₂ has nothing to do with how the Earth’s climate reacts or what its temperature does as far as rising more than what one would expect from a planet recovering from a Little Ice Age.
Based on natural carbon-14
Craig [1957] 7 +/- 3
Revelle & Suess [1957] 7
Arnold & Anderson [1957] 10
including living and dead biosphere
(Siegenthaler, 1989) 4-9
Craig [1958] 7 +/- 5
Bolin & Eriksson [1959] 5
Broecker [1963], recalc. by Broecker & Peng [1974] 8
Craig [1963] 5-15
Keeling [1973b] 7
Broecker [1974] 9.2
Oeschger et al. [1975] 6-9
Keeling [1979] 7.53
Peng et al. [1979] 7.6 (5.5-9.4)
Siegenthaler et al. [1980] 7.5
Lal & Suess [1983] 3-25
Siegenthaler [1983] 7.9-10.6
Kratz et al. [1983] 6.7
Based on Suess Effect
Ferguson [1958] 2 (1-8)
Bacastow & Keeling [1973] 6.3-7.0
https://www.co2web.info/ESEF3VO2.htm
Dr. Berry,
Shortly after Revelle and Seuss, this paper by Bolin and Erickson, clarified the situation with the ocean mixed layer and, as you can see included the the buffer effect in its rate equations. It predicted the CO2 rise, very close to what indeed occurred over the next 60 y, due to fossil fuel burning.
https://geosci.uchicago.edu/~archer/warming_papers/bolin.1958.carbon_uptake.pdf
Dear Nate,
Thank you for your very relevant comments. I will get back to you after I read your references.
Ed
Dear Nate,
I reviewed the three papers you provided as links in your comment. Here is my summary:
Revelle and Suess (1957)
Bolin and Eriksson (1959)
Oeschger et al. (1975)
All these papers did not have the bomb test data we have today. Today’s data, including IPCC (2013), significantly supersede their data.
None of these papers has a proper flow model with which to calculate how levels set flows and flows set levels.
Berry (2021) presents a proper carbon cycle model using the latest IPCC data. Berry’s model is simple and wins according to Occam’s Razor over the other papers, especially over Oeschger et al. (1975) which is a mathematical mess.
All three papers attempt to quantify the Revelle and Suess theory by curve-fitting the theory to inaccurate and superseded data. All these papers assume human CO2 causes all the CO2 increase. Therefore, all their conclusions use circular reasoning and are wrong.
Finally, Ballantyne et al. (2012) found “there is no empirical evidence” that the ability of the land and oceans to absorb atmospheric CO2 “has started to diminish on the global scale.” This means human CO2 has not changed the turnover time (e-time).
Therefore, there is no scientific basis to insert a Revelle factor into my equations. However, if there were such data, then my model is the best way to calculate its possible effect.
“None of these papers has a proper flow model with which to calculate how”
Uhh..not sure what you mean by ‘proper flow model’?
The papers certainly have proper rate equations that are similar to yours in many ways, except that yours does not include the buffer factor. This is a constraint on the system, that is a straightforward consequence of ocean chemistry.
Earlier you tried to say that “data already includes the effects of the Revelle factor.”
Now you are changing your tune to say that it doesnt matter.
You cannot simply leave out this fundamental constraint, without a rationale., which you have not provided.
These papers as you can see were checked against observations of the ocean chemistry and C14 penetration into the ocean. Knowledge of these properties has improved somewhat, but the fundamentals of the ocean chemistry has not changed.
“found ‘there is no empirical evidence” that the ability of the land and oceans to absorb atmospheric CO2 “has started to diminish on the global scale.'”
Red herring. The Revelle Factor has not changed, but it doesnt need to change to have its current bottleneck effect on ocean carbon uptake.
Dear Nate,
We can go back to “Principles of Systems” by MIT professor Jay Forrester or to any modern systems engineering textbook to learn what is a proper systems model. We can find similar logic in Markov Chains. Proper systems models are composed of levels and flows. The levels set the flows, then these flows set new levels. You will observe that my paper follows these rules.
Oeschger et al. (1975) does not follow these rules.
There is nothing wrong with the Revelle factor in principle, but it needs experimental quantification to verify the magnitude of its effect on the carbon cycle. The Oeschger et al. (1975) quantification of the Revelle factor is not valid because they assumed human CO2 causes all the CO2 increase and set the Revelle factor accordingly.
Therefore, this quantification of the Revelle factor based on this incorrect assumption cannot be used as support for the assumption.
Oeschger et al. (1975) data is out of date, and it is superseded by Ballantine et al. that finds there is no observable Revelle effect.
IPCC’s Figure 6.1 data makes no reference to the Revelle factor. So, the Revelle effect is therefore included in IPCC’s data.
You are welcome to explain and formulate the Revelle factor in a manner that will fit into my model. You will need to show the experimental basis of the coefficients you insert into the Revelle factor. And you will need to show that Ballantine et al. and the IPCC are wrong.
Also, you must consider that human carbon has increased IPCC’s surface ocean carbon content by only 4.3% as of 2020. How much can the Revelle effect add with this small increase?
I will welcome such information if you can provide it. But mere reference to old papers that made bad assumptions and formulated irrational models has no impact on my paper. The ball is in your court.
Dr. Ed,
If the Revelle effect is included in the rate equations, as Bolin and Erickson did, and many others after, then we are able to accurately predict, in 1959, the rise of CO2 (25% by 2000) due to fossil fuel burning, that actually did occur (and 50% by now) .
If it is not included then you find that the rise by today is only 4.3% due to fossil fuel burning.
Given how consequential it is, it is surprising to to me how cavalier you are about this ocean buffering effect. You seem unsure, and in fact oscillate back and forth, on whether it is already included or not , whether it needs to be included or not, whether it is important or not.
“IPCC’s Figure 6.1 data makes no reference to the Revelle factor. So, the Revelle effect is therefore included in IPCC’s data.”
So now we’re back to it is already included. That is not at all an obvious conclusion.
“Proper systems models are composed of levels and flows. The levels set the flows, then these flows set new levels. You will observe that my paper follows these rules.”
Its fine if you want to use a systems approach to arrive at the rate equations like those found in the other papers. But a correct systems model MUST include the real-world constraints on the system. The ocean’s buffering effect is one of those.
“There is nothing wrong with the Revelle factor in principle, but it needs experimental quantification to verify the magnitude of its effect on the carbon cycle. Oeschger et al. (1975) quantification of the Revelle factor is not valid because they assumed human CO2 causes all the CO2 increase and set the Revelle factor accordingly. Therefore, this quantification of the Revelle factor based on this incorrect assumption cannot be used as support for the assumption.”
Lots of work has been done to measure and verify Revelle factor, independent of Oescher in the last 60 y. There are no ‘incorrect assumptions’ in such measurements.
Are you aware of new data data that finds the value of the Revelle factor has been wrong all this time?
Are you aware of new data that fundamentally changes our understanding of the ocean carbon chemistry?
“All these papers assume human CO2 causes all the CO2 increase. Therefore, all their conclusions use circular reasoning and are wrong.”
I don’t see where they have done that. Bolin and Erickson didnt know what the increase would be, but they predicted it nonetheless!
You are proposing that Revelle factor can be left out of rate equations, but all previous, successful models included it.
Thus far, you have been unable to offer a sound scientific reason to remove it.
“Also, you must consider that human carbon has increased IPCC’s surface ocean carbon content by only 4.3% as of 2020. How much can the Revelle effect add with this small increase?”
I see that I misread that. Your atm rise due to human inputs is not that.
But this small rise of 4.3% is consistent with the expected effect of the Revelle Factor.
The quote was ” “If the atmospheric CO, content increases by x percent, the resulting relative increase of oceanic CO, (including carbonate) will in equilibrium only be x/chi percent. This buffer action of the sea water is taken into account by multiplying the excess CO, content n, by chi in the expression for the flux from the mixed layer to the atmosphere”
So if the average Revelle Factor is ~ 10, a 50% rise in atm CO2 should give a ~ 5% rise in surface ocean carbon content. So this makes sense.
If the surface ocean percent rise is only 1/10 of the atmospheres percentage rise, then the rate of flow of carbon from the surface to the deep ocean should be similarly reduced. Yes?
This is one way to understand the bottleneck effect of the Revelle factor.
Dr.Ed
“As my paper shows using IPCC data, there is a natural equilibrium between all four reservoirs and the natural carbon cycle defines this equilibrium.”
Equilibrium means that although there is considerable diffusion in all directions between reservoirs the net flow s cancel out to zero. Pre-industrial the amount of carbon in each reservoir remained constant from year to year and the total carbon in all reservoirs remained constant.
When we started burning fossil fuels the CO2 released into the atmosphere was in addition to the existing natural total. The total release was approximately 270 ppm equivalent.
This did not remain separate. It mixed into the atmosphere. The extra CO2 upset the pre-industrial equilibrium.
Pre-industrial the total circulating carbon was distributed approximately 25% biosphere, 25% ocean and 50% atmosphere. If the total carbon was 4x units you would find x in the biosphere, x in the surface ocean and 2x in the atmosphere. This was the minimum energy, maximum entropy state, the ground state to which diffusion tends to return.
The carbon added by fossil fuel burning should cause carbon to redistribute in the same proportions. Note that because the new carbon and the natural carbon are fully mixed you do not see packets of new carbon moving about separately. What you see is changes in the total in each reservoir. Thus the 270 ppm equivalent added since 1880 will eventually force a new equilibrium at x+67 for the biosphere, x+67 for the ocean and x+135 for the atmosphere.
Note that all the increase in atmospheric CO2 is due to human emissions, though no more than half the emitted CO2 remains in the atmosphere.
Dear Entropic,
We agree with your paragraphs above until we get to this sentence:
“This did not remain separate. It mixed into the atmosphere. The extra CO2 upset the pre-industrial equilibrium.”
Yes, the human and natural CO2 mixed together and did not remain separate BUT they did not react and according to the IPCC, both follow my equation (2) that says outflow = Level / e-time. Since they are not reactive, they follow Dalton’s Law of Partial Pressures, meaning they flow independently through the carbon cycle and we can calculate their effects on the carbon cycle independently.
Therefore, human CO2 did not “upset the pre-industrial equilibrium.” That statement has no scientific basis.
Next, you write:
“Pre-industrial the total circulating carbon was distributed approximately 25% biosphere, 25% ocean and 50% atmosphere.”
IPCC’s data show the percent of natural carbon at equilibrium in land, atmosphere, surface ocean, and deep ocean is 6%, 1.4%, 2.2%, and 90%, respectively, which is a long way from your numbers.
Nothing in your comment supports your conclusion that human CO2 caused all the CO2 increase.
Once mixed all CO2 molecules are interchangeable. They don’t remember their origin and they don’t follow separate paths. The only way you can follow the effect of CO2 added from outside is by its effect on the overall balance of the system. From the way the atmosphere CO2 changes over time you can infer what is going on.
We are releasing 5.5Gt/year into the atmosphere.
If we see atmosphere CO2 going down, then the net loss is greater than our emissions as some natural process is removing CO2 from the air faster than we are adding it.
If the atmosphere CO2 is increasing faster than 5.5Gt/year then the net increase is because some natural process is adding CO2 to the atmosphere on top of our emissions.
If atmosphere CO2 is increasing by less than our emissions then there is a net loss from the atmosphere smaller than our emissions.
If the measured carbon cycle showed the second case your hypothesis would be confirmed.
We see an increase of 3.3 Gt, less than the 5.5Gt human emissions. That is the third case. Your hypothesis is falsified.
Dr Ed
” you write:
“Pre-industrial the total circulating carbon was distributed approximately 25% biosphere, 25% ocean and 50% atmosphere.”
IPCC’s data show the percent of natural carbon at equilibrium in land, atmosphere, surface ocean, and deep ocean is 6%, 1.4%, 2.2%, and 90%, respectively, which is a long way from your numbers.
You are not comparing like with like. You quote total carbon, including carbon not available for exchange.
Thus much of the biosphere carbon is stored as wood and peat. Much of the ocean carbon is stored as bicarbonate, carbonate and in the deep ocean. None of it will cross from one reservoir to another in the short e-times of the fast carbon cycle.
To better estimate the scale of the fast carbon cycle looks at your Future 1.
The natural biosphere takes up 1 08 Gt from the atmosphere and returns 108Gt. The ocean takes up 80 Gt and returns 80Gt. The total actually moving between reservoirs is 108+108+80+80 = 376 Gt.
Of that 376 Gt, at any time, 108 is in the biosphere, 212 Gt is in the atmosphere and 80 is in the ocean. That is much closer to my 25%,50%,25%.
When you add 9Gt of fossil fuel CO2 to the atmosphere it creates a partial pressure gradient pushing CO2 out of the atmosphere. The amounts going to each reservoir reflect the existing flow pattern. You can project how the fossil fuel CO2 partitions.
9*108/376 = 2.6Gt to the biosphere.
9*80/376 = 1.9 Gt to the ocean.
9*188/376 = 4.5 Gt stays in the atmosphere.
Compare this to the measured data; 2.8Gt to the biosphere, 2.2 Gt to the ocean, and 4.0 Gt staying in the atmosphere.
Dear Entropic,
Thank you for your comment. I just noticed and corrected a typo in my comment that you also quoted. For the percent in the atmosphere, my comments said 1/4%. This was supposed to be 1.4%. I fixed this in my comment and in yours.
However, IPCC’s fast carbon cycle at equilibrium has these percentages of carbon in the reservoirs: 6%, 1.4%, 2.2%, and 90%. So, I am not including any of the slow carbon cycle.
IPCC’s flows between the reservoirs for natural carbon at equilibrium, shown in my Figure 2, are 108, 60.4, and 102 PgC per year. You are referring to these flow numbers.
It is not proper to add together the flows between the reservoirs, as you have done. The only way to calculate how human carbon flows from the atmosphere to the other 3 reservoirs is to calculate the flows as I do in my paper. My Figures 12, 13, and 14 show the results of my calculations.
Figure 12 is for 2010, shows the percent of human carbon in each reservoir is 38%, 16%, 9%, and 37% for land, atmosphere, surface ocean, and deep ocean. These percentages are almost the same for 2020, as my Figure 13 shows.
The 16% in the atmosphere is 57.6 PgC in 2010 and 70.7 PgC in 2020. These values are greater than the values you calculate, since GtC equals PgC.
“IPCC’s data show the percent of natural carbon at equilibrium in land, atmosphere, surface ocean, and deep ocean is 6%, 1.4%, 2.2%, and 90%”
In equilibrium yes, but it takes several hundred years or more for the deep ocean to equilibrate with the surface ocean. This is well established, with study of the penetration of isotopes into the ocean. The reason is the Revelle Factor, which cannot be ignored.
The surface ocean–the mixed layer is only ~ 2%, comparable to the atmosphere. And I agree with Entropic that much of the land biosphere is slow to respond, the forrests, the peatland, etc.
Dear Nate,
There are a lot of claims about how fast carbon flows to other reservoirs. But the only way to check those rumors is to do calculations like my physics model does using IPCC’s data.
My Figure 16 shows how fast a pulse of carbon in the atmosphere flows to the other reservoirs. It is mostly done in 20 years. So, I don’t accept any of the claims of “well established” that it takes several hundred years to approach equilibrium in IPCC’s carbon cycle.
What would you say if I ran a similar calculation but starting with all the carbon in the deep ocean?
I have not done this, but my bet is that the flow from the deep ocean would fill the land and atmosphere reservoirs up to half of their equilibrium values in less than 50 years. What would you bet?
You claim, “The Revelle Factor cannot be ignored.” But you have not shown Ballantyne et al. (2012) – that says there is no evidence of a Revelle effect in the data – is wrong.
The information you provided on the Revelle factor is missing necessary data. For example, what carbon amount in the ocean is the zero point? The factor of 10 is neat but where does it begin? What is the Revelle factor for IPCC’s 1750 natural equilibrium levels? At what carbon levels did the Revelle factor “kick in”?
And most important, Where is the data that Ballantyne et al. could not find?
Your statement “that much of the land biosphere is slow to respond, the forests, the peatland, etc.” is not quantitative enough to have any meaning.
I use IPCC (2013) data. Does your statement use IPCC (2013) data?
If not, then we are not talking about the same thing.
Dear Nate,
I followed up on my comment above where I wrote,
I put the result of this calculation at the bottom of my post above. My bet was close to correct. The atmosphere increased faster and the land slower than I guessed.
You wrote,
IPCC data show the surface ocean and deep ocean are closely connected.
Ed.
“But the only way to check those rumors is to do calculations like my physics model does using IPCC’s data.”
A model is not an experiment, not data, not an observation. Only those can test a hypothesis.
“My Figure 16 shows how fast a pulse of carbon in the atmosphere flows to the other reservoirs. It is mostly done in 20 years.”
No it doesn’t! It only shows what your model produces.
“So, I don’t accept any of the claims of “well established” that it takes several hundred years to approach equilibrium in IPCC’s carbon cycle.”
So you have more faith in a model than in observations? That is back-assward!
” But you have not shown Ballantyne et al. (2012) – that says there is no evidence of a Revelle effect in the data – is wrong.”
Can you point to where it is stated in his paper that ‘there is no evidence of a Revelle effect in the data’ ?
You previously stated” Ballantyne et al. (2012) found ‘there is no empirical evidence’ that the ability of the land and oceans to absorb atmospheric CO2 ‘has started to diminish on the global scale.'”
I think you are mixing up absorption rate with CHANGE-IN absorption rate.
The Revelle Factor’ already significantly limited the ability of the ocean to absorb CO2 in 1959.
The fraction of added CO2 that gets removed by the ocean has hardly changed since then.
The predicted change in Revelle Factor over time, related to change in the ocean’s pH, is an entirely different issue.
For someone trying to overturn the Carbon-cycle paradigm, I am surprised that you are not more aware of the main features of the current paradigm.
From Ballantyne 2012:
“Although approximately one-half of total CO2 emissions is at present taken up by combined land and ocean carbon reservoirs2, models predict a decline in future carbon uptake by these reservoirs, resulting in a positive carbon–climate feedback3. Several recent studies suggest that rates of carbon uptake by the land4,5,6 and ocean7,8,9,10 have remained constant or declined in recent decades. Other work, however, has called into question the reported decline11,12,13. Here we use global-scale atmospheric CO2 measurements, CO2 emission inventories and their full range of uncertainties to calculate changes in global CO2 sources and sinks during the past 50 years. Our mass balance analysis shows that net global carbon uptake has increased significantly by about 0.05 billion tonnes of carbon per year and that global carbon uptake doubled, from 2.4 ± 0.8 to 5.0 ± 0.9 billion tonnes per year, between 1960 and 2010. Therefore, it is very unlikely that both land and ocean carbon sinks have decreased on a global scale. Since 1959, approximately 350 billion tonnes of carbon have been emitted by humans to the atmosphere, of which about 55 per cent has moved into the land and oceans. ”
Note the last sentence. I just dont see how this paper is supportive of your hypothesis, Ed.
Dear Nate,
First, please tell me your educational background and experience. There is obviously a disconnect between your comments and physics and engineering.
First, you do not understand that my physics model is entirely different than, say, climate models. My physics model simply calculates how human emissions change the carbon cycle based upon IPCC’s own data. It is 2+2=4 stuff. It states its hypothesis and the data it uses. Then it simply computes the deductive result of its hypothesis and data.
Will Happer, among others, checked my model, its math, its derivations, and its calculations, and he found my calculations matched his to the second decimal place.
So, your claim that my model is not trustworthy shows you are incompetent in this area.
If you can’t figure this part out, then we have nothing to discuss because you are missing several years of education in theoretical physics.
Second, you ask, “Can you point to where it is stated in his paper that ‘there is no evidence of a Revelle effect in the data’?
The answer is in your quote of his last two sentences:
(1) Therefore, it is very unlikely that both land and ocean carbon sinks have decreased on a global scale.
(2) Since 1959, approximately 350 billion tonnes of carbon have been emitted by humans to the atmosphere, of which about 55 per cent has moved into the land and oceans.
Sentence (1) shows there is no observable evidence of the Revelle effect. Maybe you do not understand that the Revelle effect, if it were relevant, would decrease the “ocean carbon sinks.”
Sentence (2) merely affirms that Ballentyne, like those before him, incorrectly assumed human CO2 caused all the CO2 increase.
Third, Sentence (2) has no bearing on the significance of the Revelle factor.
You claim without evidence, “The Revelle Factor’ already significantly limited the ability of the ocean to absorb CO2 in 1959.” Sorry, you have not supported your claim.
“(1) Therefore, it is very unlikely that both land and ocean carbon sinks have decreased on a global scale.
(2) Since 1959, approximately 350 billion tonnes of carbon have been emitted by humans to the atmosphere, of which about 55 per cent has moved into the land and oceans.
Sentence (1) shows there is no observable evidence of the Revelle effect.
Maybe you do not understand that the Revelle effect, if it were relevant, would decrease the “ocean carbon sinks.”
No! You have a very basic misunderstanding here. You are confusing acceleration and velocity. I am also a PhD physicist, so that is not the issue.
“ocean carbon sinks.” The ‘ocean sinks’ here means the annual flow rate of carbon into the ocean, ie the VELOCITY. Then ‘decrease the ocean carbon sinks’ clearly is an ACCELERATION.
The very first sentence makes it clear:
“Although approximately one-half of total CO2 emissions is at present taken up by combined land and ocean carbon reservoirs, models predict a decline in future carbon uptake by these reservoirs, resulting in a positive carbon–climate feedback”
that the authors agree that the ocean, right NOW, is unable to absorb most of the emissions, Land and ocean absorb only one half! They do not agree with you! They understand that the Revelle Factor is causing that right now.
As they clearly state, the paper is addressing the ‘climate feedback’ onto the carbon sinking ability.
But please do read the paper and quote its discussion of the Revelle Factor.
“Sentence (2) merely affirms that Ballentyne, like those before him, incorrectly assumed human CO2 caused all the CO2 increase.”
You assume he is assuming. This is applying an ideological filter.
As opposed to the more likely alternative, that he is a carbon cycle expert who has a thorough understanding of all the observations and evidence that has built the current the carbon cycle paradigm.
That is why your claim that this paper is somehow overturning the paradigm by showing ‘ there is no observable evidence of the Revelle effect’ makes absolutely no sense.
Dr. Ed
I used this analogy at Dr. Spencr’s to illustrate how you can attribute an increase to additional particles without keeping the added particles separate and without knowing where each particles went.
“An analogy. My grandson has a piggy bank. At the beginning of the year it contains 1000 pennies.
Each day his father adds 100 pennies and Granny adds one penny.
Each day the child removes and spends 100 pennies.
At the end of the year the piggy bank contains 1365 pennies.
Clearly the 365 penny increase in the total is due to Granny’s pennies,but very few of them will remain in the piggy bank.
Over the year 36500+365=36865 pennies were added and 36500 removed. Most of Granny’s pennies were spent.”
Dear Entropic,
I assume your inflow and outflow of 100 pennies per day represents the natural carbon cycle at equilibrium. I also assume your addition of one penny per day irepresents the addition of human carbon to the atmosphere. So far, so good.
Your analogy breaks down in two ways. First, you should simply treat the human carbon cycle separately. That way, we can omit all considerations of the natural carbon cycle and focus on the human daily pennies.
Second, you must use the same “physics” for the human carbon cycle that you use for the natural carbon cycle. This means you must use the same e-time for the outflow of the “human” pennies as you use for the “natural” pennies.
This e-time is found in your “natural carbon cycle” data:
e-time = Level / Outflow = 1000 / 100 = 10 days
So, your analogy must allow the (human) pennies to flow out of the atmosphere daily with an e-time of 10 days. Without having to do this calculation (because we can both do it), we can quickly realize that at the end of the year there will not be 365 (human) pennies left in the piggy bank.
My calculation does that for the human carbon cycle and finds the human carbon cycle cannot explain the measured increase in atmospheric CO2.
“Your analogy breaks down in two ways. First, you should simply treat the human carbon cycle separately. That way, we can omit all considerations of the natural carbon cycle and focus on the human daily pennies.
You can’t isolate them. As I said earlier all CO2 molecules and all pennies are identical. A penny in the piggy bank does not know whether it was there already, added by father or added by Granny. They all behave the same and have the same probability of being spent. There is certainly no process by which Granny’s pennies will be chosen to stay in the piggy bank and become the annual increase. You can calculate how many extra pennies you will get, but you can’t say which pennies they will be.
“Second, you must use the same “physics” for the human carbon cycle that you use for the natural carbon cycle. This means you must use the same e-time for the outflow of the “human” pennies as you use for the “natural” pennies.”
Yes, you can’t treat them separately and can’t follow them through the system separately, though as I said above, you can infer some information about the system from the way the reservoir contents change.
I was thinking about another problem. Under stable conditions the various reservoirs settle into balance.
That is the minimum energy, maximum entropy state of the system. Adding human emissions has changed the balance, creating net flows out of the atmosphere.
Your hypothesis that most of the increased CO2 in the atmosphere is coming from the ocean requires CO2 to flow against the energy and the entropy gradient. Have you checked that your model is 2LOT compliant?
Dear Entropic,
Since you cannot understand why we can and should calculate human and natural carbon cycles separately, we have no more to discuss on this subject. We will simply agree to disagree.
I have showed you why your analogy is wrong because it does not treat human and natural coins the same. It lets natural coins flow out of the piggy bank while it stops human coins from flowing out of the piggy bank. That, as it turns out, is exactly the error that the IPCC and all climate alarmists make. Your analogy, after I interpret it for you, shows why the IPCC is wrong.
Also, even your own analogy proves you can calculate what happens to the natural coins and human coins separately, because we get the same result as when we calculate them together. But you miss this point.
Of course, maybe your problem is that you have not read my paper or my book, Climate Miracle.
Your inability to understand this shows you do not understand Dalton’s Law of Partial Pressures, my equation (2), or the superposition principle.
The art of theoretical physics is to know how to make things simple. That is what I do and not everyone can follow me. I get that. But those who cannot make physics simple will aways be left behind.
Yes, I did include entropy in some of my calculations, but I did not put these in my paper. My calculations of carbon flows after a pulse show the carbon moves through the system according to the principle of least action, which is the fastest way to increase the entropy of the system.
Thank you for your comments.
“I have showed you why your analogy is wrong because it does not treat human and natural coins the same. It lets natural coins flow out of the piggy bank while it stops human coins from flowing out of the piggy bank. ”
No!
Whether the penny is there already, is put there by father or is put there by Granny makes no difference.
All have the same probability of leaving the piggy bank.
Similarly for CO2 molecules in the atmosphere. Wherever their origin they have an equal probability of transferring to another reservoir. Your insistence that once they are in the system natural and human CO2 molecules behave differently and can be treated differently is false. It distorts your model and means that all your model output is wrong.
“Your insistence that once they are in the system natural and human CO2 molecules behave differently”
That’s a straw man, Entropic. Dr Berry is not saying the natural and human CO2 molecules behave differently, at all. In fact, he is arguing the complete opposite.
Adding to Entropic’s correct comments: Atmospheric CO2 molecules of anthropogenic and natural origins compete equally for absorption by non-atmospheric reservoirs. Take the ocean, for example. A given spot is available for absorption of one CO2 molecule. An anthropogenic CO2 molecule arriving at that spot has an equal chance of being absorbed, as a natural CO2 molecule arriving at that spot. The ocean spot does not refuse to absorb a natural CO2 molecule because it is waiting for an anthropogenic one to arrive, nor vice versa. The spot absorbs whatever molecule arrives first.
There are more natural than anthropogenic CO2 molecules in the atmosphere, so more natural CO2 molecules arrive at that spot. So the probability of a natural molecule being absorbed is higher than the probability of an anthropogenic molecule being absorbed, by dint of the sheer higher probability of a natural molecule being there. Consequently, over time more natural than anthropogenic molecules are absorbed, but that has nothing to do with any preference by the ocean.
Dear Tom,
If you are trying to prove that human and natural CO2 cannot be considered to act separately, you lose.
In a well-mixed atmosphere (which we and all research papers assume) all CO2 molecules in the atmosphere, human or natural in origin, have the same probability to flow out of the atmosphere at any given time.
Your focus on the receiving reservoir rather than on the sending reservoir causes you to get the physics (and probabilities) wrong.
Ed wrote “In a well-mixed atmosphere (which we and all research papers assume) all CO2 molecules in the atmosphere, human or natural in origin, have the same probability to flow out of the atmosphere at any given time.”
That phrasing is too ambiguous, and so is either true or false depending on how the reader interprets its unstated assumptions. It must be disambiguated into:
1. The probability of a natural origin CO2 molecule arriving at a sink, is higher than the probability of an anthropogenic molecule, simply because there are more natural than anthropogenic molecules in the atmosphere.
2. All CO2 molecules, human or natural in origin, have the same probability of flowing out of the atmosphere *** when given the opportunity by arriving at a sink ***.
3. Therefore the *combined* probability of any given CO2 molecule in the atmosphere first arriving at a sink and then being absorbed by that sink, is higher for natural than anthropogenic CO2 molecules.
“If you are trying to prove that human and natural CO2 cannot be considered to act separately, you lose.”
“In a well-mixed atmosphere (which we and all research papers assume) all CO2 molecules in the atmosphere, human or natural in origin, have the same probability to flow out of the atmosphere at any given time.”
Can you not see? These two statements are directly contradictory.
Your first statement says that natural and human CO2 can be considered to act separately.says
Your second statement says they cannot.
Dear Tom,
Thank you for clarifying. Yes, I agree with your three statements.
Our difference is that I claim your (1) and (3) paragraphs are irrelevant and that only (2) is relevant to the problem at hand.
In my view the probabilities of human and natural CO2 in (2) relate to their e-times, which are identical.
Dear Entropic,
I disagree. My statement:
“In a well-mixed atmosphere (which we and all research papers assume) all CO2 molecules in the atmosphere, human or natural in origin, have the same probability to flow out of the atmosphere at any given time.”
… does not in any way say that human and natural carbon flows cannot be calculated separately.
“… does not in any way say that human and natural carbon flows cannot be calculated separately.”
Calculated, yes. Measured, no.
Once mixed you can’t distinguish them.
If human emissions add 9Gt and Pinatubo adds 5 Gt in the same year you can calculate how each of them will change the balance, but you can only measure their joint effect.
You cannot take a sample from the atmosphere or the ocean and say “That molecule came from Pittsburg, that one came Pinatubo, that one was here already. “
It doesn’t matter how beautiful your theory is, it doesn’t matter how smart you are. If it doesn’t agree with experiment, it’s wrong.
Richard P. Feynman
If it comes down to a conflict between your model and the data, the default position is that your model is wrong.
To convince anyone outside your choir that the data is wrong you need to show measurements not calculations.
Dear Entropic,
You can claim as much as you want to that we must calculate human and natural CO2 flows in combination, but claims prove nothing.
By contrast, my Section 4.2 proves we can calculate these components separately. My Section 4.4 proves the calculation is analogous circuit theory, which proves we can calculate these components separately.
If you want to back up your claims, then you must show where there is an error in my paper.
Finally, your own analogy proves we can calculate the flows of natural coins and human coins separately, because, when we add up the separate calculations, we get the same result as when we calculate them together.
Dear Ed,
I learned the hard way that your blog is infested with ‘tag teams’ of anonymous, gaslighting trolls who try to slither away when shown to be wrong and who get abusive when asked to apologise for smears and falsehoods.
I first came across the despicable ‘Entropic Man’ on ‘Tallbloke’s Talkshop’ ( https://tallbloke.wordpress.com/ ). Entropic Man specialises in making up stuff then complaining he is being assailed by “wordy diatribe” when clear refutation of his tripe is provided.
Tallbloke says of ‘Entropic Man’
“Richard,
don’t worry, entropic is one of those retired science teachers who :-
1) Thinks he’s clever at bamboozling curious students who ask awkward questions
2) Is way out of his depth with anything which wasn’t spoon fed to him in a syllabus.”
see https://tallbloke.wordpress.com/2012/10/19/richard-courtney-empirical-assessment-of-the-warming-effect-of-co2/#comment-33846
If that is so then I sympathise with any students he had because logic and reason are way beyond the capabilities of the pathetic individual who posts as “Entropic Man’.
I suffered from trying to respond to that creature with reason and respect.
I do not know about ‘Nate’ but he seems to be similar to ‘Entropic Man’ in that he seeks a feeling of self-worth by making meaningless attacks of the works of those whom he perceives as being more capable than himself. Again, rationality is not his strength as is demonstrated by his comments to you.
As for Tom Dayton, he seems to be using a name instead of hiding behind a pseudonym. I could be wrong about that because he makes ridiculous assertions. For example, Dayton claims atmospheric CO2 molecules behave differently in the air if they were emitted (a) from an anthropogenic source or (b) from a “natural” source: if he had more than two brain cells which could work together then he would know he must be wrong about that because a molecule does not know from whence it was emitted.
Ed, these gaslighting trolls are trying to consume your time by posting nonsense. Please stop treating them with respect. Swat them and move on to dealing with comments from constructive posters.
In other words, walk away when tempted to wrestle with a pig: you can’t win, you get dirty, and the pig likes it.
Richard
Dear Richard,
Thank you for your comment. You are correct. Nate, Entropic Man, and Tom Dayton make irrational claims and have no intention to discuss science.
Therefore, I have blocked Nate, Entropic Man, and Tom Dayton from making further comments, but their comments will remain so others can read them.
For his part, Nate does not understand either my physics model or models in general. He claims I should add a Revelle effect to my model, but he cannot provide a flow definition or a quantification of the Revelle effect. And his last comment argues about Ballantyne’s semantics.
Whenever I post this You Tube for the anthropogenic climate change alarmist to view they seem to take exception to what Jørgen Peder Steffensen is maintaining about the Earth being 2.5⁰C warmer 4,000 years ago than what it is now. These are the same ones that have no problem with Michael Mann eliminating the well documented MWP with his hockey stick graph. It is obvious from what Jørgen Peder Steffensen has discovered during his examination of the Greenland Ice cores that CO₂ has no influence on the Earth’s climate or its temperature; so why would people such as Nate & Entropic Man, who are not confident enough regarding their believes to even use their real names and hide behind an alias, and Tom Dayton, make a ridiculous effort to argue that CO₂ is the driver of the Earth’s climate, no matter where it came from?
Here is some back ground on how the lying alarmist felt about the Medieval Warm Period.
Statement of Dr. David Deming
University of Oklahoma
College of Earth and Energy
Climate Change and the Media
[…]”In 1995,I published a short paper in the academic journal Science. In that study, I reviewed how borehole temperature data recorded a warming of about one degree Celsius in North America over the last 100 to 150 years. The week the article appeared, I was contacted by a reporter for National Public Radio. He offered to interview me, but only if I would state that the warming was due to human activity. When I refused to do so, he hung up on me.
I had another interesting experience around the time my paper in Science was published. I received an astonishing email from a major researcher in the area of climate change. He said, “We have to get rid of the Medieval Warm Period.”
The Medieval Warm Period (MWP) was a time of unusually warm weather that began around 1000 AD and persisted until a cold period known as the “Little Ice Age” took hold in the 14th century. Warmer climate brought a remarkable flowering of prosperity, knowledge, and art to Europe during the High Middle Ages.
http://www.epw.senate.gov/hearing_statements.cfm?id=266543
We Live in Cold Times
6,221 views
Apr 26, 2021
https://www.youtube.com/watch?v=WE0zHZPQJzA
Dear Ed,
I have been following the CO2 debate for some time. I studied “Environmental Studies” at the University of Montreal for a year in the 1980s before coming to Europe. I enjoyed that year very much. I learned some simple basics in chemistry, climate, recycling, waste and other topics. It was an exciting year, and considering it was all in French, it was all the more challenging.
Today, I can only shake my head at some of the claims made about global warming and the end of the world. Not even the IPCC claims the end of the world, only climate change will have effects that could be negative. They also never mention the positive impacts since the end of the last ice age or the warmer periods before now. It’s all about us and our negative impacts.
I have created a series of 15 charts showing some of the basics of CO2. This may not have any bearing on your own work, but I think these diagrams will be of value to many people in learning the basics. Ron Clutz has reported on me a few times on Science Matters, and he often uses my diagrams when he needs explanations.
https://www.ric-communications.ch/projekte/simple-science-1
The world of CO2
– N° 1 Earth’s atmospheric composition
– N° 2 Natural sources of CO2 emissions
– N° 3 Global anthropogenic CO2 emissions
– N° 4 CO2 – Carbon dioxide molecule
– N° 5 The global carbon cycle
– N° 6 Carbon and plant respiration
– N° 7 Plant categories and abundance (C3, C4 & CAM Plants)
– N° 8 Photosynthesis, the C3 vs C4 gap
– N° 9 Plant respiration and CO2
– N° 10 The logarithmic temperature rise of higher CO2 levels.
– N° 11 Earth’s atmospheric composition in relationship to CO2
– N° 12 Human respiration and CO2 concentrations
– N° 13 600 million years of temperature change and atmospheric CO2
– N° 14 The composition of the human body
– N° 15 Oil consumption in percent by sector
I am happy to make these graphs available on your website for others to use and learn from. There’s a download PDF of all the charts as well.
In the mean time thanks for your great work
Raymond Inauen
Dr Ed. Thanks for all you are doing to counter the climate change lunatics.
As for Nate, Entropic Man, and Tom. Gentlemen, please stand up straight. That popping sound you hear will be your head coming out of your as….
thanks for sharing
good, check mine S1 Film dan Animasi</a\
How does the return of δ14C to zero after nuclear bomb tests support the argument for a dominant natural source of 12CO2?
Good Information
Regards, Unissula
According to the article, what evidence is used to support the claim that natural CO2, not human emissions, is the dominant factor in rising CO2 concentrations?