by Edwin X Berry, PhD, Theoretical Physics, CCM
Ed Berry LLC, Bigfork, Montana
To read key referenced papers:
- CO2 Coalition paper
- Dia Ato paper
- Bernard Robbins paper
- Eike Roth paper
Click here
Responsiveness of Atmospheric CO2 to Fossil Fuel Emissins
by Jamal Munshi
Ferdinand Engelbeen says Jamal Munshi has not proved absence of correlation.
What do you think? Add your comment below.
A Thermal Acid Calcification Cause for Seasonal Oscillations in the Increasing Keeling Curve
Download this Excel file here: https://edberry.com/Excel-File
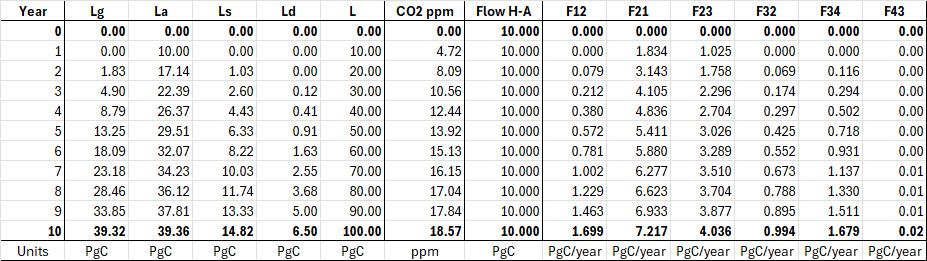
Here is table “Berry Carbon Flow Test” for discussion in our comments.
I request Ferdinand and anyone else who is contesting my calcuations to present your calculations for comparison.
We assume that the natural carbon cycle is at constant levels as shown in Figure 3.
With that information, we insert human carbon into the atmosphere at a constant rate of 10 PgC per year. Then we calculate annual time steps to see how much human carbon ends up in each reservoir each year.
This simple calculation is a way to compare our calculations because we keep human carbon inflow constant for each year.
The years run from zero to ten. All the L data are in PgC, and flow data are in PgC/Year.
Lg = land, La = atmosphere, Ls = surface ocean, Ld = deep ocean, L is the total PgC in the carbon cycle for each year. Ntice L increases by 10 PgC each year.
The CO2 ppm column simply converts the PgC in La to ppm.
Here’s how it works.
Year 0: 10 PgC is added to La, but you don’t see it until the beginning of Year 1.
Year 1: the 10 PgC in La produces outflows to Lg and Ls. We see the result in Year 2.
Year 2: the outflows from La have moved some carbon to Lg and Ls. Etc.
Notice that as La gets more PgC, its Outflow to Lg and Ls increase, etc.
While La increased by 7.14 PgC from Year 1 to Year 2, it increased by only 1.49 PgC from Year 9 to Year 10.
Also notice that as Lg and Ls get more carbon, they send carbon back to La.
Adjustment, Residence, E-time Compared
IPCC’s response times fail physics
Physics e-time has a precise definition. The IPCC times do not. In summary:
- Physics: e-time is the time for the level to move (1 – 1/e) of the distance to its balance level.
- IPCC: adjustment time is the time for the level to “substantially recover” from a perturbation.
- IPCC: residence time is the average time a CO2 molecule stays in the atmosphere.
IPCC defines “adjustment time (Ta)” as:
The time-scale characterising the decay of an instantaneous pulse input into the reservoir.
Cawley defines “adjustment time (Ta)” as:
The time taken for the atmospheric CO2 concentration to substantially recover towards its original concentration following a perturbation.
The word “substantially” is imprecise.
Cawley follows IPCC to define “residence time (Tr)” as:
The average length of time a molecule of CO2 remains in the atmosphere before being taken up by the oceans or terrestrial biosphere.
In summary, IPCC uses two different response times where it should use only e-time:
- When the level is far from its balance level (which can be zero), IPCC thinks e-time is an adjustment time because the level is moving rapidly toward its balance level.
- When the level is close to its balance level, IPCC thinks e-time is a residence time because “molecules” are flowing in and out with little change in level.
Figure A illustrates how e-time relates to IPCC’s adjustment and residence times.
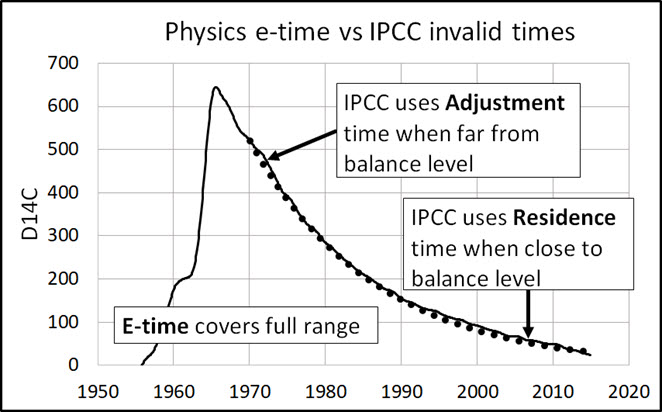
Figure A. E-time covers the full range of movement of level to a balance level. IPCC adjustment and residence times apply to only each end of the range.
IPCC, 2001: Working Group 1: The scientific basis. Appendix 1 – Glossary.
Lifetime
Lifetime is a general term used for various time-scales characterising the rate of processes affecting the concentration of trace gases. The following lifetimes may be distinguished:
Turnover time (T) is the ratio of the mass M of a reservoir (e.g., a gaseous compound in the atmosphere) and the total rate of removal S from the reservoir: T = M/S. For each removal process separate turnover times can be defined.
Adjustment time or response time (Ta) is the time-scale characterising the decay of an instantaneous pulse input into the reservoir. The term adjustment time is also used to characterise the adjustment of the mass of a reservoir following a step change in the source strength.
Half-life or decay constant is used to quantify a first-order exponential decay process.
The term lifetime is sometimes used, for simplicity, as a surrogate for adjustment time.
In simple cases, where the global removal of the compound is directly proportional to the total mass of the reservoir, the adjustment time equals the turnover time: T = Ta.
In more complicated cases, where several reservoirs are involved or where the removal is not proportional to the total mass, the equality T = Ta no longer holds.
→Carbon dioxide (CO2) is an extreme example. Its turnover time is only about 4 years because of the rapid exchange between atmosphere and the ocean and terrestrial biota.
However, a large part of that CO2 is returned to the atmosphere within a few years.
Thus, the adjustment time of CO2 in the atmosphere is actually determined by the rate of removal of carbon from the surface layer of the oceans into its deeper layers.
Although an approximate value of 100 years may be given for the adjustment time of CO2 in the atmosphere, the actual adjustment is faster initially and slower later on.
Jim Siverly, July 29, 2025 at 9:48 am
1. Agreed to use Te and Tau as separate things, to keep the discussion clear.
2. About the “no back-flow” point. That was used for a one compartment model: Many (Koutsoyiannis, Harde, Stallinga,… use the “lake/bath tube/container” model with one-directional inflows, container and one-directional outflows:
`Koutsoyiannis does that very detailed in his RRR approach, which indeed is superb for… lakes, which is his specialization:
https://www.itia.ntua.gr/en/getfile/2474/1/documents/water-16-02402-v2.pdf
Which is way over my head for his formula use, but when the result seems to prove that 2 + 2 = 3, something in his reasoning doesn’t fit reality…
I used a simple “river/lake/river” as example of such a process:
https://www.ferdinand-engelbeen.be/klimaat/klim_img/classic_view.png
Important points:
In that case Te = Tau = mass / output = RT (turnover/residence time)
In no way a “marker” in the inputs can exceed its input ratio in all following parts.
For a one compartment process, if you have back-flows, the situation is completely different:
I used the “fountain” model to make the difference as clear as possible:
https://www.ferdinand-engelbeen.be/klimaat/klim_img/real_view.png
Important points:
In that case, RT and Tau are completely decoupled and Te hardly exists as function of the pumping around, despite an enormous outflow of the basin into the cycling pump.
RT is a function of a process that is not or hardly influenced by the level/pressure in the basin
Tau is only influenced by the extra level in the basin and not at all by how much circulates, thus completely independent of the total “outflow” out of the basin.
Any “marker” in the input can asymptotically increase to 100% of the basin.
That was for the discussion in Athens, September last year…
In the case of multiple reservoirs, that makes it more complicated, but then the second problem: processes that move CO2, independent of its pressure in a reservoir, again plays a major role, compared to the small effect of CO2 pressure changes…
If we may assume that “earth” is a second reservoir where all outflows of the atmosphere go in and come back as similar inputs then we have:
Your 4 years Te is based on the calculated total sum of outputs out of the atmosphere into “earth”.
Your inputs are back-calculated to show the observed difference between the previous year and the new year CO2 concentration, based on the 4 years Te of the outflows.
Dr. Ed calculates the total inflow from the different Te’s of the different reservoirs, but also assumes that the outflow into “earth” is 4 years, based on the total outflows.
We don’t use inflows and outflows at all, only the extra pressure difference in the atmosphere with the “old” equilibrium and the observed net sink rate, or for modern times the ratio between the increments of CO2 pressure in the atmosphere and the observed increase in net sink rate. That gives the Tau of 50-55 years.
So which approach is the right one?
Te could be the right one, if all processes were 100% CO2 level/pressure dependent.
Because 95% of all processes that move huge quantities of CO2 (mainly diurnal and seasonal) between the reservoirs are temperature and biological dependent, Tau is the right one, as that shows the real, small, effect of the increase in CO2 pressure in the atmosphere on the change in net uptake.
3. “Can we agree that saturation of any reservoir is irrelevant because surface ocean CO2 goes to the deep and from there to the ocean floor? Nothing stops those processes continuing to infinity, if you apply realistic physical-chemical processes.”
Be careful, the ocean surface indeed gets saturated for any change in the atmosphere within a year and the IPCC uses that for the “isolation” of the deep oceans from the atmosphere, which leads to Tau’s of hundreds to thousands of years.
You do that indirectly: with a Te of 4 years, the “equilibrium” between atmosphere and “earth” also goes up with the increase in the atmosphere and when human emissions should stop completely, there is only a small change to a lower level…
4. “Also, can we agree that your hypothesis of net removal rate being a function of the difference between the total amount of CO2 in the atmosphere and the (old) equilibrium has never been experimentally verified?”
As the ratio between increase in the atmosphere and increase in net uptake remained and remains relative constant, the real world proof is given…
David Andrews July 30, 2025 at 5:49 am
David,
Thank you very much for this information.
Indeed, President Trump may lose the Lighthiser v Trump climate lawsuit on this very issue, which could overturn all his executive orders on climate and energy.
The courts properly make their decisions based on the data presented in a trial, as the court did in Held v Montana.
So, you and the Democrats could win a smashing big victory in Lighthiser v Trump because, at the moment, your side and the CO2 Coalition have Trump convinced that you are correct.
Dr. Ed, July 28, 2025 at 5:11 pm
A small addition about the O2/CO2 plot:
“The figure does not allow that natural CO2 might have caused some of the CO2 increase.”
The figure only shows the calculated release of CO2 and use of O2 from burning fossil fuels, the uptake of CO2 and release of O2 by the biosphere and the results of observations, where the oceans fill the gap of the remaining uptake.
There is no restriction at all that blocks the results of any natural release of CO2: if that was additional to the release by FF use, then the observations would be at the right side of the FF release of CO2.
If e.g. the biosphere was a net emitter of CO2 and not a net sink, then the oxygen use would have been larger than of FF only…
Ferdinand Engelbeen
July 30, 2025 at 6:41 AM
I see the equation on graph B is a polynomial fit and that the line just looks linear. That’s my fault, but it has nothing to do with my confusion over your calculation of new Tau from n and n-9 data. I generated a new spreadsheet to show my calculations. What am I doing wrong?
https://www.dropbox.com/scl/fi/6e7f6y10gukegc7vqk28v/New-Tau.xlsx?rlkey=8e1qnz65yi5at2ztdb24ir1fj&dl=0
I also tried plotting net removal of CO2 [delta CO2 – FF emissions] versus the increase of CO2 in the atmosphere [delta CO2] and found a very low correlation, not even close to being directly proportional. Please define the variables more clearly in terms of Mauna Loa data and known FF emissions.
Jim Siverly, July 30, 2025 at 11:23 am
Indeed you are right: my calculation (again) was based on the 10-year increments, compared to the “old” equilibrium of 285 ppmv for each year, not on the difference over 10 years in itself…
The problem is that there is an enormous – temperature induced – noise on the net sink rate, which is small: +/- 2 ppmv for the 100 ppmv trend, but very huge for a 5 ppmv/year increase.
So forget the 10-year increments, these remain too noisy.
What is left is the total increase since 1958 with accurate measurements and reasonable accurate FF emissions.
That is an increase of near 100 ppmv (414.24 – 315.97) between 1959 and 2020, with a net sink rate increase over the same time frame of 1.86 ppmv/year (2.29 – 0.44), based on the polynomial to avoid the influence of the huge noise.
Interesting to note: the increase of CO2 in the atmosphere since 1958 is already 80% of the total increase increase since 1850. That also is the case for about 80% of human emissions ánd also the case for 80% of the net sink rate.
Which points to a very linear ratio as response of the sinks to the extra CO2 in the atmosphere.
A small point of difference: I wondered about the difference between the 50 and 55 years Tau between the “old” and “new” calculations. That difference is in what is taken as human emissions:
Spencer and others and I in the past used the total emissions, including land use changes. In our common work for the CO2 Coalition we used only FF emissions, without far more uncertain land use changes. That gives a difference of about 10% in human emissions and Tau…
Ferdinand Engelbeen
July 31, 2025 at 2:29 am
I have been reviewing the evolution of Carbon Cycle Modeling starting with the comments of Peter Dietz on the John Daly website. The dialogue is fascinating considering some of our discussion here.
Tom Wigley in response to Peter Dietz: “It is, of course, quite possible to produce highly simplified (or ‘reduced-form’) versions of these models; but the original ‘first principles’ model must always be better and more credible than the simpler model. The real strength of first principles models is that they do not have free parameters that can be arbitrarily tuned to match observations.”
Peter responds to Tom Wigley, “The clue of my model is that I only consider the *change* in uptake flux which is proportional to the CO2 partial pressure increment against the equilibrium, e.g. 280 ppm. This reflects the acting main physical and chemical laws and thus is valid for the bulk of the sink fluxes….”
“It is remarkable that both Peter Dietze and Jarl Ahlbeck find that the present equilibrium value is the same as the pre-industrial. Shouldn’t the increase have started already? Best regards, Lars Kamél”
Peter responds, “Lars, you should not misinterpret the perturbation state as a shift of equilibrium. We consider the (final) equilibrium towards which any concentration increment will “decay” to 1/e within 55 years, as constant, i.e. 280 ppm. The equilibrium is *not* expected to shift within the geological short time of fossil fuel use – consider the huge oceanic sink capacity including shells and corals.”
Jarl Ahlbeck, “If the diffusion is controlled by a first order Fick’s equation to a greater extent than by the second order, the absorption rate is almost directly proportional to C(surf.carbon)-C(deep layer carbon) or to C(atm)-280 ppm. The rate constant may be calculated statistically from available data. The problem is the intercorrelation between emissions and concentration making an idealized batch describing recent data almost as well (constant airborne fraction) as when taking significant mass transfer to deeper layer into account (variable airborne fraction). I have walked around the problem by calculating the airborne fraction from data although I do not like this parameter, it feels a little unscientific.”
I found this interesting reference by Enting et al., 1994: https://unfccc.int/resource/brazil/documents/enting_2001a.pdf with the following quote,
“These fluxes are net fluxes superimposed on large natural gross fluxes of carbon. In many cases the models will consider the gross fluxes, particularly when calculating isotopic effects. The distinction is well-understood within the field of carbon cycle modelling, but sometimes causes confusion when results are reported.”
That last phrase is an understatement considering the exchanges you are having with Dr. Ed and some of us here.
From the Enting et al. paper comes the equation 2.123 dC/dt = Qfoss (t) + Dn (t) – Socean (t) – Sfert (t) – Sresid (t)
Except for Qfoss, the fossil emission rate, all other terms are net fluxes. One of the co-authors of that paper was Tom Wigley. He wrote an earlier paper with a similar equation, 2.123 d(deltaC)/dt = I + Dn – X – F, where I = Qfoss, X = Sfert, and F = Socean. He defines deltaC as C – Co. Since dCo/dt is zero, his equation is a form of Enting et al. Technically, each of the net flux terms should be written as k * S(r-a) – k’ * S(a-r) to reflect the true mass transfer process between the atmosphere and the reservoirs.
Wigley defined X as a terrestrial feedback (transfer from the atmosphere to the terrestrial biosphere). While Dn – X accounts for the “full” net terrestrial transfer, there is no similar appreciation for the effect of ocean outgassing which would moderate the value of F, the ocean sink. Without a +Y to offset F, analogous to X offsetting Dn, an important variable becomes embedded in the net variable F. I believe this leads to the misconception that flows are proportional to net concentration differences. The most egregious misuse of that concept is in assuming a net flux is proportional to the difference between a concentration now compared to what it was in 1750. That is the basis of the models of Dietz, Spencer, et al.
My contention is that flows are proportional to absolute concentrations which takes into account the probabilities affecting the mass transfer from one reservoir to another. Net fluxes erase that fundamental aspect. Now I just need to find the experimental evidence that proves it.
Sorry, the Enting et al. equation comes from https://unfccc.int/resource/brazil/documents/enting_2001a.pdf
Wigley’s paper can be found at https://b.tellusjournals.se/articles/10.3402/tellusb.v45i5.15739
Jim Siverly, July 31, 2025 at 5:43 am
Thanks for remaining me of the discussion between Peter Dietze and the others from the “mainstream” side…
There still are two main differences with the mainstream “model” and our “model” since that time:
1. The saturation of all reservoirs at different levels, no matter the emissions in the Bern and similar models:
https://gmd.copernicus.org/articles/11/1887/2018/
See Figure 5 for a pulse of 100 PgC (we have emitted 170 PgC over the past 65 years…): after 100 years still 40% remains in the atmosphere, because of the isolation of the deep oceans by the ocean surface layer and its physical and chemical restrictions for exchanges with the atmosphere.
Also in the Enting paper: formula 9.2 shows:
GO (t) = 0.131 + 0.201*e^-t/362.9 + 0.321*e^-t/73.6 + 0.249*e^-t/17.3 + 0.098*e^-t/1.9
The last term is the restricted uptake into the oceans surface at about 10% of the change in the atmosphere (the “Revelle”/buffer factor) and that restricts the speed of uptake for the other levels. The worst ones are the 363 years (for calcification?) and 13% that never gets away.
That is reflected in their Figure 9.2…
For a linear model (Dietze, Spencer, we) there is no such restriction (at the ocean “edges”) and in 100 years the airborne fraction will drop to 25%, after 150 years to 12.5%, etc…
Because we now have far more data than in 1997, it looks like that the Bern model is more and more at odds with reality, but still not (too) bad, as the last three terms are faster or similar than the constant t/50 of Dietze and others.
With a linear model, all human releases since 1750 will increase the deep ocean C content with only 1%, leading to an ultimate remaining increase of 1% in the atmosphere or 3 ppmv…
2. The difference between pressure related processes and other processes.
Almost all huge (seasonal) CO2 exchanges between the reservoirs are caused by temperature related processes and related biological processes, largely independent of the CO2 level in the different reservoirs.
Your (and Dr. Ed’s) approach implies that the total output depends of the total CO2 level/pressure in the atmosphere, and the inflows depend of the CO2 levels in the other reservoirs. Which, at least for the biosphere is for 95% not true for the CO2 flow from atmosphere into vegetation and for 100% not the case for the reverse flow…
Then: “Net fluxes erase that fundamental aspect.”.
The problem in this case is that the gross fluxes are only known with large margins of error, while the net flux is quite accurately known, be it with a huge, temperature related, noise…
Jim Siverly July 31, 2025 at 5:43 am
Dear Jim,
You wrote, “My contention is that flows are proportional to absolute concentrations which takes into account the probabilities affecting the mass transfer from one reservoir to another. Net fluxes erase that fundamental aspect. Now I just need to find the experimental evidence that proves it.”
There are two kinds of “evidence” that prove your contention for carbon cycle models.
First, the simple observation (that you have already made) that essential information contained in absolute concentrations is lost in the net fluxes. Net fluxes don’t control flows, but absolute concentrations do.
Second, it is well established in systems engineering that, to simulate natural processes, levels drive flows, and the flows reset the levels. This method of simulation retains the necessary information to simulate nature. Markov processes follow this systems methodology.
In addition, the fact that my carbon cycle equations can be reduced to proven electric circuit equations is further evidence that using absolute concentrations is the correct way to simulate reality.
By contrast, Ferdinand and company try to create a “model” based on net flows. This is impossible because net flows do not contain the information needed for a systems model.
It is OK to have observations for net flows assuming they are accurate. But such data must be used to check valid carbon cycle models that are based upon levels and resulting flows, but not to create a model.
Similarly, Ferdinand and company try to create a “model” based on uptakes. Uptakes don’t drive flows in a carbon cycle model. Natural processes effectively blow carbon through a straw rather than suck up carbon with a straw. Arguments based on uptakes are invalid.
Consider Dalton’s Law of Partial Pressures. The number of carbon atoms that impact a surface in a given time is proportional to their level (or partial pressure). This is best modelled by assuming these impacting atoms are absorbed but the absorber also sends back carbon according to the free carbon level in the absorber.
At equilibrium, the flows in each direction are equal. The flows continue but the level is constant. I think part of Ferdinand and company’s misuse of physics is that they do not understand this simple concept. They think they need a 50-year time constant to explain what happens when the flows are equal and opposite. They don’t get it that a 4-year time constant fully explains the data.
Dr. Ed, July 31, 2025 at 9:24 am
“Second, it is well established in systems engineering that, to simulate natural processes, levels drive flows, and the flows reset the levels.”
and
“Natural processes effectively blow carbon through a straw rather than suck up carbon with a straw. Arguments based on uptakes are invalid. ”
Which is not true for the biosphere: the CO2 flows are driven by temperature and sunlight, largely independent of the CO2 level in the atmosphere. Even reduces the level in the atmosphere when increasing from minimum in early spring to maximum in summer. Thus effectively “sucking” CO2 out of the atmosphere.
More than half (120 PgC/season on a total of 200 PgC in/outflows over a year) of the total outflow out of the atmosphere is driven by the by plant biochemistry of the biosphere. Hardly influenced by the CO2 level/pressure in the atmosphere.
Even so, half of that already returns the same day (!) at night, by soil bacteria and plant respiration, completely independent of what is already in the atmosphere. The other half returns when leaves fall down in fall/winter and are decaying or when vegetation is eaten by animals.
Only some 2.5 PgC/year is the net uptake, directly related to the CO2 level in the atmosphere…
And we fully understand what a dynamic process means. That means that any extra CO2 input in the atmosphere is removed by a Tau that depends of the difference between the disturbance and the equilibrium level. Not the absolute level. That is Le Chatelier’s principle.
Except if you know exactly what the inflows and outflows are, based on the absolute levels of all reservoirs. Which is quite problematic between the different reservoirs in the real world, while the net difference between the inflows and outflows is quite exactly known…
Dr. Ed
July 31, 2025 at 9:24 am
Dr. Ed,
Those decades-old conversations I quoted earlier indicate the carbon cycle modelling community have been group thinking without applying the Dalton’s Law principles. Even the recent Roy Spencer model employs those exact same assumptions. Seems as though not much has changed since 1994.
I should have pointed out that your bomb decay analysis is retrospective experimental evidence as is your model data which should have satisfied Ferdinand and company as sufficient proof. Are you aware of any research that carried out a prospective experiment to make the case that net fluxes don’t control flows? It may take more than a good argument to win court cases.
Jim Siverly, July 31, 2025 at 10:18 am
|
“I should have pointed out that your bomb decay analysis is retrospective experimental evidence”
Not at all… If you know that there is a huge difference between mass flows and isotopic ratio flows…
As mass, about half human FF emissions per year are removed by other processes.
As isotopic ratio, about 2/3 of human FF emissions per year are replaced by other processes.
Or the difference between removal and replacement (without removal)…
And I still am waiting for the explanation why the 14C decay rate is about 12 years and not yours 4 years. if all carbon/CO2 is equal…
Jim,
Also, there is all kinds of evidence for Te. There is zero evidence for Tau. Te is in keeping with how nature works, for instance, the gravitational constant, the equivalence principle, the gas laws, or the laws of conservation. Te includes Euler’s number in its derivation. Tau is a mathematical construct of a model that is continuously changing. God does not work that way. Tau is something Ferdinand and David believe, not something they’ve observed. They believe in the Science of Peter Pan.
Ferdinand,
Dr. Ed has already explained that in his paper. Because the 14C curve is 100% 14C. Nature is 98% 12C. Read his paper.
Ferdinand Engelbeen
July 31, 2025 at 8:26 am
The Bern model has been sufficiently discredited and needs no further trashing. What I have a problem with is your model, deltaC = Eh – (Cn – Co) / Tau, versus my model, deltaC = Eh + En – Cn / Te.
Please address the following:
You wrote, “Almost all huge (seasonal) CO2 exchanges between the reservoirs are caused by temperature related processes and related biological processes, largely independent of the CO2 level in the different reservoirs.”
And stated so many times, as yet without proof. Temperature affects transport rates but doesn’t drive them. They are driven by the magnitude of the reservoir concentrations.
Also, how can a net flux be quite accurately known, if the gross fluxes from which they are calculated are only known with large margins of error? Error propagates.
Stephen P Anderson
July 31, 2025 at 12:07 pm
Stephen,
People aren’t arguing against the Te, but rather that both Te and Tau are in play. As Dr. Ed wrote, “They think they need a 50-year time constant to explain what happens when the flows are equal and opposite. They don’t get it that a 4-year time constant fully explains the data.”
Still, explaining that, as Dr. Ed has done over and over, seemingly makes no difference to Ferdinand and David. As you wrote, it’s something they believe. But they believe that they HAVE observed Tau.
I won’t be going back to the lab bench, but what I think what we need is to find some data that proves Tau is the construct we think it is. Otherwise the issue won’t be going away, at least in my lifetime. As Tom Wigley wrote to Peter Dietz, “I’m sure you will realize that we cannot wait for 50 years to see whether you are right.” That was twenty-four years ago.
Dr Ed
July 31, 2025 at 9:24 am
“At equilibrium, the flows in each direction are equal. The flows continue but the level is constant. I think part of Ferdinand and company’s misuse of physics is that they do not understand this simple concept. They think they need a 50-year time constant to explain what happens when the flows are equal and opposite. They don’t get it that a 4-year time constant fully explains the data.”
Yes and when all else fails blame the deep oceans.
FE: ” after 100 years still 40% remains in the atmosphere, because of the isolation of the deep oceans by the ocean surface layer and its physical and chemical restrictions for exchanges with the atmosphere”
Stephen P Anderson, July 31, 2025 at 12:12 pm
“Dr. Ed has already explained that in his paper. Because the 14C curve is 100% 14C. Nature is 98% 12C. Read his paper.”
I have read his paper…
Te and Tau have the same scientific meaning: the e-fold decay rate for some extra injection of CO2 in the atmosphere.
Te for the bulk of 12/13CO2 is 4 years, according to Dr. Ed, Tau is 50 years, according to the rest of the scientific world, with a few exceptions.
Dr. Ed says that the Tau of 50 years is rejected, because the observed Tau of Δ14C from the atomic bomb tests is only 12 years. Which I explained by the facts that both the supply of 14C-free FF CO2 and the return of pre-bomb 14C (and pre-industrial 13C/12C ratio) via the deep oceans “dilute” the 14C (and 13C) “fingerprint”, making the decay of an extra impulse of 14CO2 faster than for the injection of some “bulk” 12/13CO2.
I didn’t receive any explanation why the decay rate of Δ14C is not 4 years as it should be for any CO2 molecule, whatever its isotopic composition…
Brendan Godwin, July 31, 2025 at 5:01 pm
“Yes and when all else fails blame the deep oceans.”
What you quoted is what the IPCC says, not what we said. To the contrary, we totally disagree with that concept and the resulting “hundreds to thousands” of years that the extra CO2 remains in the atmosphere.
“They think they need a 50-year time constant to explain what happens when the flows are equal and opposite.”
That is not what we said or even implied.
When the equilibrium is reached, of course the flows are equal and opposite, no matter if these flows are 10 or 100 or 1000 PgC/year.
Our difference in opinion is for when there is a disequilibrium: because humans inject nowadays some 10 PgC/year extra into the atmosphere. The question then is, how fast the 10 PgC/year is removed to get back to equilibrium.
According to Dr. Ed, that is 4 years. According to the increase in the atmosphere, that is 50 years…
Jim Siverly, July 31, 2025 at 12:41 pm
“The Bern model has been sufficiently discredited and needs no further trashing. What I have a problem with is your model, deltaC = Eh – (Cn – Co) / Tau, versus my model, deltaC = Eh + En – Cn / Te.”
Agreed, but you use the arguments of Wigley, Joos and others, while these “mainstream” scientists are arguing that the 50 years Tau for the decay of the extra CO2 is much too short (!) to “prove” that our 50 years Tau is much too long…
Then your formula.
deltaC = Eh + En – Cn / Te
In the real atmosphere as observed for 2020:
5 PgC/yr = 10 PgC/yr + En – 900 PgC / 4 yr = 10 PgC/yr + En – 225 PgC/yr
En = 220 PgC/yr
For 1960:
1 PgC/yr = 2 PgC/yr + En – 670 PgC / 4 yr = 168 PgC/yr
En = 167 PgC/yr
Because of the equivalency principle, one would expect that the removal of the extra 10 PgC would be 25% per year, not 50% per year… And the increase in inflow and outflow doesn’t match the observed increase in flows, according to the IPCC.
Our formula gives:
delta C = Eh – A(net)
where delta C is measured (Mauna Loa) and Eh is calculated from FF sales.
A(net) = 10 PgC/yr – 5 PgC/yr = 5 PgC/yr for 2020
No matter what En or Te or Tau is.
If A(net) is directly proportional to the extra CO2 above equilibrium, then delta A(net) is directly proportional to delta C (but be aware of the temperature induced huge noise in delta C), even without knowing or using that equilibrium:
An increase of near 100 ppmv (414.24 – 315.97) between 1959 and 2020, with a net sink rate increase over the same time frame of 1.86 ppmv/year (2.29 – 0.44), based on the polynomial to avoid the influence of the huge noise.
Tau = delta C / delta A(net)
Tau = 98.27 ppmv / 1.86 ppmv/yr = 52.8 yr
That is the calculated Tau, based on real life observations for the CO2 increase in the atmosphere, the calculated FF emissions, based on taxes on sales, and the change in difference between these two over a period of 60 years. Representing some 80% of all emissions, 80% of the increase in the atmosphere and 80% of the increase in both delta C and A(net).
The ~50 year Tau fits all the observed data…
To understand C14 dynamics and the bomb pulse, you all need to look at the trajectory of the atmospheric concentration of C14 as well as the trajectory of DeltaC14. See figures 2 and 4 of Presentation of Radiocarbon data
https://www.cambridge.org/core/services/aop-cambridge-core/content/view/193CDF1F705B269BC975AF178CEF1AC3/S0033822224000274a.pdf/discussion-presentation-of-atmospheric-14co2-data.pdf
No, the C14 did not disappear from the atmosphere in 4 years, or even 12.
Jim Siverly, July 31, 2025 at 12:41 pm
“And stated so many times, as yet without proof. Temperature affects transport rates but doesn’t drive them. They are driven by the magnitude of the reservoir concentrations.”
I thought it was obvious from the observations that temperature and sunlight are the main drivers for the uptake of CO2 in spring/summer by the biosphere. Regardless of what is the CO2 level in the atmosphere, at least on short term.
But good, let us see what happens on different in only one time frame…
The diurnal cycle.
Plants take in CO2 during daylight and respire CO2 at night and so do soil bacteria from old debris all day round.
If there is an inversion layer in the atmosphere, CO2 levels near ground are not mixed with the bulk of the atmosphere and can show huge changes between day and night. Here for a few days at a modern station, Linden/Giessen in mid-west Germany:
https://www.ferdinand-engelbeen.be/klimaat/klim_img/giessen_background.png
The “background” stations from near the North Pole to the South Pole show very little change over days and little difference between each other of around 380 ppmv in average. These represent the CO2 levels of 95% of the CO2 mass in the atmosphere.
The levels in Giessen are taken at a few meters above ground in a semi-rural area, at a few km from forests.
Between the ground and up to the inversion level, a few hundred meters above ground, CO2 may be mixed during the day, but hardly at night. That makes that CO2 levels increase enormously at night and get lower that “background” during daylight, but less pronounced. Below 160 ppmv, for most plants, photosynthesis stops.
The overall global uptake by plants is about 120 PgC/year for the current level in the atmosphere, mainly in spring/summer and of which about half, 60 PgC/year, is already released at night.
The diurnal cycle is clearly completely independent of the “background” CO2 level in the atmosphere and heavily reacts on temperature and mainly sunlight.
That is already for 60 PgC/year in and out or about 30% of your outflows and thus your Te, which has near nothing to do with the CO2 pressure in the bulk of the atmosphere…
Similar conclusions can be taken for the rest of the biosphere, be it on a scale of months and for the seasonal ins and outs of the ocean surface.
Ferdinand Engelbeen August 1, 2025 at 4:27 am
Dear Ferdinand,
Please elaborate on your above comment to make it clear so I and maybe others can follow your argument.
Especially, please include your definitions of all the parameters you use in your calculations so I can follow your arguments. Trying to find your definitions in your previous comments is difficult.
Thanks, Ed
Ferdinand Engelbeen
August 1, 2025 at 4:27 am
I only used the arguments of Wigley, Joos and others to put your model in context. Dietz argued with them about the Revelle factor and supposedly other limitations of a saturated ocean to prolong an adjustment time. He was right. Nevertheless, the Dietz model still incorrectly bases the removal rate on proportionality to the difference between the current atmosphere concentration and a constant reference equilibrium value equal to what the atmosphere concentration was prior to the start of the industrial period.
Please don’t use anecdotal data in conjunction with Magic Math to try and discredit my model with the equivalence principle. In both 2020 and 1960, the 25% of the atmosphere removed applied equally to whatever amount of industrial carbon was in the atmosphere. That could have been from the current year or whatever remained from previous years, makes no difference.
“If A(net) is directly proportional to the extra CO2 above equilibrium, then delta A(net) is directly proportional to delta C….”
How is that not just a spurious correlation? I get an equally good correlation using delta C versus extra CO2 above equilibrium. Remember what Tom Wigley wrote, “It is, of course, quite possible to produce highly simplified (or ‘reduced-form’) versions of these models; but the original ‘first principles’ model must always be better and more credible than the simpler model. The real strength of first principles models is that they do not have free parameters that can be arbitrarily tuned to match observations.”
That means that just because your 50-year Tau fits all the observed data, it may be arriving at the correct fit with an incorrect model, i.e. one that uses nonphysical principles. I am working on a post that will show you that the Dietz/Engelbeen model is a unidirectional one-compartment model with a singular input from FF emissions. A bidirectional two-compartment model, while still inferior to multi-compartment models, will demonstrate with appropriate physical principles the sufficiency of a single 4-year Te and obviate a 50-year Tau.
August 1, 2025 at 8:31 am
“I thought it was obvious from the observations that temperature and sunlight are the main drivers for the uptake of CO2….”
You know what’s obvious? The sun comes up every day and goes down at night. The expected temperature swings follow. Meanwhile, concentration gradients continue to drive mass transfer 24/7.
Ferdinand,
“I didn’t receive any explanation why the decay rate of Δ14C is not 4 years as it should be for any CO2 molecule, whatever its isotopic composition…”
No, isotopic composition does affect reaction rates. Dr. Ed estimated Te for 14C at around16 years. That’s not 50 years. Why isn’t it 50 years? Oh, wait, I think your Tau has grown to 55 years. Why isn’t it 55 years?
Jim,
“I won’t be going back to the lab bench, but what I think what we need is to find some data that proves Tau is the construct we think it is.”
Why wouldn’t the C14 data be evidence against Tau?
Jim Siverly, August 1, 2025 at 12:03 pm
“You know what’s obvious? The sun comes up every day and goes down at night. The expected temperature swings follow. Meanwhile, concentration gradients continue to drive mass transfer 24/7.”
If you are not willing to accept that the upcoming sun and temperature drives 95% of the CO2 uptake and the concentration gradients only 5%, then you are just wasting everybody’s time…
Stephen Paul Anderson, August 1, 2025 at 1:44 pm
“No, isotopic composition does affect reaction rates. Dr. Ed estimated Te for 14C at around16 years. That’s not 50 years. Why isn’t it 50 years? Oh, wait, I think your Tau has grown to 55 years. Why isn’t it 55 years?”
Yes for “per mil” or tenths of a percent, as these ratio’s are expressed in that order of change.
Hardly for quantities (mass) of 14C or 13C, except when the ratio’s are “diluted” by other sources with a strong difference in isotopic ratio…
Stephen Paul Anderson August 1, 2025 at 1:44 pm
Dear Stephen,
The Delta14C data is excellent data. Since 1970, Delta14C has returned to within a few percent of its original long-term balance level of zero.
My curve fit of Delta14C is also very accurate. The return of Delta14C to its balance level of zero has a constant Te of 16.5 years. There is no way that Delta14C needs a Tau of 50 years to properly fit the data.
The Te of Delta14C is not to be confused with the Te of CO2. First, IPCC says this Te is “about 4 years.” Second, IPCC’s data for its natural carbon cycle at equilibrium at 280 ppm, shows Te for atmospheric CO2 is 3.5 years. There is no place for a Tau of 50 years.
Delta14C data show the balance level of human CO2 produced by its continuing inflow is very small compared to the balance level of natural CO2 produced by its continuing inflow.
Thus, the human CO2 balance level is less than 8 parts in 1000 and likely only 4 parts in 1000. For this to happen, the real Te for 12CO2 in the atmosphere must be LESS THAN 3.5 years.
Here’s one problem with Ferdinand’s claims that a long Tau occurs when a level is near its balance level:
In a medium of carbon or CO2, there can be only one Te for all carbon or CO2.
There cannot be a short Te for new carbon and a long Te for old carbon, because nature does not know how long any carbon atom or CO2 molecule has been in the atmosphere. There simply cannot be 50-year Tau CO2 floating around with 4-year Te CO2. Can’t happen.
Ferdinand Engelbeen August 1, 2025 at 3:00 pm
“If you are not willing to accept that the upcoming sun and temperature drives 95% of the CO2 uptake and the concentration gradients only 5%, then you are just wasting everybody’s time…”
Are you talking about how warmer CO2 can have more collisions per unit time with a surface than colder CO2?
Indeed, warmer temperature can decrease Te a small amount, but this is negligible because we must calculate such temperature changes in terms of absolute temperature in degrees K.
Ferdinand Engelbeen
August 1, 2025 at 3:00 pm
As far as I can tell, there is no natural emissions input to the Dietz model which I believe is basically Roy Spencer’s and your model, too. Natural emissions are assumed constant and equal to whatever share of the atmosphere they are considered to maintain. David Andrews has mentioned that they don’t have to remain constant as it makes no difference with his simple math and “disequilibrium isoflux.” I think you concur with that.
Before I stop wasting your time, I want to conclude my efforts to demonstrate how a one-compartment model embodies the basic concepts Dr. Ed has been trying to explain. Only one e-time is necessary to describe the evolution of CO2 in a physical-chemically meaningful way and perfectly match the Mauna Loa data. The one-compartment model is objectively bidirectional, not assumed to be automatically operating in the background like a fountain model.
The spreadsheet is a step-wise calculation of the CO2 accumulation based on the differential equation, dC/dt = Eh + En – C / Te, which simply states the increase in CO2 equals inputs minus outputs. The solution is
C(t) = [ C(0) – ( Eh + En ) * Te ] * exp( -t / Te ) + ( Eh + En ) * Te
I provided several scenarios in separate columns to illustrate the possibilities of a constant input rise to a balance level, a supplement of only FF emissions, and three scenarios with additional natural emissions. The last of the three includes an exponential addition of natural (or what could be any combination of other sources of emissions) that perfectly matches the Mauna Loa data. One can modify the starting balance level and input rates of the first four scenarios to get a feel for how starting balance levels and input rates affect the level. I used the same Te for all scenarios, so you would have to modify the formulas in each column to change Te. (Darn, I should have used a different cell for Te in each column).
https://www.dropbox.com/scl/fi/0fq76607u6onis8zopwgb/1-comp-CO2-model.xlsx?rlkey=kq01rp83cu9u50b2hkxpbvl5y&dl=0
Notice that the coefficient of time in the exponent (in cell J6) in the formula supplementing FF emissions with natural emissions equals 0.02. I don’t think that is a coincidence. I think it’s how Peter Dietz arrived at a Tau of 55 years.
In my previous comment, I left out a minus sign in front of exponential t / Te in the C(t) equation.
[ADMIN NOTE: I inserted the minus sign before t in Jim’s C(t) equation.]
I also wanted to reiterate that there is no logical reason to quantitate adjustment times. First, the clock could only start with net zero which isn’t going to happen. Second, what is the likelihood that any additional natural emissions will subside? They would be some combination of human-caused and strictly natural emissions that are not constrained by any adjustment time. Any reduction in atmospheric CO2 will be due to the removal processes contributing to the approximately four-year e-time.
Ed,
You insist on analyzing “human” and “natural” carbon cycles separately. But you also insist on analyzing C14 as a ratio to C12, via the DeltaC14 variable, rather than C14 and C12 concentrsations separately. Your strategy makes sense only if you don’t want to address what the concentration data shows.
Dr. Ed,
“There cannot be a short Te for new carbon and a long Te for old carbon, because nature does not know how long any carbon atom or CO2 molecule has been in the atmosphere. There simply cannot be 50-year Tau CO2 floating around with 4-year Te CO2. Can’t happen.”
Yes, the Equivalence Principle and the Law of Equipartition. Yes? Ferdinand’s Tau violates both of these.
Dr. Ed, August 1, 2025 at 3:32 pm
“The return of Delta14C to its balance level of zero has a constant Te of 16.5 years. There is no way that Delta14C needs a Tau of 50 years to properly fit the data.”
If Te is 4 years for any isotopic composition of CO2, then the bomb spike should have returned to its balance level faster than with the 4 years e-fold decay, because of its dilution with 14C-free fossil fuel CO2 ánd the return of the “old” 14C ratio from the deep oceans, long before the bomb tests.
The 16.5 years Te/Tau definitely rejects the 4 years Te, but is faster than for a “bulk” CO2 injection.
“First, IPCC says this Te is “about 4 years.”
That is NOT what the IPCC says. The IPCC says that the turnover time or residence time is 4 years. That is the formula:
(R)T = mass/output
That is the residence time of any single CO2 molecule in the atmosphere, NOT the exponential decay time for an extra CO2 mass injection in the atmosphere.
If (and only if!) that is a one-way process, then (and only then!):
Te = (R)T
In all other cases of direct return flows and/or mass/pressure independent processes, Te and (R)T are largely to completely independent of each other.
“Thus, the human CO2 balance level is less than 8 parts in 1000 and likely only 4 parts in 1000.”
The observed FF level in the atmosphere is over 10%, or 100 parts in 1000. In the ocean surface over 6% and increasing both in vegetation and the deep oceans.
Again, the 4 years Te widely rejected.
“Here’s one problem with Ferdinand’s claims that a long Tau occurs when a level is near its balance level:
In a medium of carbon or CO2, there can be only one Te for all carbon or CO2.”
Besides that different reservoir exchanges have different Te/Tau’s (and saturation for the sea surface), the overall Te/Tau can be calculated from the increase in the atmosphere and the increase in net uptake over the same time span, if the uptake is in exact ratio to the increase in the atmosphere. That calculation shows a Te/Tau of 50 years, not of 4 years.
Dr. Ed, August 1, 2025 at 3:53 pm
“Are you talking about how warmer CO2 can have more collisions per unit time with a surface than colder CO2?”
Absolutely not: I am talking about the amount of CO2 that is released by warming ocean surfaces in spring/summer, releasing some 25 ppmv CO2 and absorbing that again in fall/winter, largely independent of how much CO2 is in the atmosphere. Another 20 ppmv CO2 is just circulating between the equator and poles to get there in the deep oceans and returns some 1,000 years later.
And vegetation, absorbing some 60 ppmv CO2 in spring/summer by warmer temperatures and photosynthesis, of which half is already released again at night by plant respiration and soil bacteria, the other half in fall/winter, again largely independent of how much CO2 is in the atmosphere for the uptake side and completely independent for the release side by all bio-life.
These quantities form the turnover/residence time of 4 years, not a decay rate Te of 4 years.
The Te/Tau caused by any extra CO2 pressure in the atmosphere is 50 years, not 4 years.
Stephen P Anderson, August 3, 2025 at 11:28 am
“Yes, the Equivalence Principle and the Law of Equipartition. Yes? Ferdinand’s Tau violates both of these.”
Both a Te/Tau of 4 years or of 50 years are theoretically possible, depending of how you see the processes at work in the atmosphere.
The defenders of the 4 years Te/Tau, see the atmosphere as a single process, where only the CO2 amount/pressure in the atmosphere causes the overall output, for the full 100%.
The defenders of the 50 years Te/Tau see a lot of different processes at work, where the influence of the CO2 amount/pressure in the atmosphere only plays a very small role in the CO2 flows (less that 5%).
Jim Siverly, August 2, 2025 at 8:13 pm
“I also wanted to reiterate that there is no logical reason to quantitate adjustment times. First, the clock could only start with net zero which isn’t going to happen. Second, what is the likelihood that any additional natural emissions will subside?”
That is based on the idea that there are “additional” natural emissions, while nature is more sink that source for every year that we have accurate data…
As said now several times: there is not the slightest need to know any natural input or output, no matter if the natural cycles doubled or halved over time, no matter if these were 10 or 100 or 1000 PgC/year. Only the difference between inputs and outputs matters and that was negative over the past 67 years, with a few borderline (El Niño) exceptions.
Moreover, a Te of 4 years doesn’t exist. There is a turnover/residence time of 4 years, but nobody did prove that any extra CO2 injected in the atmosphere decays with a Te/Tau of 4 years. The calculated Te/Tau, based on the real, observed decay rate is around 50 years, not 4 years. That is for any bulk injection of CO2, including human FF CO2.
For the δ13C and Δ14C ratio decays: these are faster than for the bulk CO2 decay, because of the return of pre-industrial CO2 with the “old” δ13C and Δ14C levels and the addition of 14C-free and low-13C FF CO2.
Then again your formula:
deltaC = Eh + En – Cn / Te
As observed for 2020:
En = 220 PgC/yr; An = 225 PgC/yr; net removal rate in nature: 5 PgC/yr
For 1960:
En = 167 PgC/yr; An = 168 PgC/yr; net removal rate in nature: 1 PgC/yr
No matter if the removal is 100% natural or 100% FF, it is about quantities, not isotopic ratio’s.
There is no way that a negative contribution adds to an increase…
Jim Siverly, July 31, 2025 at 12:41 pm
“Also, how can a net flux be quite accurately known, if the gross fluxes from which they are calculated are only known with large margins of error? Error propagates.”
That is the beauty of alternative measurements…
dC/dt = F(g-a) – F(a-g) + F(s-a) – F(a-s) + F(d-a) – F(a-d) + E(h)
That is the problem of Dr. Ed’s approach: all these flows are only know with +/- 30% margin, which makes the calculation of F(net) from these flows quite problematic.
The alternative. without knowing even one natural input or output:
dC/dt = F(net) + E(h)
or F(net) = dC/dt – E(h)
Where dC/dt is accurate to 0.2 ppmv/415 ppmv and E(h) accurate to +/- 10% on 10 PgC/year or +/- 1 PgC/year.
“Ed,
You insist on analyzing “human” and “natural” carbon cycles separately. But you also insist on analyzing C14 as a ratio to C12, via the DeltaC14 variable, rather than C14 and C12 concentrsations separately. Your strategy makes sense only if you don’t want to address what the concentration data shows.”
David,
Your left hand doesn’t know what your right hand is doing, does it? It is the CO2 Coalition that believes the 14C:12C ratio is important.
“CO2C concludes,
The decrease of the14C/C ratio in the atmosphere supports the fact that fossil fuels are the cause of the CO2 increase in the atmosphere……”
Dr. Ed. is only pointing out that your logic is flawed. He’s mathematically consistent. You’re not.
Ferdinand,
“Both a Te/Tau of 4 years or of 50 years are theoretically possible, depending of how you see the processes at work in the atmosphere.
The defenders of the 4 years Te/Tau, see the atmosphere as a single process, where only the CO2 amount/pressure in the atmosphere causes the overall output, for the full 100%.
The defenders of the 50 years Te/Tau see a lot of different processes at work, where the influence of the CO2 amount/pressure in the atmosphere only plays a very small role in the CO2 flows (less that 5%).”
Tau doesn’t exist. It is a figment of your imagination. If human emissions went away, the new balance level would still be set by Te, not by Tau. It would be (Total Emission)Te=Lb. Nothing would change.
Stephen Paul Anderson, August 4, 2025 at 8:52 am
“If human emissions went away, the new balance level would still be set by Te, not by Tau.”
A balance level is not set by Te (or Tau), Tau (or Te) is the result of the distance to the balance level… And a Te of 4 years even doesn’t exist. The turnover/residence time is 4 years, but Te/Tau is not equal to the turnover/residence time, if several processes exits that cycle CO2 independent of the quantity of CO2 in the atmosphere…
And the global balance level is ultimately set by the temperature of the sea surface, per Henry’s law. For the current average SST, the balance level would be 295 ppmv, not over 400 ppmv.
Ferdinand,
Per the continuity equation, the balance level is set by Inflow(Te)= Balance Level. Henry’s Law is that the solubility of a gas in a liquid is proportional to the partial pressure of the gas above the liquid. Henry’s Law is a basis for Dr. Ed’s theorem along with the Ideal Gas Law. You need to re-take Chemistry 101.
Stephen Paul Anderson, August 4, 2025 at 8:47 am
“CO2C concludes:
The decrease of the14C/C ratio in the atmosphere supports the fact that fossil fuels are the cause of the CO2 increase in the atmosphere……”
That is one of the many points that supports the conclusion that humans are the cause of the recent increase of CO2 in the atmosphere.
The most important one is the carbon mass balance:
If humans add 10 PgC/year CO2 from burning fossil fuels and the increase in the atmosphere is only 5 PgC/year, then the rest of the world absorbs 5 PgC/year CO2 and there is no way that nature can be the cause of the CO2 increase, or you violate the carbon mass balance.
For the rest, the 14C decay rate is faster than for a bulk CO2 decay, as that is “diluted” by fossil 14C-free CO2 and the return of pre-industrial CO2 from other reservoirs.
Stephen Paul Anderson, August 4, 2025 at 10:19 am
“Per the continuity equation, the balance level is set by Inflow(Te)= Balance Level.”
Not in the slightest way: you are talking about a one-way reactor or lake or bath tube,… Not about the real world.
The balance level of CO2 in the atmosphere is set by the solubility of CO2 in seawater and that changes with the temperature of seawater: about 4.3%/°C, about 16 ppmv/°C for glacial-interglacial transitions.
Some 13 ppmv increase at equilibrium since the Little Ice Age. That is all.
Not over 100 ppmv for less than 1°C warming of the oceans…
“Henry’s Law is that the solubility of a gas in a liquid is proportional to the partial pressure of the gas above the liquid.”
Yes, but that works in both directions… If you open a bottle of Coke, it will get its 6 atm CO2 out into the atmosphere, until equilibrium with the atmosphere and that is 0.000425 bar CO2 nowadays.
The ocean surface adds and subtracts CO2 to/from the atmosphere over the seasons, depending of its temperature.
“Yes, but that works in both directions… If you open a bottle of Coke, it will get its 6 atm CO2 out into the atmosphere, until equilibrium with the atmosphere and that is 0.000425 bar CO2 nowadays.
The ocean surface adds and subtracts CO2 to/from the atmosphere over the seasons, depending of its temperature.”
I don’t know of any textbook that recognizes your definition of Henry’s Law.
Ferdinand Engelbeen August 4, 2025 at 3:48 am
Dear Ferdinand,
I wrote: “The return of Delta14C to its balance level of zero has a constant Te of 16.5 years. There is no way that Delta14C needs a Tau of 50 years to properly fit the data.”
You wrote: “If Te is 4 years for any isotopic composition of CO2, then the bomb spike should have returned to its balance level faster than with the 4 years e-fold decay, because of its dilution with 14C-free fossil fuel CO2 ánd the return of the “old” 14C ratio from the deep oceans, long before the bomb tests.”
The Te is NOT 4 years for 14CO2. Do you see the “14” in Delta14C?
The Te of 12CO2 is about 4 years. The Te of 14CO2 is longer than 4 years. That’s why the Te of Delta14C is longer than 4 years.
You wrote, in summary, The IPCC does NOT say Te of 12CO2 is “about 4 years.”
You are wrong because I define Te = Level / Outflow …… (2)
You wrote, this Te “is the residence time of any single CO2 molecule in the atmosphere, NOT the exponential decay time for an extra CO2 mass injection in the atmosphere.
The definition (2) does not say anything about a single CO2 molecule. It says “level” divided by “outflow.” Which obviously does not refer to a single molecule.
You use your tactic of redefining what others, like me, say and then you attack your own invalid definition.
Furthermore, your implication that (2) is a “one-way process” is further BS. In (2), we need to know only two of the variables to calculate the third variable.
You write: “In all other cases of direct return flows and/or mass/pressure independent processes, Te and (R)T are largely to completely independent of each other.”
Your claim is good science fiction. If you can formulate your claim as a hypothesis, data will show it makes invalid predictions.
I wrote that Delta14C data show “the human CO2 balance level is less than 8 parts in 1000 and likely only 4 parts in 1000.”
You claim: “The observed FF level in the atmosphere is over 10%, or 100 parts in 1000.”
Where’s your data? There are no measurements that can tell the difference between human-caused 12CO2 and natural-caused 12CO2.
I wrote: “In a medium of carbon or CO2, there can be only one Te for all carbon or CO2.”
You replied: “different reservoir exchanges have different Te/Tau’s (and saturation for the sea surface), the overall Te/Tau can be calculated from the increase in the atmosphere and the increase in net uptake over the same time span, if the uptake is in exact ratio to the increase in the atmosphere. That calculation shows a Te/Tau of 50 years, not of 4 years.”
I reply, your calculation that “shows Te/Tau of 50 years” is not a valid calculation. Your calculation is not based on physics. You have not presented anywhere any valid calculation that Te/Tau is 50 years.
We are talking about constructing a simple equation that explains how carbon flows between the reservoirs. (2) is that simple equation. It defines “balance levels.”
(2) explains the return of Delta14C to its original level of zero and the small drop below zero caused by human 12CO2 emissions.
(2) explains how there can exist an equilibrium carbon distribution between the reservoirs.
(2) can replicate IPCC’s equilibrium at 280 ppm without any need for a Tau of 50 years.
You have not shown any data that proves (2) is invalid.
You wrote: “The Te/Tau caused by any extra CO2 pressure in the atmosphere is 50 years, not 4 years.”
I reply, your conclusion is not based on physics. You have not even described a testable hypothesis that describes your claim.
Ferdinand Engelbeen August 4, 2025, at 11:07 am
… in your reply to Stephen Paul Anderson, August 4, 2025, at 10:19 am
You wrote: “The balance level of CO2 in the atmosphere is set by the solubility of CO2 in seawater and that changes with the temperature of seawater: about 4.3%/°C, about 16 ppmv/°C for glacial-interglacial transitions.”
No, these parameters do not directly set the balance level.
The parameters can influence the value of Te that determines Outflow = Level / Te for an outflow of a reservoir, e.g., the Air reservoir.
This outflow becomes an inflow to a receiving carbon reservoir, e.g., Land or Surface Ocean, wherein this inflow sets a “balance level” equal to Inflow * Te of the receiving reservoir.
So FE says that Dr. Ed’s model is to simple and the processes involved are too complicated to model but the fact that there is more each year than the last year proves that sinks are less than sources. Further the gain is less than human sources so the increase is caused by the human sources. Somehow the natural sinks know how much humans will put in and adjust to get half of it out even when the human sources are growing. Further the complicated processes and poor measurements make statistical analysis of the data that show no correlation of rate of change of human emissions to rate of change of atmospheric content for periods up to 5 years inaccurate even though the author of these statistics doesn’t think that is the case. Further Mr. Andrews states that if human emissions stop the increase will end but we can’t tell how long or by how much it will decline. Do we know if the sinks will decline as well or will they continue to grow without human sources?
That’s my summary of this fascinating dialog. I am certainly thankful for this site promoting it and all those that have contributed.
It would be interesting to know what Te has been through the millennia, but I suspect it hasn’t changed much in the last billion years or so since the planet has cooled. It is probably about what it was pre-Cambrian.
Ferdinand Engelbeen
August 4, 2025 at 6:45 am
“Moreover, a Te of 4 years doesn’t exist.” That is wishful thinking and argument by assertion.
“There is a turnover/residence time of 4 years,” is a concession that a Te of 4 years exists.
“nobody did prove that any extra CO2 injected in the atmosphere decays with a Te/Tau of 4 years.” That’s impossible to do, because one cannot end FF emissions and make nature stay constant long enough to prove any decay rate of an injected pulse of CO2.
“The calculated Te/Tau, based on the real, observed decay rate is around 50 years, not 4 years.” That is a logical fallacy, because there has been no real observed decay of injected CO2.
“No matter if the removal is 100% natural or 100% FF, it is about quantities, not isotopic ratio’s.” ???? Proof-read before you post.
“There is no way that a negative contribution adds to an increase…” Another false premise. When have natural emissions ever been negative? I know what you are implying, but it’s unfairly camouflaged in Magic Math.
August 4, 2025 at 7:02 am
Thank you for explaining correctly how a “net flux” can be accurately known. But what does that actually tell us?
Look at the models:
Te group: F(net) = dC/dt – Eh = En – C / Te
Tau group: F(net) = dC/dt – Eh = (Cn – Co) / Tau
I contend my quite accurately known F(net) is the difference between En and C / Te , a real physically meaningful difference between annual natural emissions and amounts removed based on an average observed e-time/turnaround/residence time. In contrast, your quite accurately known F(net) is calculated from two assumed and unknown values, Co and Tau, both never derived from any scientifically-verified physical model.
ADMIN NOTE:
With almost 600 comments, it is difficult to scroll through the comments and to find a comment, and even to make and edit a comment.
Therefore, I activated the WordPress option to separate comments into pages. I set it for 100 comments per page.
You will find a link at the top and bottom of each page to move to a previous or subsequent page of 100 comments.
Ferdinand, Jim, and Ed,
Don’t you think that if you wanted to study 14C movements between the atmosphere and other reservoirs you would start by plotting its concentration over time? It is true that the dominant dating application of radiocarbon requires knowing the 14C/12C ratio, measured by “Delta14C”, and that means it is easier to find plots of this quantity. Nevertheless, with a very small amount of digging you can find plots of the quantity you need: 14C ATMOSPHERIC CONCENTRATION, measured as a molar fraction. See for example the article linked below;
https://www.cambridge.org/core/services/aop-cambridge-core/content/view/193CDF1F705B269BC975AF178CEF1AC3/S0033822224000274a.pdf/discussion-presentation-of-atmospheric-14co2-data.pdf
Please, stop arguing about what Delta14C is doing and look at what 14C concentration is doing. Perhaps, Ferdinand, you should ask Jim how the concentration curve shown in Figure 2, quite different from the Delta14C curve, can be represented simply by a Te. Perhaps you can ask Ed why 14C concentration didn’t return anywhere near to its pre-bomb test “balance level”. Look also at Figures 1 and 4.
I know this is mostly a repeat of an earlier post, but ignorance of the difference between Delta14C and concentration continues.
Dear Ferdinand,
On July 30, 2025 at 8:30 am, you addressed four requests I made on July 29, 2025 at 9:48 am.
1) You agreed on making a distinction between Te and Tau and then conflated Te/Tau on August 4, 2025 at 6:45 am.
2) You explained the Unidirectional Rule that a four-year e-time is only “allowed if (and only if!) all outflows are unidirectional and no back flows are involved” by claiming everybody does it, comparing it to your fountain model, and asking which approach is the right one. “Te could be the right one, if all processes were 100% CO2 level/pressure dependent.” That’s an assertion without evidence. First, inflows don’t need to be level/pressure dependent. Outflows are level/pressure dependent, whether temperature is constant or not. I posted a spreadsheet that shows a four-year e-time one-compartment model with bidirectional flows perfectly explains Mauna Loa data.
The Unidirectional Rule has a corollary [July 20, 2025 at 1:04 pm]: “If (and only if!) all inflows, container and outflows are unidirectional from inputs to outputs, without any direct or indirect recycling from outputs back to inputs, then (and only then!) Te = Tau.”
I claim that both your Unidirectional Rule and its corollary have no physical basis and have been proven false by my one-dimensional model.
3) You asserted without proof and by authority of the IPCC “the ocean surface indeed gets saturated for any change in the atmosphere within a year.” I argue that saturation only means absorption of CO2 by the ocean increases carbonate which dissolves CaCO3 without preventing absorption of more CO2. https://www.dropbox.com/scl/fi/r6uclpqpuyybtpdnv571b/Aqueous-CaCO3-equilibria-vs-p-CO2.png?rlkey=35ao5f191azncby40pw2ppgy2&dl=0
4) You claim, “the ratio between increase in the atmosphere and increase in net uptake remained and remains relatively constant.” However, that is a correlation, not real-world proof of any adjustment time. It’s another logical fallacy. Have you heard of it? Correlation is not causation. Yet, you have argued it axiomatically. Let’s call it the Fnet Axiom.
The Fnet Axiom also has a corollary, [July 29, 2025 at 4:23 am and elsewhere]: “If (and only if) the net output is in exact ratio to the change in disturbance, it doesn’t matter over what time frame Tau is calculated, even if the equilibrium is not known at all.”
The corollary to Fnet Axiom also follows from the same correlation from which the Fnet Axiom is postulated without a sound physical basis. So far, no applicable physical principles, such as Dalton’s Law, have been invoked.
Finally, we have the Natural Flux Theorem [postulated July 6, 2025 at 10:23 am]: “There is indeed one and only one possibility that the natural fluxes are the cause of the increase in the atmosphere: if, and only if, they increased in exact the same ratio as the human emissions.” This also remains unproven.
Stephen Paul Anderson, August 4, 2025 at 11:19 am
“I don’t know of any textbook that recognizes your definition of Henry’s Law.”
The definition of Henry’s law is that there is a fixed ratio between a gas in a liquid and the atmosphere above it for a fixed temperature of the liquid.
That is known for engineering, for 1 bar CO2 pressure, the solubility of CO2 in fresh water is known for different temperatures:
https://www.engineeringtoolbox.com/gases-solubility-water-d_1148.html
That doesn’t imply that the transfer is one-way from atmosphere to liquid.
If the amount of (free) gas in the liquid is higher than the fixed ratio, then gas will leave the liquid and add to the atmosphere, just as what happens with a bottle of Coke if you open it and leave it open.
The same for the oceans: if the temperature of the surface increases in spring/summer, then CO2 will leave the ocean surface with an increase of about 25 ppmv into the atmosphere and when it cools it will absorb about the same amount of CO2…
Jim Siverly, August 4, 2025 at 3:05 pm
“Moreover, a Te of 4 years doesn’t exist.” That is wishful thinking and argument by assertion.
and
“There is a turnover/residence time of 4 years,” is a concession that a Te of 4 years exists.
That are not equivalent sentences. Dr. Ed, to my surprise, made it clear that his “Te” is the simple calculation of mass/outflow, which is the formula for the turnover/residence time. NOT the exponential decay rate for any extra injection of CO2 (of whatever source) in the atmosphere.
Te “may” be equal to the turnover time, if (and only if!) all inflows are unidirectional into the reservoir and to the outflows. Not when e.g. over 50% of the CO2 outputs is sucked out by vegetation in spring/summer and recycled the same day/year into the atmosphere, largely independent of the amounts in the atmosphere. Even increasing from minimum to maximum output while the levels in the atmosphere drop.
That makes no difference at all for the residence time. neither how long a single molecule CO2 (of whatever origin) remains (“resides”) in the atmosphere, but it makes a tremendous difference for the speed that removes any extra CO2 above equilibrium, wherever that may be, even if that is zero CO2.
In the case of circulating flows and processes that are independent of the CO2 pressure in the atmosphere, the decay rate for any extra CO2 injection is NOT equal to the turnover/residence time and need to be calculated out of the observed change in decay rate in ratio to the change in level in the atmosphere. no matter if these changes are positive or negative.
“That’s impossible to do, because one cannot end FF emissions and make nature stay constant long enough to prove any decay rate of an injected pulse of CO2.”
and
“That is a logical fallacy, because there has been no real observed decay of injected CO2.”
Sorry, but one can calculate Tau independent of the FF emissions: the change of total CO2 in the atmosphere is what leads to the change in net absorption of CO2, no matter if FF emissions are one-shot, fixed or in/decreasing over time.
That has nothing to do with the decay of the CO2 injection of one year, but the decay rate of the total CO2 amount in the atmosphere. Both the total CO2 increase and the resulting increase in net CO2 uptake are quite exactly known.
“Another false premise. When have natural emissions ever been negative?”
Any bookkeeper worth his/hers money in this world will tell you that, if you have more expenses than income, you are getting into trouble. No matter if your income is $1,000 or $10,000 or $100,000 per month…
“Te group: F(net) = dC/dt – Eh = En – C / Te
Tau group: F(net) = dC/dt – Eh = (Cn – Co) / Tau”
Te does NOT equal the residence time, thus the calculation of F(net) by a Te of 4 years has no physical basis.
And one can calculate Tau out of the observed change in C and the observed change in F(net), without knowing Co:
Tau = (Cn – Cn-x) / (F(net)n – F(net)n-x)
Co then can be back-calculated from F(net) over the years to where F(net) is zero.
DMA, August 4, 2025 at 2:36 pm
“So FE says that Dr. Ed’s model is to simple and the processes involved are too complicated to model”
Indeed the model that Dr. Ed uses is a simple “lake/bath tube” model where inflows are all unidirectional flowing into the reservoir and unidirectional going to the outflows.
The IPCC has done some work on it and Dr. Ed did show that in his work as Figure 2.
I am trying to translate that scheme into monthly data, as these are quite important to show that within a year enormous CO2 flows are going in and out of the atmosphere, near completely independent of how much CO2 is in the atmosphere and that only a very small part is CO2 pressure related at the end of the year…
Here a first overview (but still far from exact):
https://www.ferdinand-engelbeen.be/klimaat/klim_img/seasonal_flows.png
The net result at Mauna Loa for the same year (2021):
https://www.ferdinand-engelbeen.be/klimaat/klim_img/seasonal_flows_mlo.png
“Somehow the natural sinks know how much humans will put in and adjust to get half of it out even when the human sources are growing.”
The natural sinks only react on the total extra CO2 in the atmosphere, not on the injection of one year. That it is around half human emissions is the result of the linear increasing FF emissions: that leads to a slightly quadratic increase in the atmosphere, a resulting slightly quadratic increase in net uptake and thus a quite constant ratio between emissions and uptake.
If human emissions halved, there wouldn’t be any increase in the atmosphere anymore…
“Further the complicated processes and poor measurements make statistical analysis of the data that show no correlation of rate of change of human emissions to rate of change of atmospheric content for periods up to 5 years inaccurate even though the author of these statistics doesn’t think that is the case.”
For that point, the problem is not in the processes or measurements, but in the fact that two separate independent variables both influence the increase of CO2 in the atmosphere:
One has a huge trend and hardly any variability.
The other has a huge variability and hardly any trend.
That caused a huge trend with a lot of variability in the dependent variable.
Any type of program that uses variability as a method to separate the influence of both independent variables on the dependent variable is doomed to fail… Especially of one de-trend the variables, thus effectively removing the cause of the trend of the dependent variable…
Ferdinand Engelbeen
August 5, 2025 at 3:05 am
“Te “may” be equal to the turnover time, if (and only if!) all inflows are unidirectional into the reservoir and to the outflows.”
That’s the Unidirectional Rule corollary that remains to be proven and has already been discredited by my one-compartment model with inputs originating from the same reservoirs which constitute the outputs. Those outputs are not largely independent of the amounts in the atmosphere as has been demonstrated experimentally by the CO2 Coalition. Please identify the cases of circulating flows and processes and verify they are independent of the CO2 pressure in the atmosphere. Notice that inputs are not necessarily concentration dependent. And consider this: which generates more natural emissions, a biosphere with a given amount of decomposing vegetation or a biosphere with 50 % more decomposing vegetation?
“Sorry, but one can calculate Tau independent of the FF emissions: the change of total CO2 in the atmosphere is what leads to the change in net absorption of CO2, no matter if FF emissions are one-shot, fixed or in/decreasing over time.”
That is a variation of the Fnet Axiom which emanates from the correlation between net uptake and growth in atmospheric CO2 concentration. The correlation gives rise to a model that produces a Tau associated with a presumed decay that has never happened and likely never will.
“Any bookkeeper” will also admit that taxes put some people in the red despite their incomes exceeding their expenses.
“Te does NOT equal the residence time, thus the calculation of F(net) by a Te of 4 years has no physical basis.” I thought we agreed not to conflate Te and Tau. Te is residence time which equals turnover time. Tau is an adjustment time for a hypothetical scenario of a decay in CO2 which likely will never happen. Claiming otherwise is argument by assertion. Where is the logical derivation of a model that supports your assertion?
“And one can calculate Tau out of the observed change in C and the observed change in F(net), without knowing Co.” That is the corollary to the Fnet Axiom, “If (and only if) the net output is in exact ratio to the change in disturbance, it doesn’t matter over what time frame Tau is calculated, even if the equilibrium is not known at all.”
Once again from Tom Wigley, “It is, of course, quite possible to produce highly simplified (or ‘reduced-form’) versions of these models; but the original ‘first principles’ model must always be better and more credible than the simpler model. The real strength of first principles models is that they do not have free parameters that can be arbitrarily tuned to match observations.”
The first principles one-compartment bidirectional four-year e-time model obviates Unidirectional Rules, Fnet Axioms, and the Natural Flux Theorem to account for the observed increase in atmospheric CO2.
“Finally, we have the Natural Flux Theorem [postulated July 6, 2025 at 10:23 am]: “There is indeed one and only one possibility that the natural fluxes are the cause of the increase in the atmosphere: if, and only if, they increased in exact the same ratio as the human emissions.” This also remains unproven.”
Ferdinand,
So, what are the before and after ratios of human emissions and natural emissions that would support this theorem?
Ferdinand Engelbeen July 29, 2025 at 4:23 am AND
To everything Ferdinand has written in these comments.
Finally, I see the fundamental difference between what Ferdinand, Burton, Lindzen, Spencer, Etc, Etc, are saying versus what I am saying.
Tau will never be the same as Te because thet are completely different concepts.
…….. Outflow = Level / Te …………….. (2)
Te and (2) describe a physical process.
…….. Tau = disturbance / effect
Tau is a curve fit to historical data.
Te and Tau will never be the same thing even if, at times, their values happen to be the same. They are fundamentally different concepts.
The Tau boys and girls are trying to curve fit historical data.
The Te boys and girls are doing the physics that produces and explains the historical and future data.
Never the twain’s shall meet, as they say.
I admit, in all my years of physics, I have never come across anyone, until now, who does not understand that physics is a subject that attempts to explain why things happen. I have always done physics with people who understand physics, until now.
But now, I am dealing with CO2 Coalition people who, frankly, don’t have a clue about how physics works.
So, I have been clearly wrong. The CO2 Coalition boys and girls are freaking physics deprived.
They are so physics deprived that they cannot understand my equations (1) and (2). They don’t get that these equations describe how the carbon cycle works.
Ferdinand claimed (way back in these comments) that I changed my method related to Te.
So, I looked back at my 2019 paper and found that it uses the same (1) and (2) and its derivations as all my later papers. I haven’t changed anything fundamental in my model. I have explained it better in my subsequent papers, but I have not changed my fundamental model and its derivation.
In conclusion, everyone who wants to follow physics can and should reject EVERTHING that Ferdinand has preached in these comments. Ferdinand and his CO2 Coalition are in an entirely different universe that does not understand how to use physics to explain how the carbon cycle works.
To David Andrews and all,
Many comments ago, David Andrews asked me: Why do I not partition my description of the Delta14C data into 12CO2 and 14CO2?
This is a very good question and here is my answer. My Figures 9 and 10 are relevant to this explanation.
Delta14C is about 14CO2 and its connection to 12CO2. The fact that Delta14C remains near zero (really 1000 before they subtracted 1000) has allowed carbon dating.
The constancy of Delta14C even as 12CO2 has gone up and down, indicates the inflow of natural carbon into the atmosphere has a constant ratio of 14C/12C.
So, imagine that this inflow is a like a river. The bomb tests added 14CO2 and this increases Delta14C by almost 70%. Then the bomb tests stopped.
This set up a perfect experiment where 14CO2 was way above its natural balance level set by the natural inflow of 14CO2.
After 1970, Delta14C data show the 14CO2 level approached its natural balance level, defined by Delta14C = zero, exactly following equation (2) Outflow = Level / Te, with a constant Te of 16.5 years.
This happened while 12CO2 was increasing but the same thing would have happened if 12CO2 had remained constant. 14CO2 did not return to ITS original value. 14CO2 returned to Delta14C = zero. My model perfectly explains how this happened.
Therefore, 16.5 years is not only the Te for Delta14C, 16.5 years is also the Te for 14CO2 because 14CO2 caused all the change in Delta14C.
This corrects my previous papers that say the Te for 14CO2 was 10 years. I now see that it is much simpler.
This also makes 16.5 years the upper limit for the Te for 12CO2. Everyone knows that 12C flows through the carbon cycle faster than 14C because 12C is lighter. Maybe no one knows how much faster.
This certainly means the outflows of CO2 cannot ever be 50 years. (We now understand this from my previous comment that explains that Tau is not related to equation (2), but it only a useless curve fit to data.)
There are many papers that indicate the Te of 12CO2 is less than 6 years. The IPCC says the Te of 12CO2 is about 4 years, and IPCC’s data for its natural carbon cycle show this Te is about 3.5 years.
In conclusion, Delta14C was a once-in-a-lifetime experiment that allows us to measure the Te for 14CO2, and this sets an upper limit on the Te for 12CO2.
Delta14C also fully explains why the 14CO2 level has increased since 1950. It increased because the natural inflow or 12CO2 increased while keeping Delta14C equal to zero.
ADMIN NOTE: When we post a comment, this comment list reverts back to previous comments rather than returning to the last comment. To get back, we must click the Newer Comments link. I cannot control this.
Dr. Ed, August 4, 2025 at 12:28 pm
“The Te is NOT 4 years for 14CO2. Do you see the “14” in Delta14C?”
If all CO2 is equal, then the removal rate of 14CO2 should be equal to that of 12CO2 and 13CO2, with maximum a few % change in isotopic ratio. Not an order of magnitude…
For 14CO2 even faster, due to the supply of 14C-free FF CO2.
“You are wrong because I define Te = Level / Outflow …… (2)
That causes a lot of confusion… The “e” in Te is normally used as the e-fold decay rate of some extra injection of CO2 in the atmosphere. Either had used TT (turnover time) or RT (residence time) and things were clear.
And you are using Te as residence time for the bulk of CO2, but Te as decay rate for 14CO2, So which definition did you use for Te for what variable?
“The definition (2) does not say anything about a single CO2 molecule. It says “level” divided by “outflow.” Which obviously does not refer to a single molecule. “
If 25% of all CO2 each year flows out of the atmosphere, then there is a 25% possibility that any individual CO2 molecule flows out of the atmosphere. Thus your Te of 4 years is the residence time of any single CO2 molecule in the atmosphere.
“Furthermore, your implication that (2) is a “one-way process” is further BS. In (2), we need to know only two of the variables to calculate the third variable.”
Which only has some physical meaning if there are no direct returns or processes that are independent of the CO2 level in the atmosphere…
The formula Te = Level / Outflow only calculates the overall Te, no matter if the cause of the outflow is the level in the atmosphere or completely independent of the level in the atmosphere…
In the case of the outflow from atmosphere to vegetation in spring/summer, the outflow (already over half the total outflow) is near completely independent of the CO2 level in the atmosphere and mainly caused by temperature and sunlight.
Thus I am very curious to see your calculation of the outflow from the atmosphere into vegetation, based on your formula outflow = level/Te.
“I reply, your calculation that “shows Te/Tau of 50 years” is not a valid calculation. Your calculation is not based on physics. You have not presented anywhere any valid calculation that Te/Tau is 50 years.”
As far as I have learned a long time ago, an exponential decay rate is calculated as the removal rate of a deviation in a process, caused by the distance to an equilibrium of that process to reach 1/e of the original deviation. No matter if the deviation is positive or negative or the equilibrium is 295 ppmv or zero ppmv…
That is what Wiki shows as exponential decay rate:
https://en.wikipedia.org/wiki/Exponential_decay
If you have a different definition, then I like to see that…
And with the 50 year decay rate we can predict the future CO2 level without problems, as far as human emissions increase linear as they do today: a slightly quadratic increase in the atmosphere at about half total human emissions over time.
“Where’s your data? There are no measurements that can tell the difference between human-caused 12CO2 and natural-caused 12CO2.”
There is no difference between 12CO2 from FF and 12CO2 from natural sources, but there is a difference in 13C/12C ratio between these two:
Over the past 800,000 years the atmosphere in equilibrium with the oceans had a δ13C ratio of -6.5 +/- 0.4 per mil, until about 1850. After that there is an enormous drop to below -8 per mil δ13C, caused by FF emissions and not by decaying vegetation, as vegetation increased over time, thus increasing the 13C/12C ratio of the atmosphere.
Here for the LGM up to today in three parts:
https://www.ferdinand-engelbeen.be/klimaat/klim_img/co2_d13C_lgm_cur.png
Over the past 600 years: 10% in the atmosphere, 6% In the ocean surface, based on the drop in δ13C
https://www.ferdinand-engelbeen.be/klimaat/klim_img/sponges.gif
“(2) explains the return of Delta14C to its original level of zero and the small drop below zero caused by human 12CO2 emissions.”
Except that Te for 12CO2 is 4 years and for 14CO2 it is 16 years, while they should be equal…
“(2) can replicate IPCC’s equilibrium at 280 ppm without any need for a Tau of 50 years.”
With a Te (as decay rate) of 4 years the equilibrium does not return to 280 ppmv from 425 ppmv. It does return to a much higher level, as also Jim Siverly assumes.
David Andrew, August 4, 2025 at 8:23 pm
Interesting read that 14C increases as absolute amount in the atmosphere, despite a drop in ratio…
Ultimately that will drop when the two “fast” reservoirs, ocean surface and vegetation, in equilibrium with the atmosphere will drop their 14C content together into the deep oceans (no matter in what way that happens).
But I don’t think that Dr. Ed or Jim do see what that implies for the isotopic ratio’s in the atmosphere…
Ferdinand Engelbeen August 6, 2025 at 5:01 am
Dear Ferdinand,
Once again, you misinterpret the data, when you write, “Interesting read that 14C increases as absolute amount in the atmosphere, despite a drop in ratio…”.
As I clearly wrote, it is NATURAL 14C that follows NATURAL 12C based on the fact that Delta14C stayed at zero even as 12C in the atmosphere increased.
This helps us distinguish between natural and human CO2 in the atmosphere.
Dr. Ed, August 6, 2025 at 2:22 am
“Finally, I see the fundamental difference between what Ferdinand, Burton, Lindzen, Spencer, Etc, Etc, are saying versus what I am saying.”
“Tau will never be the same as Te because that are completely different concepts.”
That is what we were trying to say all the time…
“…….. Outflow = Level / Te …………….. (2)
Te and (2) describe a physical process.”
Te = Level / Output is a physical process, no matter if the Output is caused by Level or by any other process, independent of Level… Thus if only one process (like the output into vegetation) works largely independent of the CO2 level in the atmosphere, you can’t calculate the outflow, because Te is not the real Te for that process…
“…….. Tau = disturbance / effect
Tau is a curve fit to historical data.”
That is an absolutely false accusation. Tau is mostly calculated from the observed distance to the historical equilibrium, but also can be calculated from any time period where the change in disturbance and change in effect is known, without knowing the historical equilibrium. In both cases Tau is around 50 years. That has zero, nothing to do with curve fitting. See:
https://www.ferdinand-engelbeen.be/klimaat/klim_img/acc_decay.jpg
The increase in the atmosphere is measured in the upper graph, the increase of the pCO2 of the oceans since 1850 is calculated with the formula of Takahashi and the difference between these two is used as “disturbance”.
In the second graph, the observed “effect” as result of the increase of CO2 in the atmosphere is plotted together with the polynomial to avoid the (huge) influence of temperature variability in the result.
The lower graph is the resulting Tau, based on the polynomial.
So, where is the “fit” to historical data? In the use of the calculated SST pCO2? We can calculate the same Tau from the difference between 2020 and 1960 for both the increase in the atmosphere and the increase in uptake, without looking at the calculated sea surface pCO2…
With back-calculation from these graphs, one even can find the current equilibrium, which is between 280 and 300 ppmv.
“So, I have been clearly wrong. The CO2 Coalition boys and girls are freaking physics deprived.”
Wow. Only Dr. Ed knows what physics is. All these boys and girls that don’t follow the reasoning of Dr. Ed are physics deprived. Including Dipl.Ing Dietze, Lindzen, Spencer, and many, many, many others, including myself…
Sad, very sad if one needs to accuse others of not knowing physics as an excuse to poison the discussion.
Dr. Ed and others,
I am working on a one-compartment bidirectional model to describe the dispensation of 14C in the atmosphere. It will include inputs from N2 production and the combined reservoirs. The output will just be from a single removal rate constant analogous to 12C. Are there any other inputs to be considered? Would we expect a different input rate from land versus ocean?
Ferdinand Engelbeen August 6, 2025 at 7:01 am
You wrote:
All CO2 is NOT equal because a 14C atom is heavier than a 12 atom. Your use of “removal rate” is unphysical. The “supply of 14C-free FF CO2” is part of the Natural 14C level in (2).
You wrote:
Ferdinand, I am the guy who defined Te, so don’t tell me how it is “normally used.”
I defined it in my equation (2). I called it “e-time.” Later, when I found IPCC’s definition of Turnover Time, I wrote that Te was the same as IPCC’s Turnover time. But since IPCC’s turnover time is confused with residence time, etc., I kept my definition of Te very clear.
(Please see where I have copied IPCC’s definitions of Lifetime above these comments, so you don’t confuse what the IPCC says about the times.)
You prove my point when you wrote:
Everything you write confuses things because you do not follow even IPCC’s definitions of the various Lifetimes.
Equation (2) is Outflow = Level / Te
Te is clearly defined in (2). Te applies to the carbon that is in the respective Level, and it only applies to outflows, not inflows.
Yet, in the case of IPCC’s natural carbon cycle at equilibrium, I can validly calculate the Te for each outflow node by reversing (2) to get Te = Level / Outflow.
This gives me the six Te that apply to IPCC’s natural carbon cycle at equilibrium.
These Te apply to human carbon also because it is identical to natural carbon.
With these Te, I can (and did) calculate the true effect of human carbon on the carbon cycle without confusion with natural carbon.
You wrote:
NO. Your claim is incorrect.
You wrote:
You are trying to curve-fit the data. That is unphysical. Nature is not as complicated as you make it out to be. Equation (2) is based on first principles. Good engineers and scientists who understand models have applied (2) to virtually everything in nature.
I don’t need to justify my use of (2). I defined (2) as a hypothesis. That makes (2) falsifiable by proving it makes a false prediction. This is the way science works.
(2) correctly predicts the return of 14CO2 to its natural balance level. That is a remarkable achievement.
(2) correctly replicates IPCC’s natural carbon cycle data at equilibrium.
(2) correctly predicts any modification of IPCC’s data for its natural carbon cycle.
(2) correctly predicts chemical reactions in pharmacological models.
(2) is the basis of electrical circuit theory and Ohm’s Law.
(2) is the basis of systems engineering itself.
(2) is the basis of Markov Chains.
You wrote:
Sorry, you learned incorrectly.
Thank you for your reference to the WIKI article in Exponential Decay.
I am totally surprised that you do not understand that my Te, Level, and Outflow in (2) are exactly what the WIKI article calls
• Te = Tau = 1 / Lamda = Mean Lifetime
• Level = N(t)
• Outflow = – dN(t)/dt
The WIKI article justifies my carbon cycle model equations (1) and (2), and all its derivations.
I am also surprised that you do not immediately recognize that this WiKI article shows that everything in your model and extensive explanations are WRONG. The WIKI article does not try to curve fit data like you do. Its Tau is NOT your Tau.
Ferdinand, this WIKI article proves that your criticisms of my model are entirely wrong.
I used these concepts in my 1965 PhD thesis, which real physicists still widely cite today as one of the important breakthroughs in climate science.
Yet, you and other unethical members of the CO2 Coalition have censored, trashed, and blacklisted my carbon cycle model because its prediction conflicts with the Coalitions business mantra that claims human CO2 emissions have saved the planet.
I won the People’s Choice Award at the 1993 Microsoft Windows World Open software contest for my model that modeled human body physiological responses to changing weather and environmental conditions, which was the first time anyone used a computer model in a murder trial. My model successfully defended the accused.
As your kindly-referenced WIKI shows, my carbon cycle model based on (1) and (2), uses the same formulation as the following:
Natural sciences
• Chemical reactions: The rates of certain types of chemical reactions depend on the concentration of one or another reactant. Reactions whose rate depends only on the concentration of one reactant (known as first-order reactions) consequently follow exponential decay. For instance, many enzyme-catalyzed reactions behave this way.
• Electrostatics: In a RC circuit, the electric charge (or, equivalently, the potential) contained in a capacitor (capacitance C) discharges through a constant external load (resistance R) with exponential decay and similarly charges with the mirror image of exponential decay (when the capacitor is charged from a constant voltage source though a constant resistance). The exponential time-constant for the process is so the half-life is. The same equations can be applied to the dual of current in an inductor.
• Furthermore, the particular case of a capacitor or inductor changing through several parallel resistors makes an interesting example of multiple decay processes, with each resistor representing a separate process. In fact, the expression for the equivalent resistance of two resistors in parallel mirrors the equation for the half-life with two decay processes.
• Geophysics: Atmospheric pressure decreases approximately exponentially with increasing height above sea level, at a rate of about 12% per 1000m.
• Heat transfer: If an object at one temperature is exposed to a medium of another temperature, the temperature difference between the object and the medium follows exponential decay (in the limit of slow processes; equivalent to “good” heat conduction inside the object, so that its temperature remains relatively uniform through its volume). See also Newton’s law of cooling.
• Luminescence: After excitation, the emission intensity – which is proportional to the number of excited atoms or molecules – of a luminescent material decays exponentially. Depending on the number of mechanisms involved, the decay can be mono- or multi-exponential.
• Pharmacology and toxicology: It is found that many administered substances are distributed and metabolized (see clearance) according to exponential decay patterns. The biological half-lives “alpha half-life” and “beta half-life” of a substance measure how quickly a substance is distributed and eliminated.
• Physical optics: The intensity of electromagnetic radiation such as light or X-rays or gamma rays in an absorbent medium, follows an exponential decrease with distance into the absorbing medium. This is known as the Beer-Lambert law.
• Radioactivity: In a sample of a radionuclide that undergoes radioactive decay to a different state, the number of atoms in the original state follows exponential decay as long as the remaining number of atoms is large. The decay product is termed a radiogenic nuclide.
• Thermoelectricity: The decline in resistance of a Negative Temperature Coefficient Thermistor as temperature is increased.
• Vibrations: Some vibrations may decay exponentially; this characteristic is often found in damped mechanical oscillators, and used in creating ADSR envelopes in synthesizers. An overdamped system will simply return to equilibrium via an exponential decay.
• Beer froth: Arnd Leike, of the Ludwig Maximilian University of Munich, won an Ig Nobel Prize for demonstrating that beer froth obeys the law of exponential decay.
Social sciences
• Finance: a retirement fund will decay exponentially being subject to discrete payout amounts, usually monthly, and an input subject to a continuous interest rate. A differential equation dA/dt = input − output can be written and solved to find the time to reach any amount A, remaining in the fund.
• In simple glottochronology, the (debatable) assumption of a constant decay rate in languages allows one to estimate the age of single languages.
• The core routing protocol on the Internet, BGP, has to maintain a routing table in order to remember the paths a packet can be deviated to.
You wrote:
No, you can’t. You don’t even have a model that can predict. Curve fit predictions are not physical models
You wrote:
Yes, there is an isotopic difference between human and natural CO2, both in 13C and 14C. We already discussed these things, and I showed these differences indicate the amount of human CO2 in the atmosphere is nowhere near 33%. The details are a separate subject than the subject here.
You wrote:
No, they should not be equal. You do not understand this.
Dr. Ed, August 6, 2025 at 3:20 am
“This also makes 16.5 years the upper limit for the Te for 12CO2. Everyone knows that 12C flows through the carbon cycle faster than 14C because 12C is lighter. Maybe no one knows how much faster.”
The isotopic ratio changes somewhat, that can be calculated from the difference in molecular weight, similar to 13CO2, but twice as much.
For a discrimination of about 0.8% in δ13C for 13CO2, compared to 12CO2 flows between the atmosphere and the oceans (bidirectional), that would give a discrimination of around 1.6% between 14CO2 and 12CO2.
No big deal at all and far from the difference between 3.5 years for Te of the bulk 12/13CO2 and 16.5 years for 14CO2.
Can you explain that difference?
And you forget the dilution by the 14C-free CO2 from the use of fossil fuels and the return of “normal” 14CO2 of pre-industrial times from other reservoirs… That makes that the 16.5 years is a minimum limit, not a maximum limit…
About the introduction:
“When the level is far from its balance level (which can be zero), IPCC thinks e-time is an adjustment time because the level is moving rapidly toward its balance level.
When the level is close to its balance level, IPCC thinks e-time is a residence time because “molecules” are flowing in and out with little change in level.”
It is not my task to defend the IPCC and I do disagree with them on many items, including the “long” Tau’s based on the saturation of the different reservoirs, but please, don’t accuse them of points they didn’t say or implied.
The IPCC (and we) make a differentiation between T (turnover time) and Ta (adjustment time or Tau) and only the latter is what influences the decay of 12/13/14CO2 back to equilibrium, whatever that may be, according to the IPCC (and us). T (your Te) plays no role at all for the IPCC (and us)…
Stephen Paul Anderson
August 5, 2025 at 9:38 am
“Finally, we have the Natural Flux Theorem [postulated July 6, 2025 at 10:23 am]: “There is indeed one and only one possibility that the natural fluxes are the cause of the increase in the atmosphere: if, and only if, they increased in exact the same ratio as the human emissions.” This also remains unproven.”
Ferdinand,
So, what are the before and after ratios of human emissions and natural emissions that would support this theorem?
In theory:
Human emissions increased about a five fold between 1960 and 2020. If the natural emissions also increased a five fold over the same time span, then for the same processes that absorb natural and fossil CO2 alike, the increase in CO2 of the atmosphere would be caused by both in ratio to the inputs. Thus far more from natural than from FF.
In reality:
There is hardly any increase in natural emissions: +33% between oceans and atmosphere and a meager 12% between vegetation and atmosphere. Not 500% for both together.
Te even slightly increased, as the increase in mass was higher than the increase in outflows…
In addition to clear up the difference between T/Te (turnover/residence time) and Ta/Tau (adjustment time), here a few graphs to show the difference in flows that cause both. The global seasonal flows graph still needs in part real figures, but the underlying difference is hopefully clear…
Global seasonal flows:
https://www.ferdinand-engelbeen.be/klimaat/klim_img/seasonal_flows_b.png
Both the seasonal outputs into oceans and vegetation are the origin of the 4 years Te, but none of the seasonal flows is dependent of the CO2 level in the atmosphere, except for a small part in the next graph.
Seasonal flows at Mauna Loa:
https://www.ferdinand-engelbeen.be/klimaat/klim_img/seasonal_flows_mlo_b.png
The small net removal rate is what makes the 50 year Ta/Tau
Ferdinand Engelbeen August 6, 2025 at 7:38 am
Dear Ferdinand,
I wrote, “This also makes 16.5 years the upper limit for the Te for 12CO2. Everyone knows that 12C flows through the carbon cycle faster than 14C because 12C is lighter. Maybe no one knows how much faster.”
You wrote, “The isotopic ratio changes somewhat, that can be calculated from the difference in molecular weight, similar to 13CO2, but twice as much.
“For a discrimination of about 0.8% in δ13C for 13CO2, compared to 12CO2 flows between the atmosphere and the oceans (bidirectional), that would give a discrimination of around 1.6% between 14CO2 and 12CO2.
“No big deal at all and far from the difference between 3.5 years for Te of the bulk 12/13CO2 and 16.5 years for 14CO2.
“Can you explain that difference?”
No. I am only talking about the data. At the moment, I cannot explain the reason the data show a large difference between the Te for 14CO2 and 12CO2.
You wrote, “And you forget the dilution by the 14C-free CO2 from the use of fossil fuels and the return of “normal” 14CO2 of pre-industrial times from other reservoirs… That makes that the 16.5 years is a minimum limit, not a maximum limit…”
I totally disagree with your claim. My method of calculating properly accounts for such “dilution” because I separate the human carbon cycle from the natural carbon cycle. Your method puts human and natural CO2 into the same pot and produces confusion. All your conclusions based on your inaccurate physics are wrong.
Dr. Ed, August 6, 2025 at 7:29 am
“I don’t need to justify my use of (2). I defined (2) as a hypothesis. That makes (2) falsifiable by proving it makes a false prediction. This is the way science works.”
Well here are already two items which falsify your hypothesis:
With output = level / Te for the output in vegetation:
1960:
Te(a-g) = 589 PgC / 108 PgC/year = 5.45 year
Output = level / Te:
Output = 589 PgC / 5.45 year = 108 PgC/year
2010 (IPCC in figures 2/3):
Output = 829 PgC / 5.45 year = 152 PgC/year
In reality, the total outflow increased to 122 PgC/year
Thus your Te(a-g) is completely at odds with reality.
Then, again, the difference in Te for 12/13CO2 and 14CO2.
If all CO2 is equal, except for a small (less than 2%) difference in dissolution speed, then an extra injection of 70% 12CO2 would need about exact the same Te as for a 70% extra 14CO2 injection. Not a difference of an order of magnitude…
If one separates the natural and human flows in my previous comment, that makes it not better:
For 2010:
Output(human): 240 PgC / 5.45 year = 44 PgC/year
In reality: 14 PgC/year… a factor 3.5.
Ferdinand Engelbeen August 6, 2025 at 7:50 am
The IPCC (above) explained its definitions of adjustment and residence times, as follows:
“When the level is far from its balance level (which can be zero), IPCC thinks e-time is an adjustment time because the level is moving rapidly toward its balance level.
“When the level is close to its balance level, IPCC thinks e-time is a residence time because “molecules” are flowing in and out with little change in level.”
You wrote that you disagree with the IPCC on many items. No problemo. But we must follow IPCC’s definitions of the terms we use. Otherwise, we produce confusion. You produce confusion when your definitions conflict with IPCC’s definitions.
You wrote that your Tau is an adjustment time that “influences the decay of 12/13/14CO2 back to equilibrium.” and that Te plays no role at all for you or the IPCC.
The IPCC (above) says, “In simple cases, where the global removal of the compound is directly proportional to the total mass of the reservoir, the adjustment time equals the turnover time: T = Ta” … which is also Te.
So, you and your CO2 Coalition buddies are totally confused about how to use Te and Tau and Ta.
Ferdinand, I find your pathetic claims to be junk physics and delusional. You and your buddies are way outside the boundaries of rational scientific discussions. You can’t even get the basics correct.
Whereas my Te and all my calculation agree with the WIKI reference you kindly produced.
Ferdinand Engelbeen August 6, 2025 at 7:01 am
Dr. Ed, August 6, 2025 at 2:22 am
I wrote, “Finally, I see the fundamental difference between what Ferdinand, Burton, Lindzen, Spencer, Etc, Etc, are saying versus what I am saying.”
“Tau will never be the same as Te because that are completely different concepts.”
You wrote, “That is what we were trying to say all the time…” This remark proves you are using junk physics.
Your Tau totally conflicts with WIKI and my Te totally conforms with WIKI.
Doesn’t that ring a bell for you?
You wrote, “Thus if only one process (like the output into vegetation) works largely independent of the CO2 level in the atmosphere, you can’t calculate the outflow, because Te is not the real Te for that process…”
You fail to understand that Te is a first principle that helps explain the data, and that your Tau is an attempt to curve fit data that you THINK Te cannot explain when you don’t even know how to calculate the results of Te.
I wrote “Tau is an attempt to curve fit historical data.”
You wrote, “That is an absolutely false accusation. Tau is mostly calculated from the observed distance to the historical equilibrium but also can be calculated from any time period where the change in disturbance and change in effect is known, without knowing the historical equilibrium. In both cases Tau is around 50 years. That has zero, nothing to do with curve fitting.”
Your Tau has everything to do with curve fitting and nothing to do with physical processes.
You don’t have any equations of carbon flow. You have only Tau, and you think it applies to a 50-year change of carbon levels.
You ignore Te that fully describes these 50-year changes in terms of annual or shorter changes. You think you can apply an overall Tau that describes a 50-year change.
Either you do not understand physics, or you are delusional, or both.
You write, “The … difference … is used as “disturbance” and the “observed “effect” of the increase of CO2 in the atmosphere produces your Tau… based on the polynomial.
You ask, “So, where is the “fit” to historical data?”
It’s right in front of your eyes!
You write, “With back-calculation … (you) can find the current equilibrium, which is between 280 and 300 ppmv.”
You can’t back calculate a process that is moving to its equilibrium because all initial conditions are moving to the same equilibrium.
You wrote, “Wow. Only Dr. Ed knows what physics is. All these boys and girls that don’t follow the reasoning of Dr. Ed are physics deprived. Including Dipl.Ing Dietze, Lindzen, Spencer, and many, many, many others, including myself…
Sad, very sad if one needs to accuse others of not knowing physics as an excuse to poison the discussion.”
Yes, indeed, it is sad that the CO2 Coalition scientists do not recognize their incompetence in this area of physics.
You don’t get it that consensus is not a valid argument in science. Your mistake and the CO2 Coalition’s mistake is to think they know everything about carbon flow and carbon cycle models when they have no expertise in this area.
Your own WIKI reference proves your incompetence in this area.
Worse, you and they do not have the honesty to admit that you and they are wrong on this subject. Rather you and they march off like energizer bunnies beating your own drums, censoring and blacklisting good science that you do not understand.
Your and their behavior is indeed pathetic. When CO2 Coalition scientists claim your special report is valid science, they are not being scientists because they reject the honesty and ethics that must accompany science.
This discussion of your Coalition report has exposed your and their junk science. It’s time for you and the CO2 Coalition to admit you have made a gigantic error in your belief about how the carbon cycle works.
Ferdinand Engelbeen
August 6, 2025 at 9:42 am and August 6, 2025 at 9:53 am
Dr. Ed, August 6, 2025 at 7:29 am
“Well, here are already two items which falsify your hypothesis:…”
Sorry, your calculations are wrong, so your conclusions are wrong.
Dr. Ed, August 6, 2025 at 10:02 am
“When the level is far from its balance level (which can be zero), IPCC thinks e-time is an adjustment time because the level is moving rapidly toward its balance level.
“When the level is close to its balance level, IPCC thinks e-time is a residence time because “molecules” are flowing in and out with little change in level.”
That is your just the opposite in interpretation of what the IPCC says…
The IPCC expects a fast e-time at high level differences and extreme long e-times for the last removals, but none of them are residence times. The overall turnover/residence time of 4 years nowhere is mentioned in the different e-times:
https://wattsupwiththat.com/2013/12/02/is-the-bern-model-non-physical/
They explicitly write:
“In simple cases, where the global removal of the compound is directly proportional to the total mass of the reservoir, the adjustment time equals the turnover time: T = Ta… …In more complicated cases, where several reservoirs are involved or where the removal is not proportional to the total mass, the equality T = Ta no longer holds.
Carbon dioxide (CO2) is an extreme example. Its turnover time is only about 4 years because of the rapid exchange between the atmosphere and the ocean and terrestrial biota. However, a large part of that CO2 is returned to the atmosphere within a few years.”
https://www.ipcc.ch/report/ar6/wg1/downloads/report/IPCC_AR6_WGI_AnnexVII.pdf
They explicitly reject the equality of your 4 year T/Te with the real Ta’s/Tau’s of between some 3 years and hundreds of years and much longer as they assume. Their Ta/Tau is composed of different Ta’s for different reservoirs, but the fastest: the ocean surface is already saturated at 10% of the change in the atmosphere (and that is a real one…), thus while faster than 4 years, it stops already at 0.5 PgC/year for a change in the atmosphere of 5 PgC/year.
Dr. Ed, August 6, 2025 at 11:04 am
“Well, here are already two items which falsify your hypothesis:…”
“Sorry, your calculations are wrong, so your conclusions are wrong.”
If you don’t show where I am wrong, you can’t conclude that I am wrong…
Ed,
I must laugh at your bizarre claim that 14CO2 has returned to its “balance level.” Figs 1 and 2 in https://www.cambridge.org/core/services/aop-cambridge-core/content/view/193CDF1F705B269BC975AF178CEF1AC3/S0033822224000274a.pdf/discussion-presentation-of-atmospheric-14co2-data.pdf show the following 14CO2 concentrations, where the units are attomoles of 14CO2 per moles of atmospheric gas. (1 attomole = 10-18 moles)
– from 1900 to 1950 the 14C02 concentration grew from ~360 to 370
– the nuclear testing raised it to a peak of over 650 around 1965
– it fell to a plateau a little under 500 after 1990
– it is presently around 510 and rising
This history hardly describes “returning to a “balance level”. There is no mystery in any of this behavior. It is completely understood by mainstream science, and the rise in the 21st century was predicted in 1998 by a group at Lawrence Livermore labs https://agupubs.onlinelibrary.wiley.com/doi/abs/10.1029/1998GL900010
To understand it you need to understand disequilibrium isotope fluxes which I have explained before. I know you avoid that concept because it also explains why you have been wasting your time calculating the quantity of “human carbon” in the present atmosphere.
Dr. Ed, August 6, 2025 at 10:59 am
Sorry Dr. Ed, but this discussion leads to nothing…
We used the definition of Ta/Tau as used by the IPCC and Wiki and everybody that uses exponential decay in the world. The only difference between you and many other engineers and scientists is the use of the around 4 years turnover / residence time instead of the calculated (from observations) real Ta of around 50 years.
The 4 years turnover/residence time is explicitly rejected by the IPCC as irrelevant for the calculation of the decay rates of any extra CO2 injection in the atmosphere. It is implicitly rejected by Dietze, Lindzen, Spencer and may other skeptics of the alarmist side of “catastrophic” global warming, which use the past equilibrium or current decay rate calculations for their excess CO2 decay out of the atmosphere.
Your 4 years Te is completely bogus, because it is based on outputs that are largely independent of the CO2 level in the atmosphere, thus any decay rate based on current or past levels and outputs has nothing to do with the real decay rates as can be observed/calculated.
That is (probably) my last word here, as I have better and more urgent things to do than trying to convince people that don’t want to be convinced and “forget” to mention the most relevant points of what others, like the IPCC, say to have their point…
Ferdinand,
Do you agree that Natural Emissions are about 100ppmv?
David,
“I must laugh at your bizarre claim that 14CO2 has returned to its “balance level.” Figs 1 and 2 in https://www.cambridge.org/core/services/aop-cambridge-core/content/view/193CDF1F705B269BC975AF178CEF1AC3/S0033822224000274a.pdf/discussion-presentation-of-atmospheric-14co2-data.pdf show the following 14CO2 concentrations, where the units are attomoles of 14CO2 per moles of atmospheric gas. (1 attomole = 10-18 moles)
– from 1900 to 1950 the 14C02 concentration grew from ~360 to 370
– the nuclear testing raised it to a peak of over 650 around 1965
– it fell to a plateau a little under 500 after 1990
– it is presently around 510 and rising
This history hardly describes “returning to a “balance level”. There is no mystery in any of this behavior. It is completely understood by mainstream science, and the rise in the 21st century was predicted in 1998 by a group at Lawrence Livermore labs https://agupubs.onlinelibrary.wiley.com/doi/abs/10.1029/1998GL900010
To understand it you need to understand disequilibrium isotope fluxes which I have explained before. I know you avoid that concept because it also explains why you have been wasting your time calculating the quantity of “human carbon” in the present atmosphere.”….
Do you even understand balance level? Balance level is (inflow)(Te)=Lb. That is true for 12C, 13C and 14C. It has nothing to do with disequilibrium isotope fluxes.
Ferdinand Engelbeen
August 6, 2025 at 12:48 pm
“Sorry Dr. Ed, but this discussion leads to nothing…”
“That is (probably) my last word here”
Dear Ferdinand,
In case you hang in here long enough to read this comment, I apologize for responding pejoratively to some of your arguments. However, I don’t apologize for my criticisms which I think were largely accurate, but perhaps I could have been more polite.
I hope you will consider a few points to help you make arguments in the future. You repeatedly made assertions here without backing them up, particularly regarding our requests for the physical principles underlying the development of a model. I am still not clear on your claim to have calculated Tau independent of historical equilibrium. The fact that it requires using a correlation and calculating Tau based on a polynomial fit is problematic. Your use of anecdotal data, such as calculating a Te from Level/Output in 1960 and contrasting it with 2010, is troubling.
The most egregious flaw in your presentation is to claim output to vegetation is not concentration dependent. Again, the CO2 Coalition’s tree growth “experiment” is an example. Growth won’t be zero at 280 ppmv, but there will be no growth at zero ppmv.
Dear Ferdinand,
August 6, 2025 at 1:22 pm
I forgot to mention that appealing to the authority of the IPCC and others in the climate “science” community does not go over well with scientists outside the community.
Jim,
I would love to know your take on Figure 2 of the Radiocarbon article previously cited.
Ed,
Analyzing radiocarbon data without referring to disequilibriium isotopic fluxes is a sign of ignornance. In your case it is willful ignorance, since these things have been pointed out to you years ago. Perhaps you can explain why, despite disequilibrium isotope fluxes, the fraction of “human carbon” in the present atmsopsphere is a useful statistic.
David Andrews
August 6, 2025 at 5:22 pm
David,
Thank you for inviting my take on Figure 2 of Schwartz et al. It seems I am not alone being unable to figure out why delta14C has an e-time of 17 or so years. Qualitatively, I would explain the mole fraction curve as the removal of 14C being offset by the 100 ppmv increase in CO2 since 1960. In other words, although delta14C has essentially reached its pre-bomb balance level, the absolute amount of atmospheric 14C increased in proportion to the CO2 increase. I have not worked that out quantitatively yet, but I am working on it.
Stephen P. Anderson, August 6, 2025 at 2:43 pm
“Ferdinand, do you agree that Natural Emissions are about 100ppmv?”
Yes, but I also know that these inflows (and the counter current natural outflows) are caused by temperature, bacteria, fungi, insects, animals,… largely independent of the CO2 quantity/pressure already in the atmosphere.
Most of these huge flows cycle in and out within a year. The only outflow that counts is the net difference at the end of a full year and that is caused by two items: one-way human emissions of FF use and the extra CO2 level/pressure in the atmosphere that causes more uptake than return from the natural sinks and sources.
See the difference in causes for the huge seasonal CO2 flows and the small overall result over a year I did send at August 6, 2025 at 9:04 am
Jim Siverly, August 6, 2025 at 5:01 pm
“I apologize for responding pejoratively to some of your arguments.”
No need for an apology, have had much worse discussions with Greenpeace in the 1990’s about the use of chlorine…
I was a practical chemical engineer in my (long ago) working life, bringing new products (resins for paints, printing inks, etc.) from 1 liter laboratory production up to 17 tons batches in a real factory, with all the practical problems involved. Later on in the direction of process automation, with even less direct engineering theories…
Have several times been confronted with very brilliant people who had troubles to understand what a simple mass budget or other simple things in life imply…
That is the reason that I often use formulas without thinking of the underlying theories and when asked for these theories have to go back in 60-year old memories and sources like Wiki…
That being said:
What Dr. Ed and you used is the 4-year residence/turnover time. That is a simple formula that only looks at what the CO2 level in the atmosphere is and how much per year is going out of the atmosphere.
That doesn’t give you any clue about the underlying processes.
If that are all level/pressure dependent processes, then one may revert the formula to find the output with the calculated Te and then Te = RT or TT or whatever name you give the residence/turnover time.
If a large part of the (in this case all) processes are largely independent of the CO2 level/pressure in the atmosphere, then one may not use Te = RT, as Ta/Tau in that case is completely independent of the residence/turnover time.
That is what the IPCC explicitly and many skeptics implicitly say, but Dr. Ed ignores.
Is that appealing to authority? Or just checking that what they say is right, no matter who says it…
“I am still not clear on your claim to have calculated Tau independent of historical equilibrium. ”
There are two main reservoirs that exchange CO2 with the atmosphere: oceans and vegetation.
For the ocean (surface) the exchange formula is quite simple:
F = k•s•ΔpCO2
No matter if ΔpCO2 is between the current pCO2 and the old equilibrium or between two current pCO2 levels at several years difference.
As the formula for Ta/Tau is:
Ta = disturbance / response
It doesn’t matter over what part of the disturbance you calculate Ta, as for a linear response Ta remains the same. Even for the full disturbance, thus the full distance to the (old or new) equilibrium.
For vegetation, the response is linear too for most plants (with the C3-cycle) between 280 and 1000 ppmv. Below 160 ppmv, all trees and many other plants stop photosynthesis and die out. C4-type plants (some grasses and an important crop: corn) still are growing, but slower with the CO2 level in the atmosphere. Here an overview:
https://www.ferdinand-engelbeen.be/klimaat/klim_img/plant_uptake.png
Again, one can calculate the Ta for plants on any segment of the disturbance/response levels.
There is one problem left: temperature variability also has a huge influence on the yearly uptake, especially in vegetation, of about +/- 2 ppmv on a change of 5 ppmv/year. That is only noise, as the long-term influence of temperature on the CO2 level in the atmosphere is very modest: some 16 ppmv/°C. Therefore it is preferable to use the polynomial through the noise…
“Jim Siverly, August 6, 2025 at 5:01 pm
“I apologize for responding pejoratively to some of your arguments.”
No need for an apology, have had much worse discussions with Greenpeace in the 1990’s about the use of chlorine…
I was a practical chemical engineer in my (long ago) working life, bringing new products (resins for paints, printing inks, etc.) from 1 liter laboratory production up to 17 tons batches in a real factory, with all the practical problems involved. Later on in the direction of process automation, with even less direct engineering theories…
Have several times been confronted with very brilliant people who had troubles to understand what a simple mass budget or other simple things in life imply…
That is the reason that I often use formulas without thinking of the underlying theories and when asked for these theories have to go back in 60-year old memories and sources like Wiki…
That being said:
What Dr. Ed and you used is the 4-year residence/turnover time. That is a simple formula that only looks at what the CO2 level in the atmosphere is and how much per year is going out of the atmosphere.
That doesn’t give you any clue about the underlying processes.
If that are all level/pressure dependent processes, then one may revert the formula to find the output with the calculated Te and then Te = RT or TT or whatever name you give the residence/turnover time.
If a large part of the (in this case all) processes are largely independent of the CO2 level/pressure in the atmosphere, then one may not use Te = RT, as Ta/Tau in that case is completely independent of the residence/turnover time.
That is what the IPCC explicitly and many skeptics implicitly say, but Dr. Ed ignores.
Is that appealing to authority? Or just checking that what they say is right, no matter who says it…
“I am still not clear on your claim to have calculated Tau independent of historical equilibrium. ”
There are two main reservoirs that exchange CO2 with the atmosphere: oceans and vegetation.
For the ocean (surface) the exchange formula is quite simple:
F = k•s•ΔpCO2
No matter if ΔpCO2 is between the current pCO2 and the old equilibrium or between two current pCO2 levels at several years difference.
As the formula for Ta/Tau is:
Ta = disturbance / response
It doesn’t matter over what part of the disturbance you calculate Ta, as for a linear response Ta remains the same. Even for the full disturbance, thus the full distance to the (old or new) equilibrium.
For vegetation, the response is linear too for most plants (with the C3-cycle) between 280 and 1000 ppmv. Below 160 ppmv, all trees and many other plants stop photosynthesis and die out. C4-type plants (some grasses and an important crop: corn) still are growing, but slower with the CO2 level in the atmosphere. Here an overview:
https://www.ferdinand-engelbeen.be/klimaat/klim_img/plant_uptake.png
Again, one can calculate the Ta for plants on any segment of the disturbance/response levels.
There is one problem left: temperature variability also has a huge influence on the yearly uptake, especially in vegetation, of about +/- 2 ppmv on a change of 5 ppmv/year. That is only noise, as the long-term influence of temperature on the CO2 level in the atmosphere is very modest: some 16 ppmv/°C over very long periods. Therefore it is preferable to use the polynomial through the noise…
“Your use of anecdotal data, such as calculating a Te from Level/Output in 1960 and contrasting it with 2010, is troubling”
If the formula of Te = level / output = 4 years and its reverse is right, it should be right for any level of CO2 in the atmosphere, except for any (temperature induced) noise… The fact that the increase in the fast cycle of the biosphere is only 13% and not 50% is a clear sign that you can’t use Te in reverse to calculate the outflows.
“The most egregious flaw in your presentation is to claim output to vegetation is not concentration dependent.”
I did only say that it is largely concentration independent: about 120 PgC is sucked away out of the atmosphere by temperature and sunlight into vegetation in only a few months from minimum to maximum uptake. Only some 2.5 PgC/yr gets into more permanent growth, that is about 2% of the total uptake which is atmospheric CO2 level/pressure dependent…
See the difference in flows I have sent on:
August 6, 2025 at 9:04 am
To myself, David Andrews and Jim Siverly re our recent comments on Delta14C.
First, let’s review the data:
1. Delta14C is about 14CO2 and its connection to 12CO2. The fact that Delta14C remains near zero (really 1000 before they subtracted 1000) has allowed carbon dating.
2. The constancy of Delta14C even as 12CO2 has gone up and down, indicates the inflow of natural carbon into the atmosphere has a constant ratio of 14C/12C.
3. After 1970, Delta14C approached its natural balance level = zero, exactly following equation (2) Outflow = Level / Te, with a constant Te of 16.5 years.
4. Schwartz et al (2024, referenced by Andrews) shows Delta14C is slightly but not significantly below zero.
5. 14CO2 did not return to its original value but returned to near Delta14C = zero.
Now let’s try to explain the above data.
First, my previous comment on this subject said the Te for 14CO2 was the same as the Te for Delta14C was incorrect.
Second, I stand by my calculation that the Te for Delta14C is 16.5 years.
Third, I stand by my published Te for 14CO2 of 10 years (Berry, 2023, Figure 13) because it is an accurate curve fit to the 14CO2 data from 1970 to 1995. Therefore, 10 years becomes the upper limit for the Te of the 12CO2.
Fourth, the increase of 14CO2 after 2000 is caused by the increase of 12CO2 AND the influence of Delta14C very close to zero.
Fifth, the decrease of Delta14C below zero is caused by human emissions of CO2.
David Andrews August 6, 2025 at 12:58 pm, wrote:
Beginning of debate
My phrase, “Returning to the balance level,” properly describes the path of Delta14C because that feature dominates over the decrease in the balance level of a few percent.
The tendency of natural Delta14C to stay close to zero is a better (and simpler) argument than the one proposed in 1998 by the Lawrence Livermore group.
Schwartz et al. say (when translated to normal English) that the addition of 14C-deficient human CO2 into the atmosphere causes more 14C from the land and oceans to flow into the atmosphere, thus increasing 14CO2.
The major problem with Schwartz’s idea is that it assumes human CO2 causes all the 12CO2 increase. The counter assumption that natural CO2 causes most of the CO2 increase is a far better explanation because this natural CO2 immediately brings in 14CO2 with Delta14C equal to zero.
Schwartz’s hypothesis would have a measurable delay in adding sufficient 14CO2 to keep Delta14C near zero. My hypothesis would have no delay, and this is what the data show.
Indeed, all forms of carbon act to return to their own equilibrium percentages, as I have described in my papers. Each form differs in its deviation from equilibrium.
We don’t need to use important-sounding phrases like “isotopic equilibration” and “disequilibrium flux” because 14C seeks its equilibrium like all other forms of carbon.
The natural 12C carbon cycle and the 14C carbon cycle are already close to their equilibrium, but human carbon is far from its equilibrium because its carbon enters the atmosphere and flows toward its equilibrium percentages as fast as possible.
This is why we must calculate the flows of human and natural carbon independently to get correct answers.
The best explanation for the increase in 14CO2 is that nature is the primary cause of the 12CO2 increase.
Ferdinand Engelbeen
August 7, 2025 at 5:16 am
Dr. Ed and I use “the simple formula that only looks at what the CO2 level in the atmosphere is and how much per year is going out of the atmosphere,” because that is all that is necessary to correctly represent the data using well-established physics.
Sometimes and in some places the temperature is sometimes warmer and sometimes colder, but on average at all times concentration drives the mass transfer. This is particularly and completely true for the ocean exchanges. The mass transfer continues in proportion to the concentrations on each side of an interface regardless of whether they in equilibrium or not. You may have come across Fick’s laws somewhere in your science background. Fick’s First Law very simply “describes the rate of diffusion across a surface or membrane. It states that the rate of diffusion is directly proportional to the concentration gradient and the diffusion coefficient.” Notice that it doesn’t describe the rate proportional to the concentration now and what it was in some previous time. If you continue to promote your view of CO2 mass transfer based on my previous sentence, you really should explain the scientific basis for it.
Never have you shown that “a large part of the (in this case all) processes are largely independent of the CO2 level/pressure in the atmosphere.”
“Is [what the IPCC explicitly and many skeptics implicitly say] appealing to authority?” Yes, and using what they say to confirm what they say is circular reasoning.
I can find Dalton’s Law and Fick’s Law in any physical chemistry textbook. Where do I find the science that generated Feely’s Law, F = k•s•ΔpCO2, and where has “No matter if ΔpCO2 is between the current pCO2 and the old equilibrium or between two current pCO2 levels at several years difference” been shown other than in the correlation between delta(pCO2) and pCO2 that you use to calculate Tau?
Where has the formula for “adjustment” time, Ta = disturbance / response, been experimentally demonstrated in any other discipline than climate “science?”
What equations explain the underlying processes beneath the fountain model?
“If the formula of Te = level / output = 4 years and its reverse is right, it should be right for any level of CO2 in the atmosphere, except for any (temperature induced) noise…”
Your figures comparing 1960 and 2010 are wrong in two ways. The black values are preindustrial, not from 1960. The black values were for estimating the equilibrium prior to FF emissions. The total estimated land plus ocean sink was 60 + 108.9, not 108, for an e-time of 3.5 years. The 2010 combined estimated output was 203 Pg compared to 829/3.5 = 238 or 829/203 = 4.1 years. That’s not a bad discrepancy any way you look at.
You wrote, “The fact that the increase in the fast cycle of the biosphere is only 13% and not 50% is a clear sign that you can’t use Te in reverse to calculate the outflows.” Seems like another assertion without good evidence. I have demonstrated Mauna Loa fits using both first-principle and back-calculation models.
“I did only say that it is largely concentration independent: about 120 PgC is sucked away…”
The reason it is sucked away is because temperature changes cause changes in Henry’s Law. A previously equilibrium condition goes out of equilibrium and NET mass transfer begins to takes place. But mass transfer that occurred previously continues to occur at similar rates based 100% on CURRENT concentration gradients having nothing to do with what happened in any previous year.
I saw your seasonal flow diagrams, but as you wrote to Stephen, “The only outflow that counts is the net difference at the end of a full year….”
The link to plant_uptake.png continues not to work.
Ed and Jim,
Neither of you concede that the mass balance/ carbon conservation argument is valid. But even the skeptics on the Trump administration’s climate assessment panel used it to affirm that human emissions are the cause of the atmospheric CO2 increase. Jim claimed to have found a loophole but went quiet, apparently because all he had been able to do is show that “human carbon” is but a small part of the present atmosphere. That was also Ed’s “discovery”, but mainstream science had beaten him to it.
Now you both dismiss disequilibrium isotope fluxes, another easily understood and validated concept used by real scientists. If two reservoirs start with different 14C/12C ratios, and balanced exchanges mix the carbon in the two reservoirs, the reservoir that started with the higher 14C/12C will lose 14C and the other reservoir will gain it, even when no net carbon is exchanged. How do your models manage to avoid this from happening? Do you agree, Ed, with Jim’s bizarre statement that this process violates the equivalence principle???
The Schwartz et al paper was written with the earlier mistakes of Berry, Harde, Salby, and a few others who thought Deta14C was the same as 14C concentration in mind. Ed, you haven’t shaken that mindset. The 1900-1950 pre-bomb data shown in Figure 1 is easily explained by the Suess effect, weakened by the exchanges that must be present as Seuss himself knew in the 1950’s. Note that Delta14C is diverging from Ed’s “balance level”, something that Ed cannot explain. Yes, the values are smaller than Ed’s paper naively believed they should be because of those pesky disequilibrium isotope fluxes.
David Andrews
August 7, 2025 at 12:17 pm
Yes, the mass balance argument is nonphysical. Accounting is not science. I think it is too early to judge the Trump’s panel as affirming that FF emissions cause all or most of the CO2 increase. Have they made statements to that effect? From my reading, The two physicists, I think you are alluding to, have expertise in how much warming extra CO2 will cause, not how much humans are responsible for the increase. I’ll be pleased to stand corrected, if necessary.
I’m not sure what loophole you attribute to me finding. I’ve been a supporter of Ed’s position for quite awhile and I would hardly characterize mainstream science as beating him to what seems to be finding the wrong solution to the problem of “disequilibrium isotope fluxes.” He has been patiently trying to school you and others along his discovery path. His is an exemplary case history of the application of the scientific method.
Your two reservoir problem assumes facts not in evidence, i.e. reservoirs where no net carbon was exchanged. As yet my spreadsheet model isotope work is incomplete and I don’t expect to find it conflicting substantially with Dr. Ed’s model.
But where did I make any bizarre statement of a process violating the equivalence principle? I would like to review it.
I highly doubt any scientist looking closely at the 14C evidence would come to a mistaken conclusion. I would rather jump to the conclusion that somewhere you are mistaken, but I will reserve judgment until finishing my investigation and review what you have written on the subject. Stay tuned!
David Andrews August 7, 2025 at 12:17 pm
Dear David,
You wrote, “Neither of you concede that the mass balance/ carbon conservation argument is valid.”
Well, David, as you should know, my whole model conserves carbon because of its continuity equation (1).
And your “Mass balance” can mean anything you want it to mean.
You claim I “dismiss disequilibrium isotope fluxes,” which you describe as:
Well, you missed the physics in that one, David.
In my model, if two reservoirs are connected, say like land and air reservoirs, these reservoirs will EXCHANGE carbon because the carbon outflow of air goes to land and the carbon outflow of land goes to the air.
For example, suppose land contains only 12C atoms and air contains only 14C atoms, then the outflow of land will send 12C atoms to the air and the air will send 14C atoms to the land.
Eventually, air has enough 12C atoms to send as many 12C atoms to land as land is sending to air. Similarly, with 14C atoms. That is equilibrium
You pound your chest like a happy gorilla and claim this is “disequilibrium isotope fluxes” at work.
NO, it’s my model at work. My model describes equilibrium better than your “disequilibrium isotope fluxes.”
For example, you say, “no net carbon is exchanged.” So, you are a magician as well as a pain in the butt.
Clearly, 12C moved from air to land. That is NOT a net zero exchange, David. Similarly, for 14C.
I have a question for you. How would your “disequilibrium isotope fluxes” apportion the 12C atoms and 14C atoms between land and air in my example?
I will assume you would answer, “equally,” meaning land and air would have at equilibrium the same number of 12C atoms and 14C atoms (assuming we began with an even number of atoms of each).
If you assumed that, you would be wrong, because my model is much more inclusive of physics than your “disequilibrium isotope fluxes.”
In my model, the respective Te’s of land and air would determine how many atoms of each end up in each reservoir when the flows are at equilibrium. Only if the Te’s were equal would we end up with the same number of atoms in each reservoir.
If air’s Te for 12C were lower than the Te for land, then land would end up with more 12C atoms than air at equilibrium.
That’s my carbon cycle model at work.
I put “disequilibrium isotope fluxes” in the same boat as the “flux capacitor”.
Jim Siverly, August 7, 2025 at 10:33 am
“Dr. Ed and I use ‘the simple formula that only looks at what the CO2 level in the atmosphere is and how much per year is going out of the atmosphere,’ because that is all that is necessary to correctly represent the data using well-established physics.”
If already 120 PgC/year, or over half of the total yearly outputs, into vegetation is completely independent of the CO2 level in the atmosphere (even reduces the level in the atmosphere!) and only 2.5 PgC/year depends of the CO2 level in the atmosphere, then you can’t use the residence time in reverse as Dr. Ed and you do.
98% independent of the CO2 level in the atmosphere, 2% level dependent.
“Sometimes and in some places the temperature is sometimes warmer and sometimes colder, but on average at all times concentration drives the mass transfer. This is particularly and completely true for the ocean exchanges.”
Again in very small part: the ocean exchanges are driven by Henry’s law: for a fixed temperature, there is a fixed ratio between the partial pressure (= amount) of gas above a solution and the partial pressure (= amount) of the same (free) gas in solution.
If pCO2(atm) = pCO2(aq), then there is no net transfer, but still lots of CO2 can be exchanged, only there is as much transfer between atmosphere and oceans as reverse.
If there is a difference in pCO2, the net transfer depends of the difference in pCO2 between these two. That is the base of the formula of Feely:
F = k*s*ΔpCO2
Which is true for any part of the oceans and for the oceans as a full dynamic system where lots of CO2 are emitted near the equator and absorbed near the poles (~40 PgC/year), sink there with the ocean waters into the deep oceans, to return some ~1,000 years later near the equator.
And it is true for the seasonal temperature changes which emit ~50 PgC/season in spring/summer to get absorbed again in fall winter.
For the latter see e.g. the seasonal pCO2 at Bermuda monitoring station (BATS), Figure 2:
https://tos.org/oceanography/assets/docs/27-1_bates.pdf
That shows the sea surface temperature induced seasonal change in pCO2 of the ocean waters at Bermuda between 310 and 390 μatm, while the pCO2 in the atmosphere in average over the period of measurements was around 360 μatm and increased with average some 1 μatm/year.
The net result of the CO2 level of 390 μatm in the atmosphere, in the last years of the measurements, on the absorption by the oceans, did lead to a net uptake of 2.5 PgC/year into the ocean waters, of which 0.5 PgC in the ocean surface (see Fig. 3 and table 2 in the reference of Bates) and the rest in the deep oceans.
Or for the ocean surface: 99% of the CO2 output is seasonal temperature dependent, only 1% atmospheric CO2 level dependent.
For the deep oceans: 95% of the CO2 output is temperature difference dependent and only 5% is CO2 level in the atmosphere dependent.
Thus Dr Ed’s and your Te is based on a theoretical world where only the level of some substance influences its output, while in the real world over 95% of the CO2 outputs out of the atmosphere are independent of that level and only less than 5% are CO2 level dependent.
Any calculations based on the 4 years turnover/residence time therefore have no connection with the real world.
As that is the essential base of our dispute, the rest is secondary…
Ed,
Me: “The 1900-1950 pre-bomb data shown in Figure 1 is easily explained by the Suess effect, weakened by the exchanges that must be present as Seuss himself knew in the 1950’s. Note that Delta14C is diverging from Ed’s “balance level”, something that Ed cannot explain. Yes, the values are smaller than Ed’s paper naively believed they should be because of those pesky disequilibrium isotope fluxes.”
I notice your latest comment skipped a discussion of what happened between 1900 and 1950, because your “Delta14C balance level” scheme cannot explain the clearly observed Seuss effect.
Jim
You: “Yes, the mass balance argument is nonphysical. Accounting is not science. “
Wow! Clearly you are not a scientist. When Joule established the equivalence of mechanical energy and heat, did he not do some “accounting”? When Pauli postulated undetected neutrinos to explain the missing energy in beta decays, was that not an attempt to balance the books? I could go on, but you would likely not understand, as you appear to be scientifically illiterate. The fact that human carbon emissions exceed atmospheric carbon growth, along with carbon conservation, tells us unambiguously that natural processes are moving net carbon from the atmosphere to land/sea reservoirs. As the Trump climate assessment task force put it:
“The annual increase in concentration is only about half of the CO2 emitted because land and ocean processes currently absorb “excess” CO2 at a rate approximately 50 percent of the human emissions. Future concentrations, and hence future human influences on the climate, therefore depend upon two components: (1) future rates of global human CO2 emissions, and (2) how fast the land and ocean remove extra CO2 from the atmosphere. We discuss each of these in turn.”
Climate Working Group (2025) A Critical Review of Impacts of Greenhouse Gas Emissions on the U.S. Climate. Washington DC: Department of Energy, July 23, 2025
released 7/29/25
I wrongly gave you more credit for open-mindedness than you deserved. Keep pecking away at your spreadsheets in support of Ed. I won’t bother to comment on them anymore.
David Andrews August 8, 2025 at 6:29 am
Dear David,
I must start addressing you as “Disequilibrium David.”
I just finished showing you how my carbon cycle model explains carbon flow more accurately than your outdated “disequilibrium isotope fluxes.”
Yet, you just wrote:
“The 1900-1950 pre-bomb data shown in Figure 1 is easily explained by the Suess effect, weakened by the exchanges that must be present as Seuss himself knew in the 1950’s. Note that Delta14C is diverging from Ed’s “balance level”, something that Ed cannot explain. Yes, the values are smaller than Ed’s paper naively believed they should be because of those pesky disequilibrium isotope fluxes.”
My model shows how human CO2 balance level lowers Delta14C and explains the Suess effect and 14C flows and levels. It does this more accurately than your math-challenged, outdated “disequilibrium isotope fluxes.”