My publication The Impact of human CO2 on atmospheric CO2 – edberry.com supersedes my Preprint #3 below.
Download Excel file here.
Comments by scientists:
- “Dear Ed, Congratulations – a wonderful piece of work.” – Dr. Nils-Axel Morner
- “Ed does not make mathematical mistakes in solving his rate equations.” – Dr. William Happer
Dr. Richard Courtney wrote in his email to global-warming-realists@googlegroups.com on November 21, 2019:
Dear Ed,
I again provided my 2008 paper as an attachment to an email earlier today. Its conclusion to which you refer is on its pages 6 and 7 and says,
“In the light of all the above considerations it would appear that the relatively large increase of CO2 concentration in the atmosphere in the twentieth century (some 30%) is likely to have been caused by the increased mean temperature that preceded it. The main cause may be desorption from the oceans. The observed time lag of half a century is not surprising. Assessment of this conclusion requires a quantitative model of the carbon cycle, but – as previously explained – such a model cannot be constructed because the rate constants are not known for mechanisms operating in the carbon cycle.”
Your “physics model” quantifies the anthropogenic and natural contributions to changes in atmospheric CO2 concentration without need for knowledge of rate constants for individual mechanisms. This is a breakthrough in understanding which Segalstad, Harde, Salby, and myself all failed to make.
Richard
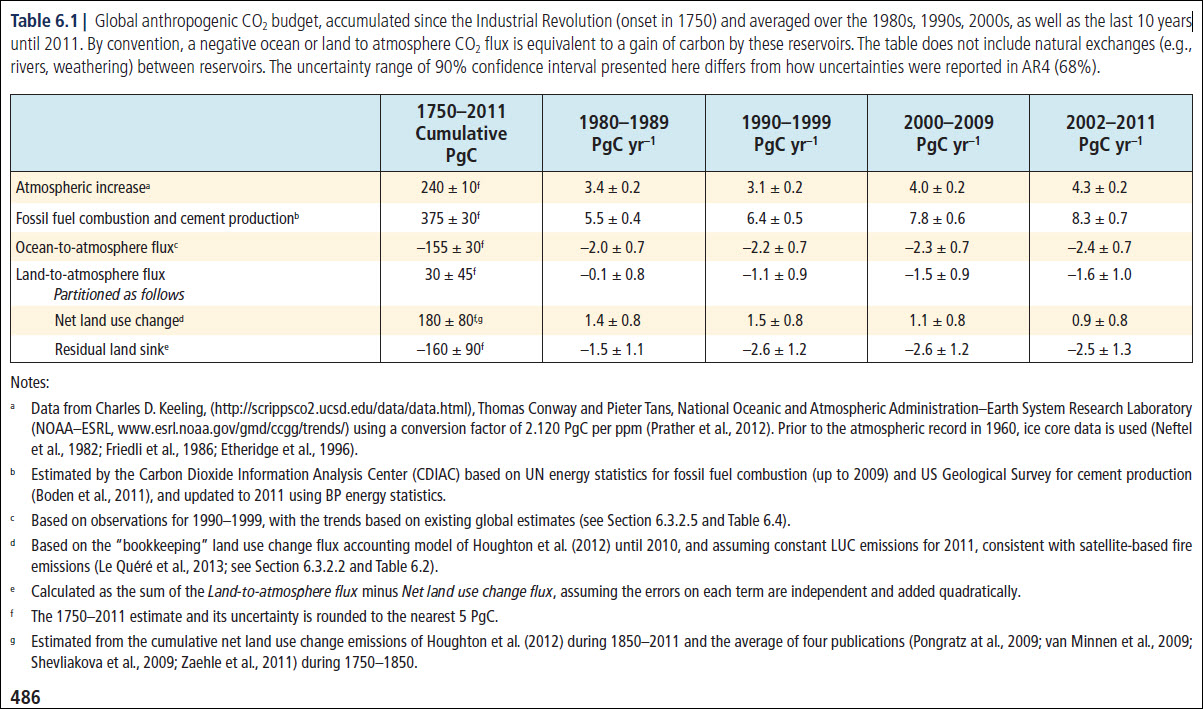
IPCC’s Table 6.1 relevant to comments beginning June 22, 2021.
Have you seen Dr Peter Wards site …. https://whyclimatechanges.com/ In which he proposes that the rise in temperatures are because of O2 depletion ??
Pingback: Fight for Truth - edberry.com
Pingback: The World's most costly Scientific Error - edberry.com
Pingback: The World's most costly Scientific Error - edberry.com
They lie because they have an agenda … https://www.youtube.com/watch?v=-vb7JRK4Yko
Pingback: IPCC Data: Rising CO2 is 75% Natural – Climate- Science.press
Dear Ed
R. Cultz published my charts on his website a number of times on the basics of CO2.
I’m interested in adding your chart (CO2 above 280 ppm) to the list.
I’m no scientist, but have always been interested in the sciences. I did one year of environmental studies many years back and have been following the growing ECO hype ever since. What always strikes me the most is how little people know about the basics. That’s why I created these Charts.
https://www.ric-communications.ch/projekte/simple-science-1
The world of CO2
Infographics can be helpful, in making things simple to understand. CO2 is a complex topic with a lot of information and statistics. These simple step by step charts should help to give you an idea of CO2’s importance. Without CO2, plants wouldn’t be able to live on this planet. Just remember, that if CO2 falls below 150 ppm, all plant life would cease to exist.
– N° 1 Earth’s atmospheric composition
– N° 2 Natural sources of CO2 emissions
– N° 3 Global anthropogenic CO2 emissions
– N° 4 CO2 – Carbon dioxide molecule
– N° 5 The global carbon cycle
– N° 6 Carbon and plant respiration
– N° 7 Plant categories and abundance (C3, C4 & CAM Plants)
– N° 8 Photosynthesis, the C3 vs C4 gap
– N° 9 Plant respiration and CO2
– N° 10 The logarithmic temperature rise of higher CO2 levels.
– N° 11 Earth’s atmospheric composition in relationship to CO2
– N° 12 Human respiration and CO2 concentrations.
– N° 13 600 million years of temperature change and atmospheric CO2
– N° 14 The composition of the human body
Thanks for your feedback!
Pingback: The Impact of human CO2 on atmospheric CO2 - edberry.com
Pingback: The Impact of human CO2 on atmospheric CO2 - edberry.com
Pingback: Origen del CO2 atmosférico – El Palo de Hockey
Pingback: By the Numbers: CO2 Mostly Natural - Climate- Science.press
Pingback: PREPRINT #2: The Physics Model Carbon Cycle For Human CO2
Pingback: You Are Not Causing Global Warming