
I presented a summary of this preprint at the “Basic Science of a Changing Climate” conference in Porto, Portugal, on September 7, 2018. – Ed
Edwin X Berry, Ph.D., Physics
Climate Physics LLC, 439 Grand Dr #147, Bigfork, Montana 59911, USA
Copyright © 2018 by Edwin X Berry. This PREPRINT will be submitted to a journal for publication. Therefore the present copyright does not permit republication because journals allow only one PREPRINT for submitted papers.
Abstract
The United Nations Intergovernmental Panel on Climate Change (IPCC) climate theory assumes nature is constant. This assumption forces IPCC’s invalid claim that human emissions have caused all the increase in atmospheric CO2 above 280 ppm. IPCC’s argument to support its failed theory also fails logic because the argument itself assumes nature is constant.
IPCC’s theory cannot simulate the carbon-14 data from 1965 to 1995. The carbon-14 data prove human CO2 does not “reduce the buffer capacity of the carbonate system” as IPCC claims.
A Simple Model, based only on the continuity equation with CO2 outflow proportional to level, exactly replicates the carbon-14 data. The Model shows CO2 emissions do not accumulate in the atmosphere as IPCC theory claims but set balance levels for CO2.
Present human emissions increase the level by 18 ppm and present natural emissions increase the level by 392 ppm to produce today’s total level of 410 ppm.
The Simple Model requires us to think in a new paradigm about how CO2 flows into and out of our atmosphere. It changes entirely the dominant worldview of how human emissions change the level of CO2 in our atmosphere.
1. Introduction
The critical scientific questions about human-caused climate change are about cause-and-effect:
- How much do human emissions increase atmospheric CO2?
- How much does increased atmospheric CO2 change climate?
This paper focuses on the first question.
The United Nations Intergovernmental Panel on Climate Change (IPCC, 2007) Executive Summary claims human emissions have caused ALL the increase in CO2 since 1750. They say the level was 280 ppm in 1750 and human emissions added 130 ppm to increase the level to today’s 410 ppm.
The IPCC claims “abundant published literature” shows, with “considerable certainty,” that nature has been a “net carbon sink” since 1750, so nature could not have caused the observed rise in atmospheric carbon dioxide.
IPCC (2007) claims human CO2 emissions have clogged the carbon cycle and thereby extended CO2 residence time in the atmosphere,
“The fraction of anthropogenic CO2 that is taken up by the ocean declines with increasing CO2 concentration, due to reduced buffer capacity of the carbonate system.”
The U.S. Global Change Research Program Climate Science Special Report (USGCRP, 2018) agrees with the IPCC and claims,
“This assessment concludes, based on extensive evidence, that it is extremely likely that human activities, especially emissions of greenhouse gases, are the dominant cause of the observed warming since the mid-20th century.”
The IPCC and the USGCRP claim there are “no convincing alternative explanations” other than their theory to explain “observational evidence.”
This paper proves all these IPCC and USGCRP claims are invalid.
“Abundant published literature” is irrelevant because votes don’t count in science. There is no “extensive evidence” except repetition of invalid claims, and evidence does not prove a theory is correct.
According to the scientific method, it is impossible to prove an idea is true, but if an idea makes only one false prediction then the idea is wrong. (Kemeny, 1959; Farnam Street, 2018a, 2018b; Feynman et al, 2011; ScienceNET, 2016; Science Today, 2017).
Many authors agree that human emissions have little effect on the level of atmospheric CO2, even though they used different methods to derive their conclusions.
Revelle and Suess (1957), Starr (1992), Segalstad (1992, 1996, 1998), Rorsch et al. (2005), Courtney (2008), Siddons and D’Aleo (2007), Quirk (2009), Spencer (2009), MacRae (2010, 2015), Essenhigh (2009), Glassman (2010), Wilde (2012), Caryl (2013), Humlum et al. (2013), Salby (2012, 2014, 2016), and Harde (2017a) concluded that human emissions cause only a minor change in the level of atmospheric CO2.
Segalstad (1998), Ball (2008, 2013, 2018), and Salby (2014) present evidence that the level in 1750 was higher than 280 ppm. Nevertheless, this paper uses IPCC data. The goal of this paper is to show how the IPCC climate theory fails even when using IPCC data.
Authors who argue for the IPCC view include Cawley (2011), Kern and Leuenberger (2013), Masters and Benestad (2013), Richardson (2013). Most notable is the Kohler et al. (2017) desperate attack on Harde (2017a) which concludes,
“Harde … uses a too simplistic approach, that is based on invalid assumptions, and which leads to flawed results for anthropogenic carbon in the atmosphere. We suggest that the paper be withdrawn by the author, editor or publisher due to fundamental errors in the understanding of the carbon cycle.”
There is no tolerance in Kohler’s world for a contradictory opinion. Like other promoters of Lysenkoism, Kohler wants Harde (2017a) withdrawn. In possible response, the Elsevier journal – Global and Planetary Change – refused to publish Harde’s (2017b) rebuttal to Kohler. Harde (2017c) replies to reviewer reports regarding the rejection of his rebuttal.
Kohler claims Harde (2017a) is wrong because Harde uses one reservoir (the atmosphere) and one equation. Kohler does not understand systems.
Science is replete with examples that use a simple system with a single equation for great benefit. The Carnot engine uses one equation to describe the maximum amount of work obtainable from the inflow and outflow of heat. The adiabatic process uses one equation to explain the physics inside one reservoir.
This paper supports Harde (2017a) and its key conclusions:
“Under present conditions, the natural emissions contribute 373 ppm and anthropogenic emissions 17 ppm to the total concentration of 390 ppm (2012).”
To keep the discussion simple, this paper converts all GtC (Gigatons of Carbon) units into the equivalent CO2 units of ppm (parts per million by volume in dry air), using:
1 ppm = 2.13 GtC
Munshi (2017) shows the “detrended correlation analysis of annual emissions and annual changes in atmospheric CO2” is zero. Therefore, IPCC’s claim of “considerable certainty” fails. Where there is no correlation, there is no cause and effect.
2. Two models take the carbon-14 test
2.1 The IPCC model
The IPCC theory assumes natural CO2 balances, but human CO2 does not. The IPCC inserted its theory into its climate models. The IPCC “Bern model” (Bern, 2002) is a seven-parameter curve fit to the output of IPCC’s climate models (Joos et al., 2013). The Bern model shows the effect of IPCC’s theory on climate models. It is described in Section 3.
The IPCC claims nature treats human-produced CO2 differently than it treats nature-produced CO2. However, that is impossible because the CO2 molecules from the two sources are identical.
Then the IPCC claims the Bern model applies only to human CO2 emissions. However, the Equivalence Principle requires the Bern model and all CO2 models to apply equally to human and natural emissions.
Einstein used the Equivalence Principle to derive his Theory of General Relativity. The Equivalence Principle says if data cannot tell the difference between two things then the two things are identical.
2.2 The Simple Model
The “Model” is the simplest possible model to describe how CO2 flows through the atmosphere. The Model is based on the continuity equation and the assumption that outflow is proportional to the level of CO2 in the atmosphere. The Model applies equally to human, natural, and carbon-14 CO2. It is described in Section 4.
Models, simple or complex, embody theories. Just as theories must be tested, models must be tested. The proper test is to make a prediction and compare the prediction with data. If the prediction fails, the model fails and maybe the theory fails as well.
Berry (1967) used a numerical model to predict how fast cloud-droplets collect to form raindrops. To test the model, Berry used predictions for three special cases of the core formula that had analytic solutions, and the three analytic solutions bounded the domain of known cloud-droplet collection. The successful simulation of the three analytic solutions gave credibility to the model’s calculation for cloud-droplet growth.
2.3 The carbon-14 data
The above-ground atomic bomb tests raised the level of carbon-14 in the atmosphere from the “normal” 100 percent to 180 percent until the tests were terminated in 1963. The carbon-14 atoms are in the form of CO2, so carbon-14 CO2 traces how carbon-12 CO2 flows out of the atmosphere.
Carbon-14 is a natural tracer of atmospheric CO2. The carbon-14 CO2 produced by the bomb tests follows the same carbon path as carbon-12 CO2.
A carbon-14 atom has 2 more neutrons that a carbon-12 atom. Carbon-14 CO2 is heavier than carbon-12 CO2. Therefore, it has a longer residence time.
Fig. 1 shows a plot of the carbon-14 data (Wikipedia, 2017). The natural concentration of carbon-14 CO2 is defined as 100 percent. The “pMC/ percent” is “percent of modern carbon” where “modern carbon” means the level in 1950 (Berger, 2014).
The half-life is the time taken for the level of carbon-14 CO2 to fall to one-half its initial level above its balance level. (Not to be confused with the radioactive half-life of carbon-14 of 5730 years.)

The carbon-14 level minus 100, loses half of its value every ten years. So, the half-life of carbon-14 CO2 is 10.0 years.
2.4 The carbon-14 test results
All valid CO2 models must replicate the decay of atmospheric carbon-14 data after 1963. According to the scientific method, if a prediction is wrong, the theory is wrong.
Fig. 2 shows how the IPCC Bern model and the Model simulate the outflow of CO2 from the atmosphere. The simulation subtracts 100 from the carbon-14 data to simulate the case where inflow is zero. This subtraction does not affect the shape of the carbon-14 decay curve. All models begin the simulation at 80 and assume inflow is zero. To download the Excel file with the calculations, see Berry (2018).
The blue curve is the carbon-14 data. This is “ground truth.”
The blue curve also shows the Model prediction using Eq. (8). The blue curve falls half-way to zero every 10 years. The simple Model exactly simulates the carbon-14 data.
The green curve shows the Model prediction with the residence time adjusted to simulate carbon-12 CO2. The green curve falls half-way to zero every 2.8 years.
The red curve shows the Bern model prediction calculated using Eq. (A.1). For the first year, it approximates the green curve of the simple model. Thereafter, the Bern model predicts progressively slower outflow. The level never goes below 12 on this plot because IPCC claims 15 percent of human emissions remain in the atmosphere forever.
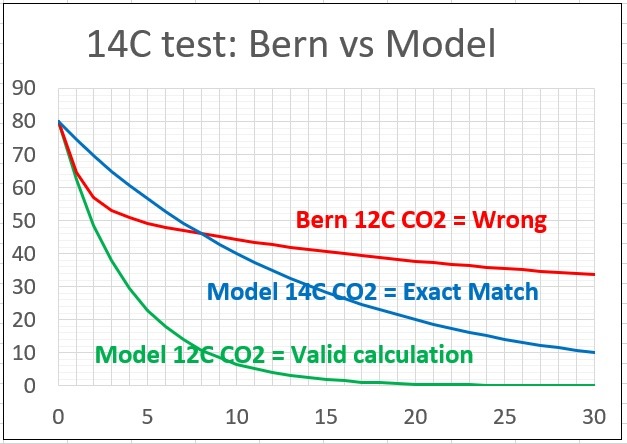
The complex IPCC theory cannot simulate the carbon-14 data. Therefore, the IPCC theory is wrong.
The Bern model is unphysical. It changes its future with time. For example, the Simple Model predicts the level will fall one-half its value in a specific time interval no matter where you start on the curve. But the Bern model gives a different future if you begin at a different time on its curve.
The Model’s exact simulation of the carbon-14 data proves two things. First, the Model predicts the data. Second, the outflow of carbon-14 CO2 from the atmosphere is proportional to level. This implies the outflow of carbon-12 CO2 is similarly proportional to level.
3. Why the IPCC theory fails
3.1 IPCC assumes nature is constant
IPCC assumes nature is constant. This incorrect assumption forces the conclusion that human emissions caused all the increase in atmospheric CO2 above 280 ppm. If the IPCC would simply relax its constraints on nature, it would help the IPCC find the truth.
IPCC (2007) shows its basic assumption in two flow diagrams to represent the carbon cycle. The following discussion converts IPCC’s GtC units to ppm. Fig. 3 summarizes IPCC’s Figs. 3.1a and 3.1b. IPCC claims the “natural carbon cycle” is balanced and the “human perturbation” is unbalanced, leaving 1.5 ppm of human CO2 in the atmosphere each year.
The IPCC inserted its assumption that human CO2 causes all the increase in atmospheric CO2 into its climate models. IPCC is wrong because its assumption violates the Equivalence Principle and it cannot replicate the carbon-14 data.
3.2 IPCC argument fails logic
IPCC (2007) argues that during the time frame from 1750 to 2013:
- Atmospheric CO2 increased 117 ppm.
- Total human CO2 emissions were 185 ppm.
- This total is 68 ppm more than the 117-ppm increase.
- Therefore, human emissions caused ALL the 117-ppm increase in atmospheric CO2, while nature absorbed the remaining human 68 ppm.
IPCC’s argument fails because it ignores natural CO2 inflow which totaled 26,000 ppm during the same period, and it ignores outflow. Simply put, IPCC’s core argument does not play with a full deck.
In Section 4, the Simple Model shows that present human CO2 emissions raise the level of atmospheric CO2 by only 18 ppm. If natural CO2 had not increased, the level of CO2 in the atmosphere would be IPCC’s 280 ppm plus 18 ppm for a total of 298 ppm. This result is consistent with IPCC’s first three points above.
3.3 IPCC Bern model
Appendix A shows how to remove the integral in the Bern (2002) model to reveal its level equation.
The Bern model Eq. (A.1) predicts human emissions of 4 ppm per year for 100 years will leave 60 ppm in the atmosphere forever.
The Equivalence Principle requires the Bern model to apply to natural as well as human CO2. The Bern model predicts natural emissions of 100 ppm per year for 100 years will leave 1500 ppm in the atmosphere forever. This clearly invalid prediction for natural emissions proves the Bern model is wrong. Therefore, IPCC’s basic assumption is wrong.
The creators of the original Bern model, Siegenthaler and Joos (1992), understood their model should reproduce the carbon-14 data and were disappointed that it did not do so.
The IPCC modified the original Bern model, described by Siegenthaler and Joos, that connected the atmosphere level to the upper ocean level, and the upper ocean level to the deep and interior ocean levels, as can be seen in their Fig. 1.
The IPCC removed the Bern model levels for the deep and interior ocean and connected their rates directly to the atmosphere level. That is why the Bern model has three residence times rather than one. Connecting flows that belong to the deep and interior ocean directly to the atmosphere violates the principles of systems (Forrester, 1968) and will give the wrong answer.
The Bern model assumes the flows with these three residence times act in series rather than in parallel. This is like having three holes of different sizes, in the bottom of a bucket of water, and claiming the smallest hole restricts the flow through the largest hole.
3.4 IPCC buffer capacity claim is wrong
IPCC’s Bern model is based on IPCC’s claim that human CO2 has overloaded natural carbon-dioxide sinks and therefore has slowed the outflow of CO2 from the atmosphere. IPCC claims,
“The fraction of anthropogenic CO2 that is taken up by the ocean declines with increasing CO2 concentration, due to reduced buffer capacity of the carbonate system.”
The IPCC put its unproven claim into its theory. Then the IPCC put its theory into its climate models. The Bern model simulates the climate models.
The IPCC theory predicts the half-life for carbon-14 would have increased from 1965 to 1995. This would have deviated the blue curve in Fig. 2 to look more like the Bern model red curve.
However, Fig. 1 shows the 10-year carbon-14 half-life did not change from 1965 to 1995. Therefore, human CO2 has not “reduced the buffer capacity of the carbonate system” as the IPCC claims.
3.5 IPCC adjustment time is invalid
The IPCC (1990) defines an “adjustment time” to support its claim that human emissions have a long residence time:
“The turnover time of CO2 in the atmosphere, measured as the ratio of the content to the fluxes through it, is about 4 years. This means that on average it takes only a few years before a CO2 molecule in the atmosphere is taken up by plants or dissolved in the ocean.
“This short time scale must not be confused with the time it takes for the atmospheric CO2 level to adjust to a new equilibrium if sources or sinks change.”
“This adjustment time… is of the order of 50 – 200 years, determined mainly by the slow exchange of carbon between surface waters and the deep ocean.
“The concentration will never return to its original value, but reach a new equilibrium level, about 15 percent of the total amount of CO2 emitted will remain in the atmosphere.”
IPCC’s short residence time of about 4 years is correct. The Bern model’s failure to simulate the carbon-14 data and the Equivalence Principle prove the IPCC’s “adjustment time” is invalid.
4. Physics Model for atmospheric CO2
4.1 A Simple Model
The simple model shows how inflow affects level, how level affects outflow, and how balance occurs when outflow equals inflow. Nothing in the world outside the atmosphere changes these conclusions. But these conclusions change entirely the dominant worldview of how human emissions change the level of CO2 in our atmosphere.
You have a bucket of water with a hole in the bottom. Water from your hose flows into your bucket while water leaks out of the hole. You adjust the inflow until the water level stays almost constant.
The water in your bucket represents the CO2 in the atmosphere. Water from your hose represents the flow of CO2 into the atmosphere. Water that flows out of the hole represents the flow of CO2 out of the atmosphere.
If inflow is greater than outflow, the level goes up, and vice-versa. Also, as the water level increases, outflow increases. The Model puts these two assumptions into a mathematical equation with more precision as applied to the atmosphere. The Model not only explains the simple flow of water in the bucket, the Model also explains the flow of CO2 in the atmosphere.
4.2 Model derivation
A model is a system used to describe a subset of nature. A model is composed of levels and flows between levels. Flows are rates. Levels set the flows and the flows set the new levels (Forrester, 1968).
The Model extends the model introduced by Salby (2016) and Harde (2017a).
Fig. 4 illustrates the atmosphere system. The Model includes the level (concentration) of CO2 in the atmosphere and the inflow and outflow of CO2.
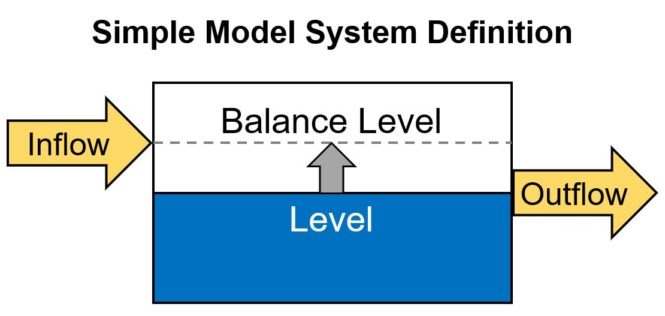
The Model does not include processes outside the system but incorporates their effects if they modify inflow or outflow.
The mathematics used to describe the Model are analogous to the mathematics used to describe many engineering systems.
The continuity equation assures carbon atoms are conserved:
dL/dt = Inflow – Outflow (1)
Where
L = carbon dioxide level
dL/dt = the rate of change of L
t = time
Inflow = the rate carbon dioxide moves into the system
Outflow = the rate carbon dioxide moves out of the system
Outflow must be an increasing function of level, or there would be no natural balance. Assume outflow is proportional to level,
Outflow = L / Te (2)
where Te is the 1/e residence time.
(More generally, Outflow can equal f(L) / Te, where f(L) is a strictly increasing function of L. This allows the Simple Model to support analogies where f(L) does not equal L.)
Substitute Eq. (2) into the continuity equation (1),
dL/dt = Inflow – L / Te (3)
To find an equation for Inflow, let the level equal its balance level, Lb. Then the level is constant and Eq. (3) becomes
Inflow = Lb / Te (4)
where
Lb = balance level of L
Substitute Eq. (4) into Eq. (3) to get,
dL/dt = – (L – Lb) / Te (5)
Rearrange Eq. (5) to get
dL / (L – Lb) = – dt / Te (6)
Then integrate Eq. (6) from Lo to L on the left side, and from 0 to t on the right side, to get (Dwight, 1955),
Ln [(L – Lb) / (Lo – Lb)] = – t / Te (7)
where
Ln = natural logarithm, or logarithm to base e
Lo = Level at time zero (t = 0)
Lb = the balance level for a given inflow and Te
Te = Residence time for level to move (1 – 1/e) of the distance from Lo to Le
e = 2.7183
(The original integration of Eq. (7) contains two absolute functions, but they cancel each other because both L and Lo are always either above or below Le.)
Raise e to the power of each side of Eq. (7), to get the level as a function of time:
L = Lb + (Lo – Lb) exp(- t / Te) (8)
Equation (8) shows that Te is the 1/e residence time of CO2 in the atmosphere.
The Model applies independently to all forms and sources of CO2.
4.3 Balance level
Contrary to popular opinion, CO2 does not “accumulate” in the atmosphere. Constant inflows don’t add to the level of CO2.
The Model shows how inflows, human or natural, set independent balance levels. Constant inflows have constant balance levels. The sum of human and natural balance levels equals the total balance level. Fig. 4 shows how nature balances inflow by adjusting outflow until the level equals the balance level.
Solving Eq. (4) for Le gives
Lb = Inflow * Te (9)
Equation (9) shows how inflow and residence time set the balance level. Equation (2) shows how level and residence time set outflow.
Equation (5) shows how level always moves toward its balance level. If inflow is zero, Le is zero, and outflow will continue until the level goes to zero.
The level of CO2 in the atmosphere behaves like the level of water in a lake. If a river flows into a lake and lake water flows out over a dam, the inflow does not continue to increase the lake level. The inflow simply raises the level of the lake until the outflow over the dam equals the inflow from the river. Then the lake level remains constant so long as inflow remains constant.
4.4 Residence time
There are two definitions of residence times, half-life, Th, and 1/e residence time, Te. Both residence times are different measures of the same thing:
Residence time controls how level L approaches its balance level Le when inflow is constant.
When time t equals half-life Th, or
t = Th
then Eq. (7) becomes
Ln [(L – Lb) / (Lo – Lb)] = – Th / Te
Ln (1/2) = – Th / Te
Ln (2) = Th / Te
Te = Th / Ln (2)
Te = 1.4427 Th (10)
Equation (10) shows the relationship between residence half-life Th and 1/e residence time Te.
IPCC (2007) estimates today’s total natural carbon dioxide inflow is about 100 ppm per year. NOAA (2017) Mauna Loa data shows the 2015 level of atmospheric carbon dioxide is about 400 ppm.
Solve Eq. (4) for Te to get,
Te = Lb/ Inflow (11)
Insert the NOAA value for Le and the IPCC value for Inflow to get the residence time,
Te = 400 ppm / 100 ppm per year = 4 years (12)
IPCC (1990) agrees with Eq. (12) for residence time. This calculation of residence time applies to carbon dioxide levels from about 280 ppm to 1000 ppm.
4.5 Model replicates carbon-14 data
To reproduce the carbon-14 decay curve, use either rate Eq. (5) or analytic Eq. (8). Both equations give the same result. Use Eq. (10) to convert the carbon-14 half-life of 10.0 years,
Te = 1.4428 Th = 14.4 years (13)
Set,
Lo = 80 percent
Lb = 0 percent
4.6 Effect of human CO2
Data from Boden et al. (2017) show human carbon dioxide emissions from fossil-fuel burning, cement manufacturing, and gas flaring in 2014 was 4.6 ppm (9.855 GtC) per year.
Using Eq. (9) for the 2014 human emissions to get,
Lbh = (4.6 ppm/year) (4 years) = 18 ppm (14)
Using Eq. (9) for natural emissions to get,
Lbn = (98 ppm/year) (4 years) = 392 ppm (14)
Equation (14) shows human emissions create a balance level of 18 ppm. Equation (15) shows present natural emissions create a balance level of 392 ppm.
The total balance level for human and natural emissions, using the above data for 2014, is the total of Eq. (14) and Eq. (15), or 410 ppm.
If human and natural emissions stay constant after 2014, the carbon dioxide level would reach its balance level of 410 in about 2018. Mauna Loa data show 404 ppm for 2016. These calculations demonstrate the accuracy of the Model.
The ratio of Eq. (14) to Eq. (15) is independent of residence time,
Leh / Len = 18 / 392 = 4.6 percent (16)
Equation (16) shows the balance level ratio of human-produced to nature-produced carbon dioxide is the ratio of their inflows.
4.7 Effect of surface temperature
Rorsch et al. (2005), Courtney (2008), MacRae (2008, 2015), Humlum et al. (2013), Salby (2012, 2014, 2016), and Harde (2017a) show how changes in surface temperature precede changes in CO2.
Salby (2012) derives from data how the rate of change of CO2 level is a function of surface temperature Ts, or,
dL/dt = 3.5 (ppmv/year K) Ts(K) (17)
Salby shows how the increase in Ts since 1750 and since the Little Ice Age in 1650 explains the increase in the level of atmospheric CO2 from 1750 to the present.
Equation (2) shows outflow equals level divided by residence time. The carbon-14 data show outflow is proportional to level. Therefore, residence time is independent of level.
Equation (9) shows balance level equals inflow multiplied by residence time. Carbon-14 data show carbon sinks have not saturated and therefore have not changed residence time.
Therefore, in the absence of any other explanation, the increase of balance level after 1750 must be caused by increased inflow.
5. Conclusions
The IPCC theory is wrong because it cannot simulate the carbon-14 data, it claims nature treats human CO2 differently than natural CO2 which violates the Equivalence Principle, and its predictions with natural CO2 are extremely wrong.
Therefore, all climate models are wrong. All IPCC reports are wrong. Carbon sinks are not saturated. Human CO2 does not accumulate in the atmosphere. Human CO2 flows out of the atmosphere just like natural CO2.
The Simple Model is accurate. It exactly simulates the carbon-14 data.
All carbon dioxide emissions – human and natural, independently or in total – create an inflow that sets a balance level. Each level moves toward its balance level until its outflow equals its inflow. Then the level remains constant so long as its inflow remains constant.
Present human emissions create an inflow that adds 18 ppm to atmospheric CO2. Present natural emissions create an inflow that adds 392 ppm. Their total is 410 ppm.
If ALL human emissions stopped and natural emissions stayed constant, the level of CO2 would fall by only 18 ppm.
Nature’s CO2 emissions are 21 times human CO2 emissions. Therefore, nature changes climate. Human emissions do not.
Appendix A: Bern model math
The Bern (2002) model is an integral equation rather than a level or rate equation. The Bern model integrates the inflow of carbon dioxide from minus infinity to any time in the future.
To deconstruct the integral version of the Bern model, let inflow occur only in the year when “t-prime” equals zero (t’ = 0). Then the integral disappears, and the Bern model becomes a level equation.
The Bern level equation is,
L(t) = Lo [ A0 + A1 exp(- t/T1) + A2 exp(- t/T2) + A3 exp(- t/T3)] (A.1)
Where
t = time in years
Lo = the level of atmospheric carbon dioxide due to inflow in year t = 0
L(t) = the level of atmospheric carbon dioxide after year t = 0
where the Bern IPCC TAR standard values are,
A0 = 0.152
A1 = 0.253
A2 = 0.279
A3 = 0.319
T1 = 173 years
T2 = 18.5 years
T3 = 1.19 years
The A-values merely weight the four terms on the right-hand side of Eq. (A.1):
A0 + A1 + A2 + A3 = 1.000
Here are two easy ways to show the Bern model contradicts real-world data.
Set t equal to 100 years. Then Eq. (A.1) becomes,
L = (A0 + A1) Lo = (0.152 + 0.253 * 0.56) Lo = 0.29 Lo (A.2)
Set t equal to infinity. Then Eq. (A.1) becomes,
L = Ao Lo = 0.152 Lo (A.3)
Equations (A.2) and (A.3) predicts a one-year inflow that sets Lo to 100 ppm, followed by zero inflow forever, will cause the level in 100 years to be 29 ppm and the future level will never fall below 15 ppm.
Competing Interests
The author declares he has no conflict of interest.
Acknowledgements
This research was funded by the personal funds of the author.
The author thanks Chuck Wiese, Laurence Gould, Tom Sheahen, and Charles Camenzuli, who provided scientific critique, and Daniel Nebert, Gordon Danielson, and Valerie Berry, who provided language and grammar improvements.
References
(All internet links tested on 9/12/2017)
(“Year” is in two places. Prefer to delete “year” at end if journal approves.)
Ball, T., 2008: Pre-industrial CO2 levels were about the same as today. How and why we are told otherwise. http://climaterealists.com/index.php?id=2258, 2008.
Ball, T., 2013: Why and how the IPCC demonized CO2 with manufactured information. WattsUpWithThat. https://wattsupwiththat.com/2013/11/13/why-and-how-the-ipcc-demonized-co2-with-manufactured-information/, 2013.
Ball, T., 2018: What do ice-core bubbles really tell us? WattsUpWithThat. https://wattsupwiththat.com/2018/01/20/what-do-the-ice-core-bubbles-really-tell-us/, 2018.
Berger, A., 2014: The meaning of pMC. Research Gate. https://www.researchgate.net/post/In_radiocarbon_dating_what_does_pMC_indicates2, 2014.
Bern, 2002: Parameters for tuning a simple carbon cycle model. http://unfccc.int/resource/brazil/carbon.html, 2002.
Berry, E.X, 1967: Cloud Droplet growth by collection. J. Atmos. Sci. 24, 688-701. http://edberry.com/wp-content/uploads/Ed/CDG/CloudDropletGrowthbyCollection.pdf, 1967.
Berry, E.X, 2018: Excel file with Carbon-14 calculations. https://edberry.com/wp-content/uploads/Carbon-14-tests.xlsx, 2018.
[dataset] Boden, T., B. Andres, 2017: Global CO2 emissions from fossil-fuel burning, cement manufacture, and gas flaring: 1751-2014. http://cdiac.ornl.gov/ftp/ndp030/global.1751_2014.ems, 2017.
Caryl, E., 2013: The Carbon Cycle – Nature or Nurture? No Tricks Zone. http://notrickszone.com/2013/03/02/most-of-the-rise-in-co2-likely-comes-from-natural-sources/#sthash.vvkCqrPI.dpbs, 2013.
Cawley, G.C., 2011: On the Atmospheric residence time of anthropogenically sourced CO2. Energy Fuel 25, 5503–5513. http://dx.doi.org/10.1021/ef200914u. 2011.
Courtney, R.S., 2008: Limits to existing quantitative understanding of past, present and future changes to atmospheric CO2 concentration. International Conference on Climate Change, New York. https://www.heartland.org/multimedia/videos/richard-courtney-iccc1, 2008.
Dwight, Herbert Bristol, 1955: Tables of Integrals and Other Mathematical Data, Item 90.1. MacMillian Company. https://www.amazon.com/Tables-Integrals-Other-Mathematical-Data/dp/0023311703, 1955.
Essenhigh, R.E., 2009: Potential dependence of global warming on the residence time (RT) in the atmosphere of anthropogenically sourced CO2. Energy & Fuels. 23, 2773-2784. http://pubs.acs.org/doi/abs/10.1021/ef800581r, 2009.
Farnam Street, 2018a: Richard Feynman teaches you the scientific method. https://fs.blog/2009/12/mental-model-scientific-method/, 2018a.
Farman Street, 2019b: Who is Richard Feynman? The curious character who mastered thinking and physics. https://fs.blog/richard-feynman/, 2018b.
Feynman, R. P., R.B. Leighton, M. Sands, 2011: The Feynman Lectures on Physics. https://www.amazon.com/gp/product/0465023827/ref=as_at/?imprToken=rgWOtGdDFxoS05.BQXV3ZA&slotNum=0&ie=UTF8&camp=1789&creative=9325&creativeASIN=0465023827&linkCode=w61&tag=farnamstreet-20&linkId=WVPOUDQSQTDGBSRG, 2011.
Forrester, J., 1968: Principles of Systems. https://www.amazon.com/gp/product/1883823412?ie=UTF8&creativeASIN=1883823412&linkCode=xm2&tag=bookfallcom-20, 1968.
Glassman, J.A., 2010: On why CO2 is known not to have accumulated in the atmosphere and what is happening with CO2 in the modern era. Rocket Scientist Journal. http://www.rocketscientistsjournal.com/2007/06/on_why_co2_is_known_not_to_hav.html#more, 2010.
Harde, H., 2017a: Scrutinizing the carbon cycle and CO2 residence time in the atmosphere. Global and Planetary Change. 152, 19-26. http://www.sciencedirect.com/science/article/pii/S0921818116304787, 2017a.
https://edberry.com/SiteDocs/PDF/Climate/HardeHermann17-March6-CarbonCycle-ResidenceTime.pdf. 2017a.
Harde, H., 2017b: Reply to Comment on “Scrutinizing the carbon cycle and CO2 residence time in the atmosphere” by P. Köhler, J. Hauck, C. Völker, D. Wolf-Gladrow, M. Butzin, J. B. Halpern, K. Rice, R. Zeebe. https://edberry.com/SiteDocs/PDF/Climate/Reply_2017-06-27_F.pdf. 2017b.
Harde, H., 2017c: Reply to Reviewer Reports. https://edberry.com/SiteDocs/PDF/Climate/Reply-ReviewReport-Harde.pdf. 2017c.
https://drive.google.com/file/d/1jgt2Fj1zSSs8yBVdEgukSItG0LGOD0lC/view
Humlum, O., Stordahl, K., Solheim, J.-E., 2013: The phase relation between atmospheric CO2 and global temperatures. Global and Planetary Change, Vol 100, January, pp 51-69. http://www.sciencedirect.com/science/article/pii/S0921818112001658, 2013.
IPCC. Climate Change, 1990: The IPCC scientific assessment. Final Report of Working Group 1. Cambridge University Press. (pages 8 to 56/114). https://www.ipcc.ch/ipccreports/far/wg_I/ipcc_far_wg_I_full_report.pdf, 1990.
IPCC: Report 3, 2007. The Carbon Cycle and Atmosphere CO2. https://www.ipcc.ch/ipccreports/tar/wg1/pdf/TAR-03.PDF, 2007.
Joos, F., R. Roth, J. S. Fuglestvedt, G. P. Peters, I. G. Enting, W. von Bloh, V. Brovkin, E. J. Burke, M. Eby, N. R. Edwards, T. Friedrich, T. L. Frolicher, P. R. Halloran, P. B. Holden, C. Jones, T. Kleinen, F. T. Mackenzie, K. Matsumoto, M. Meinshausen, G.-K. Plattner, A. Reisinger, J. Segschneider, G. Shaffer, M. Steinacher, K. Strassmann, K. Tanaka, A. Timmermann, and A. J. Weaver, 2013: CO2 and climate impulse response functions for the computation of greenhouse gas metrics: a multi-model analysis. Atmos. Chem. Phys.. 13, 2793-2825. https://www.atmos-chem-phys.net/13/2793/2013/acp-13-2793-2013.pdf, 2013.
Kemeny, J., 1959: A Philosopher looks at Science. https://www.amazon.com/gp/product/B0020PK0BM?ie=UTF8&creativeASIN=B0020PK0BM&linkCode=xm2&tag=bookfallcom-20, 1959.
Kern, Z., M. Leuenberger, 2013: Comment on “The phase relation between atmospheric CO2 and global temperature” Humlum et al. [Glob. Planet. Change 100: 51–69.]: Isotopes ignored. Glob. Planet. Chang. 109, 1–2. http://dx.doi.org/10.1016/j.gloplacha.2013.07.002. 2013.
Kohler, P., J. Hauck, C. V ̈olker, D.A. Wolf-Gladrow, M. Butzin, J.B. Halpern, K. Rice, R.E. Zeebe, 2017: Comment on “Scrutinizing the carbon cycle andCO2residence time in the atmosphere” by H. Harde, Global and Planetary Change, doi:10.1016/j.gloplacha.2017.09.015. 2017.
MacRae, A., 2008: CO2 is not the primary cause of global warming: the future cannot cause the past. Icecap. http://icecap.us/images/uploads/CO2vsTMacRae.pdf, 2008.
MacRae, A., 2015: Presentation of evidence suggesting temperature drives atmospheric CO2 more than CO2 drives temperature. WattsUpWithThat. https://wattsupwiththat.com/2015/06/13/presentation-of-evidence-suggesting-temperature-drives-atmospheric-co2-more-than-co2-drives-temperature/, 2015.
Masters, T., R. Benestad. 2013: Comment on “The phase relation between atmospheric CO2 and global temperature”. Glob. Planet. Chang. 106, 141–142. http://dx. doi.org/10.1016/j.gloplacha.2013.03.010. 2013.
Munshi, Jamal, 2017: Responsiveness of atmospheric CO2 to fossil fuel emissions: Updated. SSRN. https://papers.ssrn.com/sol3/papers.cfm?abstract_id=2997420, 2017.
[dataset] NOAA, 2017: ESRL CO2 data beginning in 1959. ftp://ftp.cmdl.noaa.gov/ccg/co2/trends/co2_annmean_mlo.txt, 2017.
Quirk, Tom, 2009: Sources and sinks of CO2. Energy & Environment. Volume: 20 Issue: 1, page(s): 105-121. January 1. https://doi.org/10.1260/095830509787689123, 2009.
Revelle, R. & Suess, H., 1957: CO2 exchange between atmosphere and ocean and the question of an increase of atmospheric CO2 during past decades. Tellus. 9: 18-27, 1957. http://onlinelibrary.wiley.com/doi/10.1111/j.2153-3490.1957.tb01849.x/abstract, 1957.
Richardson, M., 2013: Comment on “The phase relation between atmospheric CO2 and global temperature” by Humlum, Stordahl and Solheim. Glob. Planet. Chang. 107, 226–228. http://dx.doi.org/10.1016/j.gloplacha.2013.03.011. 2013.
Rorsch, A., R.S. Courtney, D. Thoenes, 2005: The Interaction of Climate Change and the CO2 Cycle. Energy & Environment, Volume 16, No 2. http://journals.sagepub.com/doi/pdf/10.1260/0958305053749589, 2005.
Salby, Murry, 2012: Physics of the Atmosphere and Climate. Cambridge University Press. 666 pp. https://www.amazon.com/Physics-Atmosphere-Climate-Murry-Salby/dp/0521767180/ref=mt_hardcover?_encoding=UTF8&me=, 2012.
Salby, Murry, 2014: CO2 follows the Integral of Temperature, video. http://edberry.com/blog/climate-physics/agw-hypothesis/murry-salby-co2-follows-integral-of-temperature/, 2014.
Also: https://www.youtube.com/watch?v=HeCqcKYj9Oc
Salby, Murry, 2016: Atmosphere CO2, video presentation, July 18. University College London. http://edberry.com/blog/climate-physics/agw-hypothesis/murry-salby-atmospheric-carbon-18-july-2016/ Also: https://youtu.be/3q-M_uYkpT0, 2016.
ScienceNET, 2017: 10 times Richard Feynman blew our minds. https://www.youtube.com/watch?v=VxmmcwvkZeM, 2016.
Science Today. 2017: Richard Feynman’s best arguments of all time. https://www.youtube.com/watch?v=CZr39GqNEMs, 2017.
Segalstad, T.V., 1992: The amount of non-fossil-fuel CO2 in the atmosphere. AGU Chapman Conference on Climate, Volcanism, and Global Change. March 23-27. Hilo, Hawaii. Abstracts: 25; and poster: 10 pp. Available at: http://www.co2web.info/hawaii.pdf, 1992.
Segalstad, T.V., 1996: The distribution of CO2 between atmosphere, hydrosphere, and lithosphere; minimal influence from anthropogenic CO2 on the global “Greenhouse Effect”. In Emsley, J. (Ed.): The Global Warming Debate. The Report of the European Science and Environment Forum. Bourne Press Ltd., Bournemouth, Dorset, U.K. [ISBN 0952773406]: 41-50. Available at: http://www.co2web.info/ESEFVO1.pdf, 1996.
Segalstad, T. V. 1998: Carbon cycle modelling and the residence time of natural and anthropogenic atmospheric CO2: on the construction of the “Greenhouse Effect Global Warming” dogma. In: Bate, R. (Ed.): Global warming: the continuing debate. ESEF, Cambridge, U.K. [ISBN 0952773422]: 184-219. Available at: http://www.co2web.info/ESEF3VO2.pdf, 1998
Siddons, A., J. D’Aleo, 2007: CO2: The Houdini of Gases. http://www.ilovemycarbondioxide.com/pdf/Carbon_Dioxide The_Houdini_of_Gases.pdf, 2007.
Siegenthaler, U. and F. Joos, 1992: Use of a simple model for studying oceanic tracer distributions and the global carbon cycle. Tellus, 44B, 186-207. http://onlinelibrary.wiley.com/doi/10.1034/j.1600-0889.1992.t01-2-00003.x/epdf, 1992.
Spencer, R., 2009: Increasing Atmospheric CO2: Manmade…or Natural? http://www.drroyspencer.com/2009/01/increasing-atmospheric-co2-manmade%E2%80%A6or-natural/, 2009.
Starr, C., 1992: Atmospheric CO2 residence time and the carbon cycle. Science Direct, 18, 12, 1297-1310. http://www.sciencedirect.com/science/article/pii/0360544293900178, 1992.
[dataset] Wikipedia, 2017: Radio Carbon Bomb Spike. http://en.wikipedia.org/wiki/File:Radiocarbon_bomb_spike.svg, 2017.
USGCRP, 2018: Climate Science Special Report: Fourth National Climate Assessment, Volume I [Wuebbles, D.J., D.W. Fahey, K.A. Hibbard, D.J. Dokken, B.C. Stewart, and T.K. Maycock (eds.)]. U.S. Global Change Research Program, Washington, DC, USA, 470 pp, doi: 10.7930/J0J964J6. https://science2017.globalchange.gov/, 2018.
Wilde, S., 2012: Evidence that Oceans not Man control CO2 emissions. Climate Realists. http://climaterealists.com/index.php?id=9508, 2012.
Excellent! I check daily to see if the first model paper has been published. I am anxious for someone to respond to Kohler’s response (or lack thereof) to Harde.
Two small items: 1) in part 2.2 ” It assumes nature will not absorb any human emissions”. “Any” should be “some” or another comparative . 2) In part 2.3 “Feynman, 2018”. I assume the 2018 is not correct.
Thank you for this effort. Keep pushing on your “teach to world ” drive. In my opinion this mess will never stop until a majority of people, including journalists, realize the weakness of the CAGWers position. It has become so entrenched I can’t get the local Bozeman paper to print my op-ed pieces with factual statements that don’t follow the accepted Consensus”
You can find a detailed response to Kohler’s response here.
https://hhgpc0.wixsite.com/harde-2017-censored
Welcome to the post-modern world.
Jurgen
Thank you for this reference. I had not seen it nor Harde’s reply before. I will review it soon. Thanks again
Feynman died in 1988
Excellent! I check here daily to see if the first Model paper has been published.
Two small things in this one: 1)In part 2.2 “It assumes nature will not absorb any human emissions” the “any” should be Some” of another comparative. 2) In part 2.3 “Feynman, 2018”. I assume “2018” is incorrect.
Thanks again for your effort here. Keep up the push to “teach the world” as, in my opinion, this mess will not go away until most of the people, including journalists, know the weakness of the CAGWers position. I can’t even get my local Bozeman paper to print my op-ed’s if I include facts that don’t agree with the “consensus”.
Hi DMA, Thanks for your helpful comment. I fixed item (1). Item (2) is correct because it is a 2018 reference that talks about Feynman’s presentation.
Earlier versions of my paper were rejected by 3 journals solely on the basis that my paper contradicted the IPCC. No reviewer found anything wrong with my physics. In this version, I lead with why the IPCC is wrong because I want to hit reviewers in the face with this point. We will soon know if this helps.
The rejection is unfortunate and seems arbitrary at best. Did you receive any of the reviewers comments? If so, would you be willing to share them? This story of biased review is wide spread but largely denied by those that accept the IPCC view. It may be helpful to show examples as Doug Lightfoot did and are demonstrated in the Harde episode mentioned by Jurgen above.
If you are going to reference a Feynman paper you should reference Feynman’ original year of the paper via a co-reference to the researcher that referenced Feynman . The way you did it makes it seem Feynman is still alive.
Hi Alan, Thank you for your comment. In response, I have updated my first paragraph in 2.3 and the relative references.
Looking at your Fig 2 and your table 1 for human emissions, the numbers dont jive. Fig 1 has 5.4-0.2 = 5.2 as emissions and 1.9 as sink for net of 3.3 whereas table 1 has 3.3 as emissions and 1.8 as sink for net of 1.5.
Hi Alan, the IPCC uses Gigatons of carbon. I convert units to ppm. I guess I need to make that more clear. Thanks for your comment.
I think it is dangerous to use ppm because ppm is only the result of the net effect of the whole cycle. You would be better to talk in terms of Gt C or Gt CO2 because those are measured quantities of emissions. I realize that the natural emissions have a larger error factor than the human emissions. Since the ratio of increased ppm in the atmosphere depends on a lot of things, it is dangerous to say that 1 ppm always equals 2.13GtC. The air has a varying amount of H2O so the ppm comparison breaks down. Of course this doesnt invalidate your conclusions but it is safer to stick to the IPCC units of measure.
Hi Alan, I appreciate your suggestion but I have to disagree. My overriding goal is to make my paper easy to read by as many people as possible.
Almost everyone knows the ppm numbers for atmospheric carbon dioxide but virtually no one, except specialist scientists, knows how many GtC are in the atmosphere.
One of the first lessons I learned at Caltech is to always use consistent units throughout a report. So, I have chosen to use ppm.
Perhaps if these figure diagrams are that of the IPCC, you should redo the figure diagrams using your ppm numbers and place them side by side with the IPCC figure diagrams or else make this whole thing perfectly clear like you said.
Hi Alan, I added explanatory notes to the legends of Figs. 1 and 2 and Table 1 that should make the units change clear. I hesitate to modify the IPCC diagrams because then I would be accused of tampering with original data. Also, the journals do not like repeated figures because they waste journal space.
I just made several updates, mostly in the Introduction and References.
Not to make the IPCC models look “better,” if that is possible, but in fact the model don’t really assume that no human emmissions are evern withdrawn. What that apparent assumption really does is presume that all increase in CO2 is due human carbon emmission and that natural emmissions are essentially constant. That is of course nonsense to begin with and reveals that the IPCC models are worse, based on astonishingly simple minded assumptions.
Dr. Ed, I have commented before on another, similar item. Unfortunately I can’t attend the conference in Porto (very nice town BTW, if you have the time, the old library of the University there is fabulous), or we could have had a nice discussion…
The essential flaw in Harde’s work indeed is that he doesn’t understand the difference between residence time and relaxation time, as both are driven by completely different processes.
Take e.g. the massive CO2 exchange between the atmosphere and the biosphere:
Every spring lots of new leaves grow and plants remove enormous amounts of CO2 out of the atmosphere. That goes on during summer until fall, when the leaves fall down and start to decay, producing tons of CO2 back into the atmosphere. The main driver: temperature. The main flux: some 60 GtC/season in and out.
The same for the oceans: more CO2 out of the oceans during warmer seasons, more CO2 uptake in colder seasons, just the opposite as for vegetation. The main driver: temperature. The main flux: some 50 GtC/season in and out.
Total seasonal fluxes: 110 GtC in and out, net fluctuation in the atmosphere: +/- 10 GtC or globally +/- 5 ppmv, mainly in the NH where most of the vegetation resides.
Besides that, we have some 40 GtC/year of a continuous CO2 flux between warming upwelling deep oceans waters near the equator and the sinking cold waters near the poles. Main driver: temperature differences.
Total: some 150 GtC of CO2 that is going in and out within a year between the atmosphere and other reservoirs.
As the atmosphere contains some 800 GtC CO2, the residence time of any CO2 molecule (whatever the origin) is 800/150 = 5.3 years.
All these flows don’t affect the total amount in the atmosphere, as long as the sum of all ins and outs are equal. That is the case if the average pressure of CO2 in the atmosphere equals the average CO2 pressure (the equilibrium pressure) of the ocean surface for the average ocean temperature. For the current ocean surface temperature, that is about 290 ppmv.
Now humans add extra CO2 outside the natural, temperature driven cycle. Does that affect the seasonal cycle? Hardly. There is very little difference between the amounts cycling 60 years ago and today. Why? Because removing any CO2 above the old equilibrium is by increased pressure, not by temperature. That is a completely different mechanism and that has its own decay rate, completely independent of the residence time.
Based on the past 60 years of data, that e-fold decay rate (adjustment time) is:
pressure above equilibrium / removal rate
110 ppmv / 2.15 ppmv/year = about 51 years
Much slower than the residence time, but much faster than the Bern model, as there is no saturation of the (deep ocean) sinks is in sight and vegetation only grows faster with more CO2…
FE
My question is “why should the fossil fuel CO2 be considered a new or extra source? Why is it different from a new volcano or some new forest fires or a burning coal seam? The temperature moves the sources and sinks toward a balance that is never quite reached. Surely there are fluctuations in these sources and sinks greater than the whole fossil fuel source. Is the relaxation time applicable to all sources of CO2 or just human caused CO2?
DMA,
Sinks don’t make any differentiation between human and natural CO2, the IPCC never said that or implied that, it is just a wrong interpretation by some skeptics. What the IPCC says is that all increase in CO2 mass in the atmosphere is from the human contribution, as the natural balance shows more sink than source, as well as for the oceans as for vegetation. See e.g.:
https://www.pmel.noaa.gov/pubs/outstand/feel2331/mean.shtml for the oceans and
http://www.bowdoin.edu/~mbattle/papers_posters_and_talks/BenderGBC2005.pdf for the biosphere.
The CO2 fluxes can be distinguished between oceans and vegetation by looking at the O2/N2 and δ13C balances: if a CO2 change is caused by the oceans, then O2/N2 is hardly influenced, only by the O2 solubility with temperature and the δ13C level in the atmosphere goes up with the CO2 flux. If the CO2 flux is from vegetation, for each molecule CO2 moved, 1.1 molecule O2 is moved in the other direction and the δ13C level goes opposite to the CO2 flux.
Another remarkable point is that the year by year variability in natural balance is quite small, compared to the enormous – mainly seasonal – CO2 fluxes: +/- 1.5 ppmv for the extremes: Pinatubo and large El Niño’s. That variability is only half the current yearly human contribution. See: http://www.ferdinand-engelbeen.be/klimaat/klim_img/dco2_em2.jpg
That includes volcanoes, ocean surface temperature changes, coal seems/vegetation burning,…
A complete overview, why human emissions are the cause of the increase is here:
http://www.ferdinand-engelbeen.be/klimaat/co2_origin.html
That doesn’t imply that there is any danger from the CO2 increase (to the contrary…), which is a complete separate discussion than the origin of the increase…
Dear Ferdinand,
You wrote:
I agree that is what the IPCC says. However, my preprint shows (a) that this IPCC claim violates the Equivalence Principle and (b) that IPCC’s argument to support its claim fails logic.
The O2/N2 ratio confirms that burning fossil fuels decreases atmospheric O2, but the reduction of O2 has no relationship to the amount that human CO2 increases the level of atmospheric CO2.
The 13C argument also does not prove the IPCC claim. The IPCC agrees that the 13C12C ration has decreased about 20 percent, which also agrees with the data in your post. However, plant and human CO2 have only 2 percent less 13C than other sources. So, an inflow of 4 percent human CO2 and 96 percent natural CO2, cannot explain a 20 percent drop in 13C. The 13C data only prove there is something we do not yet understand about 13C.
Dear Ferdinad,
In CO2_origin you claim “There are only two fast main sources of CO2 to the atmosphere, besides the burning of fossil fuels: oceans and vegetation.” But what about the CO2 flux from the decomposition of carbonic minerals under meteoric precipitation and under different temperature conditions?
DMA,
The relaxation time is the same for any amount of CO2 -whatever the source- above the -temperature controlled- dynamic equilibrium between atmosphere and ocean surface.
The point is that over the past at least 800,000 years all changes in natural sources and/or sinks were small enough to get equalised after a few years to centuries (for the resolution in oldest ice cores) towards the dynamic equilibrium.
Human emissions are increasing – slightly quadratic – over time, which makes that at least over the past 60 years, the sinks only increased at about half the rate of the human emissions. The other half remained in the atmosphere…
Dear Ferdinand,
Welcome to the discussion. Thank you for your comments. I will reply after I finish reading the papers you linked to so I can be sure I understand your arguments.
I will be sure to check the University library in Porto.
Best,
Ed
Dear Ferdinand,
You wrote:
It is easy to falsify these assumptions.
(1) Nature itself fluctuates by more than humans emit. Therefore, nature itself would initiate any “new” process without the presence of human emissions.
(2) There is no special process that treats human-produced CO2 differently than natural-produced CO2. Any such hypothesis violates the Equivalence Principle.
(3) Outflow from the atmosphere is proportional to level (which you call pressure). This is true for both human and natural emissions, independently and in total.
(4) All sinks act in parallel, not in series. Therefore, one sink or a “new” sink cannot impede flow to another sink. Like holes in the bottom of a bucket of water, the presence of a small hole does not restrict the flow out of a larger hole. More outflow allows a lower level to balance outflow to inflow and reduces residence time.
(5) There is only one residence time, which is the equilibrium level divided by inflow, or level divided by outflow. There is no special “relaxation” time or “e-fold decay rate”. These times are imaginary inventions created to justify incorrect assumptions and incorrect conclusions.
Dear Ed,
This is a minor point, but it may be relevant to your readers. I suggest that you should not invoke Einstein, nor the “equivalence principle” in your work. In the first place, the “equivalence principle” was brought forth by Einstein to try and convince an ignorant public that gravitational mass and inertia mass are indistinguishable from one another. Physical experiment has demonstrated a 30% difference between gravitational mass and inertial mass, falsifying the so-called “equivalence principle”. (The relevant experiment was performed during the late 1990s.)
E’s version of relativity is going to be abolished soon due to overwhelming evidence that it is a non-physical swindle.
For example, see: http://www.sjcrothers.plasmaresources.com/index.html
E’s version of relativity, along with most of quantum physics, will soon be items for historical discussions.
The situation regarding E’s version of relativity is similar to the situation regarding “global warming”. Both are frauds designed to bilk money from an ignorant, brainwashed, and unsuspecting public by the use of repetitive, extensive, and expensive promotions, Hollywood-style.
Both these Hollywood productions (relativity and “global warming”) are facades made of lies and fantasies, which appear real on the surface, but on closer inspection, these structures are nothing more than “stage sets”, made of painted wood, designed to result in believable appearances for the viewers of the given Hollywood fantasy production.
Least we forget, a great deal of time and effort and money goes into making such Hollywood fantasies. And of course, those who are in positions to make vast profits from the popularity of such facades, in the public eye, take great pains to ensure the successes of their fraudulent presentations, so as to recoup their investments in the Hollywood presentations and take fraudulent profits, unmolested by facts.
The means and methods of, scams, swindles, and frauds are all based on lies, and based on appearances, while painting over the actual facts and turning the actual facts into appearing to be something else, or false.
In the words of Mark Twain, “It is easier to fool people than it is to convince them they have been fooled.”
I suggest not using the tainted term “equivalence principle”, which is bringing in a lie to try and support a valid understanding. Rather, I would point to the fact that carbon dioxide remains carbon dioxide, regardless of its position in the so-called “carbon cycle”.
Best Wishes,
Neil
Congratulations Dr. Ed!
When I saw the announcement of this conference I thought “This is where Dr. Berry should be.”
Best wishes for your trip and presentation.
I have a question.
Does Dr. Berry have a theory on the decline of O2 in the atmosphere?
I would also like to say this.
Let’s take point 2 for granted for the purpose of dialogue. It is stated “Any climate change resulting from increased CO2 is caused 96 percent by natural CO2 and only 4 percent by human CO2.”
As stated, that is rather alarming, even if one considers CO2 a minor forcing, and many consider it a major forcing.
Imagine a 4% change in albedo.
Imagine a 4% change in the ppm of aerosols.
Imagine a 4% change in cloud cover.
Imagine a 4% change in radiation coming from the sun. ( obviously that’s a very strong forcing to start with ).
Imagine a 4% change in the rate of evaporation for some hypothetical reason.
Imagine a 4% change in any of things in a very short timeframe, ( say a hundred years ).
Even if one assumes a given parameter has a minor forcing, a 4% change in that parameter, up or down, seems rationally, to be quite powerfull. 4% of something is a lot of something in my book.
The only way a 4% change can be easily dismissed is if the forcing is virtually negligible. And there is much to suggest CO2 forcing is not negligible.
Essentially what I’m suggesting is that the ability to alter a component capable of forcing by 4% ( your statement ) is extraordinary in itself.
Love to know your thoughts O2 decline.
Li D Australia
After some pondering I realise a grave error in this statement.
“Any climate change resulting from increased CO2 is caused 96 percent by natural CO2 and only 4 percent by human CO2.”
All science aside it’s not literally correct.
Let us choose a time say 10000 years ago. It would be reasonable to state Anthropogenic emissions are negligible.
( I could argue land management changes especially in Australia, may have a small impact but will ignore that for now, and in fact that impact is likely emissions neutral anyway, and it’s more of an albedo change)
So, at this time 100% of the CO2 in the atmosphere is doing whatever it does. Forcing whatever it’s forcing. This results in a climate state we can call x.
To this, add a continuous stream of 4% anthropogenic CO2. This results, after a time, when everything is balanced out, sinks have done their thing and feedbacks too, in a climate state called y.
It’s different than x.
It is reasonable to say the difference is 100% due to the introduced stream.
It’s only fair to attribute a 96% forcing
share when there is a starting point of
null or zero CO2 at all.
Again, it’s ok to attribute 96% to the new climate state y, but what you have written is that it’s the difference between x and y and that is wrong.
You might wish to reconsider or at least rephrase.
Also, I noticed in a different set of writing some analogies. None of them considered time as a relevant factor.
Li D
Australia.
Dear Li,
Thank you for your comment. I may need to improve the wording in my sentence that you quote. So I will try to explain it better.
My sentence refers to the first question, namely, “How much do human emissions increase atmospheric carbon dioxide?” And this question relates to the time after 1750.
The IPCC claims that human emissions have caused and continue to cause ALL the increase in CO2 since 1750, when it assumes the level was 280 ppm. Today the level is about 410 ppm, so IPCC claims human emissions increased atmospheric CO2 by 130 ppm.
Against that background, I conclude that human emissions today increase atmospheric CO2 by only 18 ppm and nature causes the rest of the increase. (You may challenge my scientific conclusion separately but in this discussion, we assume my conclusion is correct.)
Therefore, I conclude, if the human-caused increase is only 18 ppm out of 410 ppm, then to the extent that more atmospheric CO2 causes climate change, human emissions cause only 4 percent of that change and nature causes 96 percent.
I understand there are other ways to calculate this percentage. For example, we could use the increase above 280 ppm, or 130 ppm, as our base. In this case, I would argue that the human-caused increase is 18/130 or 14 percent and nature has caused 86 percent.
Either way, my point (based upon my conclusion which I said you can challenge separately) is that it is wrong to claim human emissions cause ALL the increase in atmospheric CO2 since 1750. Therefore, it is wrong to claim human emissions cause ALL of any CO2-caused climate change since 1750. Nature has been the dominant party in any such change.
Thank you for reply.
I remain certain the wording is inaccurate. What you describe as the ” base ” is wrong.
The base is zero atmospheric content ( and zero forcing ).
One has a pile of 4 four bricks stacked vertically at a moment in time to create height x.One brick is then added on top resulting in height y. The change in height is 100 percent due to the fifth brick.
The change in height is directly comparable to your line
“Any climate change resulting from increased CO2…”
I hope this is clear now.
Li D
Australia
Hi Ferdinand, Li, and everyone else,
I just noticed all the figures are missing in this post and in all my posts. I need to fix this before continuing the discussions. This happened after I migrated my site to a new server just 2 days ago. I did not notice this error until now. So, without the figures, you really cannot understand my post.
Ed
Dr. Ed,
Indeed did miss the figures, but am familiar enough with the IPCC graphs to know the background… We will wait until they appear…
The images links are now fixed but I need a day off. Too intense pretending to be a geek.
Dear Dr. Ed,
Back to basics…
The first problem I did see was in table 1. That is based on the IPCC’s Fig.1 &2 where the natural fluxes were shown when in balance. Then you give the human contribution as 3.3 ppmv/year of which 1.8 is removed and 1.5 ppmv/year remains in the atmosphere.
That is not what the IPCC said or implied. There is no (or hardly) any human contribution in the removal of any CO2. All human CO2 in the first place is emitted into the atmosphere and it is the extra pressure which increases the natural sinks (and decreases some natural sources). That makes that the natural fluxes are not anymore in balance and you need to add the “human sinks” to the natural sinks as a mix of both, as there is no differentiation of the sinks between human and natural CO2 (except for the small isotopic changes)
Let us show that with as start the natural fluxes in balance at 290 ppmv (for the current ocean surface temperature) and a yearly addition of 3.3 ppmv “human” CO2:
Year 1:
290 ppmv + 3.3 ppmv = 293.3 ppmv (a mix of 1.1% human and 98.9 natural CO2)
extra pressure: 3.3 ppmv
sink rate from the extra pressure: 3.3 * 0.02 = 0.07 ppmv (of which 1.1% human)
(0.02 := 2.15/110 is the linear sink rate for any extra CO2 above the dynamic equilibrium as seen in the past 60 years)
net increase: 3.23 ppmv, entirely caused by the human addition.
new level: 293.23 ppmv
Year 2:
293.293 ppmv + 3.3 ppmv = 296.593 ppmv (whatever the mix human/natural)
extra pressure: 6.593 ppmv
sink rate from the extra pressure: 6.593 * 0.02 = 0.13 ppmv
net increase: 6.58 ppmv, entirely caused by the human addition.
:
:
Year X:
400 ppmv + 3.3 ppmv = 403 ppmv (with about 10% human CO2 in the mix)
extra pressure: 113 ppmv
sink rate from the extra pressure: 113 * 0.02 = 2.26 ppmv
net increase: 1.04 ppmv, entirely caused by the human addition.
FIgures are not exact what is measured today, as humans started with very small emissions, increasing slightly quadratic over time and currently about 4.5 ppmv/year. That made that both the sinks and the increase in the atmosphere also increased slightly quadratic over time at about half the rate of human emissions. Just coincidence as result of the increasing emissions… See;
http://www.ferdinand-engelbeen.be/klimaat/klim_img/temp_emiss_increase.jpg
Dear Ferdinand,
Thank you again for your comment. I will respond to your most recent comment first, while I acknowledge I owe you replies on your earlier comments.
My Table 1 shows exactly what the IPCC claims in its two figures. Whether or not IPCC’s figures were what IPCC “said or implied” is open to question. In either case, IPCC’s figure for human CO2 is wrong. It does not comply with the proper use of systems models and it violates the Equivalence Principle. Further, as I show in my Section 2.3, IPCC’s Bern model shows that the IPCC used its assumption shown in my Fig. 2, in its climate models.
Please note that your use of the term “pressure” is likely the same thing I call “level.” The partial pressure of CO2 in the atmosphere is directly proportional to level, and an increase in level increases outflow. Alternatively, your term “pressure” may mean inflow.
The problem I find with your year-by-year examples is they have no model to back them up. They merely assume the IPCC assumption is correct. But you can’t prove an assumption is correct by using the assumption in an argument.
In my Section 3, I propose a model to explain how the atmosphere processes inflows of CO2. My model is the ultimate in simplicity, so it has the advantage of Occam’s Razor. Uniquely, my model exactly reproduces the decay of 14C data following the termination of atomic bomb tests. So, until a better model comes along that can also reproduce the 14C data, I propose my model best explains how 12C CO2 flows through our atmosphere.
My model shows how inflows set equilibrium levels, and how the existing level will move towards its equilibrium level until outflow equals inflow. My model allows calculation of human CO2 and natural CO2 either independently or in total.
Your examples use temperature increase to calculate an increase in “pressure.” My Section 2.6 mentions how my model can include this effect. My model suggests temperature increase will increase inflow rather than directly increasing the level.
In summary, I think my model explains what happens to human CO2 more accurately than your examples. I think your examples use the unwarranted IPCC assumption, namely, that human emissions are the primary cause of the increase in atmospheric CO2 since 1750. Before you can use that assumption, you must provide a good argument to support the assumption. My Section 2.2 proves the IPCC argument for the assumption is wrong.
Dear Dr. Ed,
It is not the first time that the IPCC wordings and graphs are too simplistic that these can be misinterpretated.
That happens here again. Take their Fig. 3.1.b (your figure 1b), where they show the human perturbation. That shows human emissions and part of that is taken away by plants and oceans. That can be misinterpretated as that plants and oceans specifically absorb 50% of the original human emissions, but the IPCC never said that or implied that. All what they imply is that the extra CO2 input (not even from one year) caused the extra CO2 output, whatever the origin of the input (in this case known) or CO2 removed. They give a hint in the text:
“These uptake components represent imbalances in the large natural two-way fluxes between atmosphere and ocean and between atmosphere and land.”
What they say is that the imbalance between natural sources and sinks is caused by the human perturbation, not that the sinks prefer human CO2 above natural CO2…
Indeed level and pressure are intermixable in this case, only pCO2 is usually in real air and ppmv is in dry air, but that difference is not relevant here.
“The problem I find with your year-by-year examples is they have no model to back them up.”
My “model” is the same as in your Fig 4, with one essential difference:
The equilibrium level is not set by the inflow, but by the temperature of the ocean surface layer.
If the natural inflow increases by e.g. 10% (a huge change!) by increasing upwelling waters near the equator, initially the CO2 level will go up, but that will get compensated by increasing sinks until the CO2 level again matches the average pCO2 of the oceans, at a higher level (about +30 ppmv).
The point is that there is zero evidence of any increase in natural CO2 inputs. There is hardly an increase in the seasonal cycle and no measurable increase in the equator-poles flux.
The equilibrium between atmosphere and ocean surface is governed by Henry’s law and the solubility of CO2 in seawater with temperature. That level is exactly the same for one sample of seawater in a closed bottle as for the dynamics of the full ocean surface, including the exchanges with the deep oceans. That is confirmed by over 3 million seawater samples taken over the centuries.
Then my take on what happens in the atmosphere:
if a system in dynamic equilibrium is disturbed by a perturbation, then the equilibrium will react by compensating for the perturbation (Le Chatelier’s principle).
In the case of the extra CO2 above equilibrium, the reaction of the sinks is surprisingly linear:
In 1959: 25 ppmv extra above equilibrium, sink rate 0.5 ppmv/year, 50 years e-fold decay rate
In 1988: 60 ppmv, 1.13 ppmv/year, 53 years e-fold decay rate
In 2012: 110 ppmv / 2.15 ppmv/year = 51.2 years
The imbalance between natural sources and combined sinks is simply linear with the extra amount of CO2 above equilibrium.
There is a big problem with using the 14C decay rate as example for the 12CO2 decay rate: what is going into the deep oceans in 1960 was the 14C level of that time, what comes out is the 14C level of ~1000 years ago, less than half the level of the 1960’s. That makes that the extra 14C decay is about 3 times faster than an extra 12CO2 decay. Even so the 14C decay is 3 times longer than the 5.3 years residence time… See:
http://www.ferdinand-engelbeen.be/klimaat/klim_img/14co2_distri_1960.jpg
More about the difference between residence time and decay rate coming…
Dear Ferdinand,
You do a very good job of explaining your position, and I appreciate it. So, to continue:
If you used the same model as in my Fig. 4, then you would agree that emissions set inflow, and inflows set equilibrium levels, and actual levels will approach their equilibrium levels with a 1/e residence time.
My model describes the only way our atmosphere can balance changing inflows. It does it by adjusting the level until outflow equals inflow. My model describes how nature balances. The IPCC merely claims nature balances without understanding how it balances. Which is why the IPCC makes serious errors in physics.
A key insight from my model is that inflows do not continue to add to the level. Inflows merely set equilibrium levels. So, if human emissions add 4 percent to nature’s inflows and then remained constant, these human inflows would add 4 percent to nature’s level and no more. No human CO2 would stick forever or have a longer residence time than the level divided by the outflow.
It is even worse for the IPCC. According to its claims and core argument, even an addition of human CO2 less than one-percent of nature’s emissions would have started the buildup of CO2 in the atmosphere. The IPCC argument implies even the addition of one human-produced CO2 molecule would have initiated an irreversible process. Fundamentally, the IPCC model does not work.
All processes external to the atmosphere system can affect the atmosphere level only by changing the inflow or outflow. No external process can change the level directly. To claim otherwise invalidates the systems model. That applies to your claim that the temperature of the ocean surface layer sets the equilibrium level. It can’t. It can only change the inflow to the atmosphere system. Then the atmosphere will change its level according to inflow and outflow.
All arguments that claim an external process directly changes the level are invalid. All arguments that claim human emissions add a new, very-long residence time are invalid. Because if they were valid then nature itself would have gone unbalanced long ago.
Regarding the 14C data, the data clearly show how the 14C CO2 outflow exceeded its inflow. The natural inflow supports the 100 percent equilibrium level while the outflow was proportional to the level. Since my model properly uses inflow and outflow, my model nails the 14C data when its residence time is set to 14.4 years, equal to a half-life of 10 years. The slow processes in the deep ocean are irrelevant to this simulation. One only needs to set the 12C CO2 residence time to level divided by outflow to set the model to simulate 12C CO2.
This test is very relevant to any model that purports to model CO2 in the atmosphere. My model passes this test and the IPCC model fails this test. This proves it is not valid to support the IPCC model.
I think all your arguments are based upon the invalid IPCC model.
Dear Dr. Ed.
I do use your model, but I disagree that the natural inflows set the setpoint of the CO2 levels in the atmosphere. That would only be the case if there were huge changes in the natural inflows, for which no evidence exists.
The equilibrium level in the past 800,000 pre-industrial years was set by temperature and the CO2 solubility in seawater, while in/outflows were adjusted accordingly. Over glacial and interglacial periods, there is a quite linear relationship of about 8 ppmv/K for Antarctic temperatures. Adjusted for the polar enhancement in temperature, that translates to about 16 ppmv/K, not by coincidence the measured change in solubility of CO2 in seawater:
http://www.ferdinand-engelbeen.be/klimaat/klim_img/Vostok_trends.gif
Thus in “my” (and the IPCC’s) model, ocean surface temperature sets the equilibrium level by adjusting the natural CO2 inflows and outflows, mainly from/to the oceans. Have a look at how that happens:
In https://www.pmel.noaa.gov/pubs/outstand/feel2331/exchange.shtml
Feely e.a. show that the pCO2 of the oceans ranges from about 750 μatm in the tropics to about 150 μatm at the poles. In both cases that implements a CO2 flux of about 40 GtC into the atmosphere at the equator and 40 GtC out near the poles. Any CO2 flux over the air-water border is linear in ratio to the pCO2 difference between both.
If the temperature of the ocean surface increases everywhere with 1 K, the pCO2(aq) of the sea surface will increase everywhere with about 16 μatm. That increases the CO2 input near the equator with (750+16-400)/(750-400) or near 5% for 400 μatm in the atmosphere. The opposite happens near the poles with a reduction of the outflow of near 5% too. The net effect is that the CO2 level in the atmosphere increases until inflows and outflows are equal again at about 16 ppmv above the old equilibrium. The same 16 ppmv/K as for warming a single sample of seawater… See:
http://www.ferdinand-engelbeen.be/klimaat/klim_img/upwelling_temp.jpg
The fundamental difference between the approaches thus is that in your case the inflows govern the equilibrium, while in my (and the IPCC’s) case temperature governs the equilibrium. The latter is what is observed over the past 800,000 years (and beyond).
The other fundamental difference between us is that once in equilibrium, indeed one CO2 molecule extra disturbes the equilibrium, whatever the quantities involved in maintaining the equilibrium. That is for next reaction…
Dear Dr. Ed,
Now again about residence time and excess decay rate…
In essence, it is the same discussion as about the turnover of goods and thus capital in a factory and the gain (or loss) of capital of the same factory at the end of the fiscal year. The residence time of capital in a factory has little connection to the final result of the same factory. If you double the turnover, the factory may lose money, get a break even or make more profit…
To begin with, the residence time of CO2 in the atmosphere indeed is total amount / throughput. using IPCC figures, that is about 800 GtC / 150 GtC/year or a residence time of 5.3 years.
Remark: some 60 GtC/year from the 120 GtC/year between atmosphere and vegetation is diurnal: 60 GtC absorption during the day, 60 GtC respiration at night. That doesn’t even reach the bulk of the atmosphere and is only locally measurable, and doesn’t influence global levels.
What about the rest of the 150 GtC? As said before, there is never 150 GtC extra in the atmosphere at any moment in time. Indeed almost all in and out flows work in parallel and compensate each other: sinks at the poles compensate for inputs at the equator, ocean emissions are (over)compensated by vegetation uptake. Thus the real natural input at any moment in time is near zero (with a + and – 10 GtC unbalance over the seasons). Thus there is near zero reason for the sinks to go beyond the inputs, as there is near zero increase of pCO2 in the atmosphere from the natural inputs at any moment in time (and the seasonal disturbance is as well positive as negative).
The only drive to increase the outputs is if the total amount of CO2 in the atmosphere increases, which is only possible by adding some extra CO2 beyond the natural inputs. Then the extra output is enturely caused by the extra input above the natural ones.
Any limited amount of extra CO2 added doesn’t change the residence time that much (some 4% in IPCC figures), but it adds to the total CO2 pressure in the atmosphere above the temperature dictated equilibrium. That causes the extra output with its own decay rate of around 50 years. Nothing at all to do with the residence time.
Arthur Rörsch e.a. could show 6 different ways to calculate different possible causes of the increase of CO2 in the atmosphere. All 6 were mathematically possible, but only one did fit all observations: the human contribution. All the others did violate one or more observations.
That includes the increase from natural inflows, as that violates the mass balance, the δ13C balance, the solubility of CO2 in seawater,…
Dear Ferdinand,
Where did you find the sink rates you used in your example?
Dear Dr. Ed,
Sink rates are emission inventories minus measured increase in the atmosphere, the latter averaged to avoid the year-by-year variability in sink rate ( which is BTW dominated by the uptake/release of the tropical forests).
Carbon dioxide emissions inventory from the US Department of Energy (DOE):
http://www.eia.doe.gov/pub/international/iealf/tableh1co2.xls
updated for recent years at:
http://www.eia.gov/cfapps/ipdbproject/IEDIndex3.cfm?tid=90&pid=44&aid=8
Yearly averaged carbon dioxide concentrations at Mauna Loa Observatory, Hawaii, 1958 to last full year, NOAA:
ftp://ftp.cmdl.noaa.gov/ccg/co2/trends/co2_annmean_mlo.txt
In graph form:
http://www.ferdinand-engelbeen.be/klimaat/klim_img/dco2_em2.jpg
Ferdinand
The graph in the last link does not say anything about the total sink rate other than it is greater than the human emission rate. If there are any other emissions that could be quantified they would form a similar graph. The important graph is total emissions less total sinks which is basically the Mona Loa record. The problem is that total emissions is not known very well and the uncertainty in that number is far greater than the whole human emission figure. For the referenced graph to show the total sink rate you have to assume that human emissions are the only increasing source but I don’t think that is a valid assumption. If it is, what mechanism controls the growth of atmospheric CO2 such that increases or decreases in the human emission rates don’t effect the rate of increase shown in the Mona Loa record?
DMA,
It doesn’t matter at all what the total (natural) emissions are, it only matters that human emissions are larger than the net result of all natural emissions and sinks together.
Take a local bank, where you have a deposit. Each month you save $ 100 to your account, no withdrawals.
At the end of the fiscal year the local bank shows its annual revenue: a net gain of $ 600.
Does it matter how much the thousands of other clients have saved or withdrawed in the same year?
Not at all: without your savings, the bank would have shown a net loss.
In figures:
Increase in the atmosphere = natural emissions + human emissions – natural sinks
If natural sources were 10 GtC:
4.5 GtC= 10 GtC + 9 GtC – Y GtC
Y = 14.5 GtC
For 150 GtC (current estimates):
4.5 GtC = 150 GtC + 9 GtC – Y GtC
Y = 154.5 GtC
For 1000 GtC:
4.5 GtC = 1000 GtC + 9 GtC – Y GtC
Y = 1004.5 GtC
Even if one doesn’t know any individual natural CO2 flux, one knows the net result of all natural in and out fluxes together and that result is negative for each year in the past 60 years. Thus the natural cycle is not responsible for the increase of CO2 in the atmosphere…
DMA,
Should have added that the sink rate in the graph is not caused by the human emissions of one year, but of the total amount of CO2 in the atmosphere above the (temperature controlled) equilibrium between the atmosphere and the ocean surface. That the sink rate is half the emissions is pure coincidence and the result of the slightly quadratic increase in emissions over time with as result a slightly quadratic increase in the atmosphere and thus of sink rate…
If e.g. last year the emissions would be 10% lower than in previous year, then the net effect would be a smaller increase in sink rate, as the increase in the atmosphere would be 4 GtC i.s.o. 4.5 GtC or from 110 ppmv up to 112 ppmv above equilibrium i.s.o. 112.3 ppmv, hardly measurable in the temperature caused year to year variability of the CO2 increase.
Edwin,
The roof leaks at the top.
Climatology has certain traditions that it adopted from its parent discipline, meteorology. One of those traditions is that their theoretical aspects are based on conversation and not empiricism. Or, I guess we could say, the connection to empiricism is suggestive and not literal.
In empirical sciences the experimental evidence comes first and the narrative follows. In conversational sciences the narrative comes first and its significance is interpreted by “experts.” No empiricism necessarily follows. And any empiricism that is externally applied is summarily dismissed if it disagrees with the “expert” opinion.
In short, with conversational sciences like meteorology and climatology, truth is determined by consensus and authority.
The public is naïve, gullible, and generally unaware that climatological conclusions, like global warming, are based on conversation and not empiricism.
Exposing climatology as empirically inept won’t solve the problem since the conversational tradition is rooted in meteorology and not climatology
The roof leaks at the top:
The ‘Missing Link’ of Meteorology’s Theory of Storms
https://www.thunderbolts.info/forum/phpBB3/viewtopic.php?f=10&t=16329
James McGinn / Solving Tornadoes
Hi James,
You write, “conversational sciences like meteorology and climatology, truth is determined by consensus and authority.” Your view is a diversion from the truth. It is a political attempt to diffuse the fact that the alarmist version of climate change is wrong. Nice try.
Those who base meteorology and climatology on consensus and authority are substituting politics for science. You are merely describing how the alarmists turn science into politics but that does not change the truth about the science.
The sciences of meteorology and climatology derive from physics, chemistry, and geology, and they are based on evidence. My post proves the alarmist version of climate change violates physics. Therefore, the alarmist version of climate change is scientifically wrong.
Hi Dr. Ed,
Thank you for such a rapid response.
You write: “Your view is a diversion from the truth. It is a political attempt to diffuse the fact that the alarmist version of climate change is wrong. Nice try.”
I am on your side. I disproved the alarmist version of climate change a long time ago, as have many others both before and after my disproof. My disproof is generally ignored. The same will be the case for yours as the novelty wears off. Welcome to the club.
Climatology and meteorology are not beholden to empiricism. For example, the convection model of storm theory is not based on anything empirical–it has never been tested, measured or concisely defined (just like AGW). It is based on an analogy to a pot boiling on a stove. Likewise global warming is based on an analogy to a greenhouse.
Most people are incredulous that conversational sciences can possibly be as effective as I am suggesting here. I am guessing you are incredulous that you can be so easily fooled. You are wrong. And you can prove it to yourself by way of coming to grips with the fact that you never noticed that the empirical basis of the convection model of storm theory is nowhere to be found.
I discovered the empirical shortcomings of meteorology after I discovered them in climatology. My reasoning was very simple. Knowing that the origins of climatology are in meteorology, I reasoned that if AGW is as bad as it appears then meteorology must also have skeletons in its closet. So I did something that nobody has done before, I looked at the convection model of storm theory with scrutiny. I found numerous fatal flaws and I found that meteorologists have long ago established a tradition of ignoring these fatal flaws.
My point is that you/we cannot defeat a conversational science based on empiricism because conversational sciences are based on allegories that appeal to the base sensations of the public. The only way to defeat a conversational science is to reveal it as such to the public. And the best way to reveal it to the public is to start with meteorology since this is the spring from which it sprang (or is it sprung?). The conversational tradition is the problem and its roots are in meteorology, not climatology.
James McGinn / Solving Tornadoes
The Moist Air Convection Myth
https://www.thunderbolts.info/forum/phpBB3/viewtopic.php?f=10&t=16462
Dr. Ed,
In the hope that I have pricked your interest and not your ire, here are some more details on my theory of storms and atmospheric flow.
Starting from jet streams, vortices grow (upstream) along wind shear boundaries in the troposphere (mostly along the top of the troposphere) channeling low pressure energy, targeting moist air at lower altitude, deliver this low pressure energy to various locations on the surface of our planet, causing uplift of this moist air and what we witness as storms. This–vortice activity–is what underlies storms, not convection.
Convection of moist air does occur but its role in this theory is much more subtle than is its role under the convection model of storm theory. And, in stark contrast to the convection model, moist air has negative buoyancy (moist air is heavier than dry air). (Negative buoyance of moist air is instrumental in the formation of long, flat moist/dry wind shear boundaries that are essential for the formation of a water-based plasma that forms the sheath of vortices–a plasma that literally spins up on wind shear boundaries.
Vortices are the pressure relief valves of the atmosphere. In other words, vortices are the means by which relative thermal equilibrium is achieve on the surface of our planet:
http://www.thunderbolts.info/forum/phpBB3/viewtopic.php?f=10&t=17125
Dear James,
Thank you for your comments. In my view, you do not understand what you think you understand about meteorology. Somewhere, years ago perhaps, you got off on the wrong track.
So, while your comments are welcome, I am much too busy to make the necessary extensive replies it would take to show you why your views on meteorology are completely wrong. I suggest you study some good textbooks on meteorology and atmospheric physics.
You got nothing!!!
Ivar Giaver states:
Global warming has become a new religion, because you can’t discuss it. And that’s not right. So, science comes in many forms: 1) real science; 2) pathological science, where one fools oneself; 3) fraudulent science, which is rare; ; 4) Junk science; 5) pseudoscience.
JMcG:
Just like global warming, meteorology’s theory on storms and atmospheric flow is a religion. Because you can’t discuss it. And that’s not right. As you have demonstrated vividly in this thread, you (Ed Berry) cannot/will not discuss it.
So, it certainly is not #1, real science. I don’t think you are being deliberately fraudulent. So that leaves 2) Pathological science, 4) Junk science, and 5) pseudoscience. I suppose we can let our audience decide which of these three is most applicable.
There are three blatantly non-scientific notions associated with meteorology’s “convection model” of storms and atmospheric flow: 1) Convection, 2) Dry layer capping, and 3) Latent heat. All of these are based on notions that involve half-baked observations, cartoonishly silly analogies, and blatant speculation.
Convection: Based on an analogy to a pot boiling on a stove. It is poorly defined, immeasurable, untested and untestable. It was proposed as a conjecture by Espy, pre civil war, and was accepted by consensus despite never having been tested empirically. It’s underlying theory is wrought with unverified assumptions, like the notion that H2O magically turns gaseous at temperatures far below what has ever been detected in a laboratory.
Dry layer capping: Based on observation of dry layers above flat moist layers. It explanation involves the blatantly stupid assertion that dry layers of gaseous air have structural capabilities. (Meteorologists are especially strict about maintaining the vagueness of this explanation.)
Latent heat: Based on the observation that evaporation produces cooling and the not unreasonable assertion that uplift of moist air and resulting condensation produce warming at higher altitudes. But–strangely–this notion is also harnessed to explain the cold gusty winds of storms and lateral flow (“advection). And so, in a desperate bid to explain the energy of storms, meteorologist dramatize latent heat as kind of magic wand that they then abuse to explain all of the remaining drama of storms.
Nothing about Meteorology’s theory on storms doesn’t maintain some degree of blatantly obvious stupidity–thus the reason none of these pretentious believers–virtually all meteorologists (except myself)–will discuss it.
What is, in my opinion, and even more glaring shortcoming of this convection model of storm theory is what it fails to explain: 1) the spinning motion witnessed in storms, 2) the lateral flow associated with jet streams, and 3) vortices.
Since the climate dopes have employed the same pseudoscientific methods that have been long championed by meteorologists, it is blatantly hypocritical for Ed Berry to be dumping on climate scientists who are doing nothing but following the example that Ed and all meteorologists have established a long time ago.
Why Meteorology (Storm Theory) is a Cargo Cult Science
http://www.thunderbolts.info/forum/phpBB3/viewtopic.php?f=10&t=16613
James McGinn / Solving Tornadoes
Dear James,
You have done a lot of handwaving about your theory of storms. But you have not produced any evidence to show how accepted meteorology is incorrect. Evidence means data. Yet, you have accused me and all credible meteorologists of being hypocritical.
So, to back up your claims, can you show examples where the following meteorological textbooks have made errors that conflict with data?
Hess: Introduction to Meteorology
Fleagle and Businger: An Introduction to Atmospheric Physics
Haltiner and Martin: Dynamic and Physical Meteorology
Mason: The Physics of Clouds
Salby: Physics of the Atmosphere and Climate
Khvorostyanov and Curry: Thermodynamics, Kinetics, and Microphysics of Clouds
Please be specific by referring to equations, paragraphs, and pages that disagree with your claims. When you have proven your competence, we and other visitors on this site can have a scientific discussion of your personal theories that contradict data and are therefore wrong.
Surely, if you are competent, this task will be easy for you.
Dear James,
I agree with your views regarding electric weather. If you haven’t read these articles yet, I think you might like them:
https://www.thunderbolts.info/wp/2017/04/22/natures-electrode/
https://www.thunderbolts.info/wp/2017/05/21/the-summer-thermopile/
https://www.thunderbolts.info/wp/2017/06/13/tornado-the-electric-model/
Best Wishes,
Neil
This is the tactic all religions employ when confronted with skeptics. “Here is a bible. Prove to me that this is not the word if God. ”
Sorry, but in science the burden of proof is on those that make extraordinary claims. I do not maintain that water turns gaseous at temperatures far below its known boiling temperature. You do. I do not maintain that dry air acts as a flat shield to contain upwelling moist air from below. You do. I do not maintain that latent heat somehow (magic I presume) causes the gusty winds of storms. You do.
Of course you have zero chance of substantiating any of this. But that is not my problem. You believe it. Not me.
Defend what you believe. Or admit what is plainly obvious–you have not thought about any of this since it was introduced to you as an undergrad.
James McGinn / Solving Tornadoes
Dear James,
The spam filter caught all your comments that followed my request that you detail your position so we could have a scientific conversation. The spam filter apparently rejected your comments after you began using “SOB” in your replies.
Your reply above to my request demonstrates that you are a fraud. You claim, without proof, that I “believe” certain things that you disagree with. Likely, you are unable to understand any parts of the standard meteorological books I listed. I gave you the opportunity and you failed. You did not find anything in the six textbooks I listed to demonstrate your claims.
You are a simply another moronic blowhard climate alarmist from San Jose, California, who does not understand science or meteorology or climate.
Bye.
Dr. Ed
In trying to explain your preprint concept to a friend I happened onto what I think is good physical example. It was fairly easy for him to grasp. I wrote a letter to the Bozeman Chronicle but doubt they will print it. They rarely print mine that contest the consensus position. I share the LTE with you for your review:
I recently saw an analysis of the effect of uncertainty in atmospheric CO2 flux , (https://tambonthongchai.com/2018/05/31/the-carbon-cycle-measurement-problem/), that confirms the the work of Professor Salby, Professor Harde and Dr. Barry showing that human emissions have little effect on the total amount of CO2 in the atmosphere. I thought of a reasonable example to illustrate this point.
Suppose you have a very accurate gauging station on the Gallatin and another accurate gauge on Haylite Creek. You note that the increase in Haylite flow exceeds that for the Gallatin. Without knowing the other inflows and outflows you cannot assert that all of the increase in the Gallatin came from Haylite . Changes in Cottonwood Creek and Taylor Fork and all the others as well as the canal take outs make that assertion impossible. It is only valid to say the Haylite flow increase was larger than Gallatin increase. Even if the Gallatin flow had been nearly constant each year for the whole record and showed a small percent increase in the same years as Haylite’s increase you cannot conclude the increase was due only to the one well measured stream.
The comparison with CO2 is obvious: We have good data showing fossil fuel emissions are larger than atmospheric increase but huge uncertainties in other much larger sources and all sinks. The referenced analysis concludes “ Therefore, the IPCC carbon cycle balance does not contain useful information that may be used to ascertain the impact of fossil fuel emissions on the carbon cycle or on the climate system.”
In my words, the human addition to CO2 is lost in the natural CO2 cycle noise and its effect on global temperature is undetectable. The IPCC’s contention that all recent increases are human caused is indefensible. Reducing human emissions is all pain no gain.
It was the use of the local drainage my friend was familiar with that helped him see how it has to work.
Have we definitely agreed that the anthropogenic contribution is only 18 ppm while the natural emissions make up all of the remaining 392 ppm? To my thinking, until that proportion is agreed upon by all involved in the discussion/debate, the remainder of the article is simply speculation.
Where have I gone wrong?