
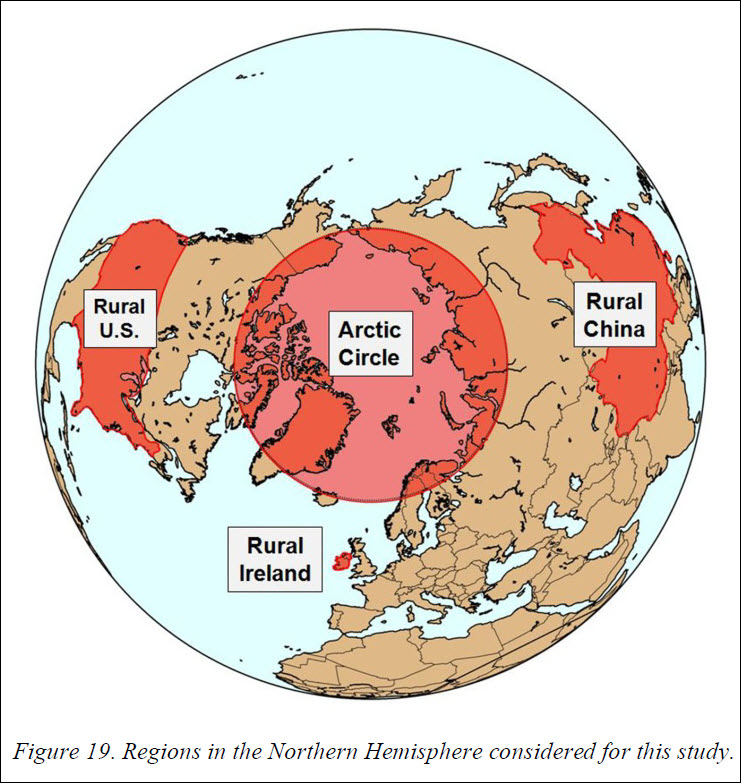
Willie Soon, Ronan Connolly, and Michael Connolly published a peer-reviewed professional paper that shows our sun, not our carbon dioxide, causes climate change. They show atmospheric greenhouse gas concentrations are insignificant to climate change. They used northern hemisphere data from 1880 to 2014.
You can read their whole 49-page paper (like I did) if you want all the scientific details. Here is my (Ed Berry) summary of their paper.
First, they constructed the best possible temperature record from 1880 to 2014. Remarkably, no one had ever done this before. This required using only surface temperature data from stations not affected by a changing environment.
They show their temperature record is compatible with temperature trends derived from sea surface temperatures, glacier length records, and tree-ring widths.
Their corrected “composite” temperature record shows warming from the 1880’s to 1940’s, and from the 1980’s to 2000’s, with a cooling period from the 1950’s to 1970’s. The record shows the current warm period is similar to the previous warm period from the 1880’s to 1940’s.
They show climate models do not reproduce the correct temperature record when backtested. This means, of course, climate models are of no value in making climate predictions. The reason is obvious. Climate models do not properly simulate the physical effects of carbon dioxide, water vapor, clouds, aerosols, and solar irradiance.
Second, they constructed the best possible record for Total Solar Irradiance. Then they compared their data.
Here is their four-piece summary chart. The blue circles are the annual temperature data. The bold blue line is the smoothed temperature data. The blue lines are the same in all four charts.
The red dashed lines are what they call the “modelled” temperatures.
The top chart (a) compares the CO2 modelled temperature with actual temperature. The next chart (b) adds the solar correction to the CO2 model. This fails because the CO2 model already “muddied the water.”
The third chart (c) compares the Total Solar Irradiance modelled temperature with actual temperature. The next chart (d) adds the CO2 correction to the solar model. The difference between (c) and (d) is insignificant.
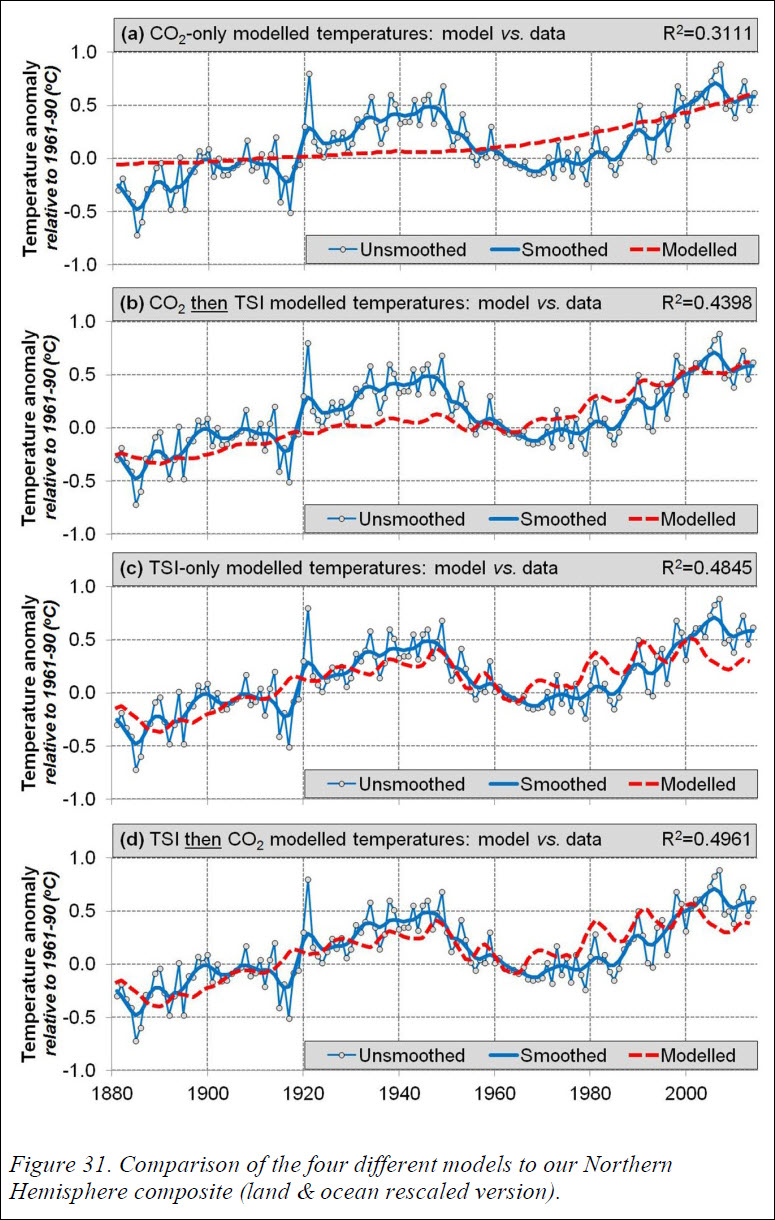
Charts (c) and (d) show our sun causes most climate change. Ocean currents, volcanoes, and other natural forces cause annual deviations from the solar prediction.
Finally, here’s how to determine your belief in climate change:
If you truly believe the red CO2 line in chart (a) fits the blue Temperature line better than the red Solar line in chart (c), then you are a true believer in Al Gore and Obama’s version of climate change.
But if you believe the red Solar line chart (c) fits the blue Temperature line better than the red CO2 line in chart (a), then welcome to the world of reality.
Clearly, climate model predictions as reproduced in chart (a) do not represent reality. Therefore, the global warming, climate change promoted by our government, our schools, and our media is a hoax.
In conclusion, our sun, not our carbon dioxide, drives climate. Even if we stopped all carbon dioxide emissions from all humans on our planet, we would not change the climate.
First Class, Dr. Ed! I've been waiting for a succinct, not too lengthy analysis such as this to utilize in my e-mail battles w/ the Left – be it LA Times editorial writers or my ignorant friends in Canada.
Thanks again,
Peter
If you use data on itself you come up with some pretty good results. Nice try.
Excellent summary
Hi Ed,
You write: "Second, they constructed the best possible record for Total Solar Irradiance. Then they compared their data."
I read much of the paper but I think they said TSI has a lot of controversy and big differences between scientists. So really, they took the data that fit their curve …. Especially since TSI has been relatively flat for 35 years … and they say their land temps correlated with ocean temps?? Aren't ocean temps rising for the past 35 years?
What do you think?
Are you seriously trying to claim that Willie Soon was not getting paid corporate money for this paper? He's infamous as the poster child for such paid shilling.
BS! Focus on the data, the paper and the message, if it is wrong, it's wrong no matter who paid who. If it is right, it is right no matter who paid who ..
But it is not wrong as you confirm by focusing on BS!
Pinker Et Al 2005, Svensmark Et Al 2009
This paper tells us what we already knew, but can't be said too often, – the sun controls the climate as it has always done. There's no new energy being produced in the atmosphere by CO2, ref.: https://roaldjlarsen.wordpress.com/2015/12/04/no-…
Dear Steve,
They use the Hoyt & Schatten TSI dataset. On page 41 of their manuscript they write:
"Moreover, the Hoyt & Schatten dataset was originally constructed in 1993 (Hoyt & Schatten, 1993). So, the fact that the correlation still seems to hold for the updated dataset with more than 20 years extra data (Scafetta & Willson, 2014) supports the idea that it is not just a coincidental correlation."
Dear Cal,
What is your point? It would not change the scientific result of Soon's paper if Obama or Putin paid him.
Willie and his co-authors say they did their paper on their on dime. I have no reason to doubt them. Do you have proof otherwise? If so, let's hear it.
You take the position of global warming fanatics who think every scientific paper that disagrees with their opinions is a devious way to change their minds.
Global warming believers are no different from right-wing evangelicals who sincerely believe the earth is 6000 years old. They can't change their opinions because they also believe any information to the contrary comes from the devil.
Belief in global warming is a religion, not a science.
The scientific method requires we reject a hypothesis when it conflicts with data. To find truth, we must be willing to reject our beliefs that conflict with data. There is no other way.
Not only is the author a known shill, the data cited is practically useless in drawing *any* conclusions and the 'corrections' made are just curve fitting. The way the argument is presented begins with the premises and the data is being forced to support them.
I suggest a reputable source of thinking be used in future
Dear Anon, You are welcome to critique Soon's published paper. But your attempt to critique Soon's paper fails for lack of substance.
You are not welcome to call any author a "known shill." Ad hominem attacks only show your ignorance and your bias. Ad hominem attacks do not support any argument. You should know better.
Reputation and credentials matter in the scientific community. You conveniently ignore one fallacy and support another. You use the fact that he has a PhD to make a point that he's substantive. Why is that? What makes him better than any political pundit?
Dear Jeff, I follow true science. Richard Feynman describes true science here.
In true science, we search for truth using the scientific method:
"If your prediction is wrong, your hypothesis is wrong. It does not matter who you are, or what title you hold, or how many awards you have, or how many papers you have published. If your prediction is wrong, your hypothesis is wrong. Period."
By this rule, Soon has proved that CO2 cannot be the driver of global temperature. It's as simple as that.
The Earth has both a North and a South hemisphere: why does this paper only look at the North? What's causing the southern hemisphere to warm? It can't be the sun, otherwise they would have said so wouldn't they?
Probably because there is a lot more meteorological data available for the northern hemisphere (especially old data).
I've met Willy Soon a few times. I like him, though he may be a bit too passionate about the subject matter. If he's a poster child of anything, in my book it would be on the treatment of a climate skeptic by an organization (Harvard-Smithsonian Center of Astrophysics) that doesn't like contrarian views.
I don't know if he's right, but he has a better chance than the CO2-centric folks, like those behind the Karl et al paper last year that has been adopted as the new land & ocean dataset.
Here's an interesting paper with a simple background that extends some of the first (and hugely controversial) work that reported a link between solar activity and European wheat production.
http://xxx.lanl.gov/abs/astro-ph/0312244
Influence of Solar Activity on State of Wheat Market in Medieval England
Lev A. Pustilnik, Gregory Yom Din
(Submitted on 9 Dec 2003)
The database of Prof. Rogers (1887), which includes wheat prices in England in the Middle Ages, was used to search for a possible influence of solar activity on the wheat market. We present a conceptual model of possible modes for sensitivity of wheat prices to weather conditions, caused by solar cycle variations, and compare expected price fluctuations with price variations recorded in medieval England.
We compared statistical properties of the intervals between wheat price bursts during years 1249-1703 with statistical properties of the intervals between minimums of solar cycles during years 1700-2000. We show that statistical properties of these two samples are similar, both for characteristics of the distributions and for histograms of the distributions. We analyze a direct link between wheat prices and solar activity in the 17th Century, for which wheat prices and solar activity data (derived from 10Be isotope) are available. We show that for all 10 time moments of the solar activity minimums the observed prices were higher than prices for the correspondent time moments of maximal solar activity (100% sign correlation, on a significance level < 0.2%). We consider these results as a direct evidence of the causal connection between wheat prices bursts and solar activity.
"(Dr. Soon) has accepted more than $1.2 million in money from the fossil-fuel industry over the last decade while failing to disclose that conflict of interest in most of his scientific papers." NY Times. http://www.nytimes.com/2015/02/22/us/ties-to-corp…
The NYT is not a reputable source on anything to do with GW since they are propagandists for one side in the debate, not journalists.
Most people who work in the oil industry earn more than that in 10 years.
Actually, it was the Harvard-Smithsonian that received the funds.
Dr Soon and all other researchers with his type of contract must sign non-disclosure agreements.
The climate scare is a dangerous and expensive hoax – please watch my radio interview on this here: https://www.youtube.com/watch?v=e6jW-boT4Js
Not according to the Fins.
Government Agency Warns Global Oil Industry Is on the Brink of a Meltdown
We are not running out of oil, but it’s becoming uneconomical to exploit it—another reason we need to move to renewables as quickly as possible.
https://www.vice.com/amp/en_us/article/8848g5/government-agency-warns-global-oil-industry-is-on-the-brink-of-a-meltdown?__twitter_impression=true
You'r all ignarant, weather global warming or just pollution itself the world population is ruining the environment. Keep telling yourself everything we put into the air is fine,that's why peoe in China walk around with face masks on ,and there is air quality warning most days. Wake up stop pushing your ignorance actually care about what we are leaving the future inhabitants. The fact remains what is being done to preserve what health our earth has is virtually nothing. So again global warming or not wake up we are killing our home.
«You’r all ignarant»
Being called «ignorant» by someone who can't even spell the adjective correctly. So funny.
or not knowing the difference between weather and whether, even without the spelling
the difference between local pollution (which nobody is denying) vs its effects on global average temperatures, is a lot more concerning
I prefer the Connolly's web site and open review paper refuting the Greenhouse Effect itself. It's also impossible to fit them into any oil shill narrative as they are completly self financed in everything they do on the subject and earn their keep from their own businesses. They have also relinquished patent rights on inventions to combat overfishing, so hardly an antienvironment bunch either!
Soon is paid by the fossil fuel industry. So, if just a few can debunk climate change then I guess the few who think the earth is flat have merit.
Dear SpudNuts, if you wish to take that tack then consider the flip side: Virtually ALL scientists who promote the global warming fraud are funded by government dollars. Do you claim government money is clean with no strings attached?
By contrast, the community of atmospheric scientists that I associate with includes about 1000 physical scientists worldwide who do not receive government money.
In conclusion, you still miss the point of true science. The question you have not addressed is whether Soon's paper properly shows the correlations of CO2 and solar irradiance with global temperature. This question is not related to how Soon puts food on his table.
I fail to c how the building of cities, roads, and deforestation hasn't caused some warming. take Las Vegas. downtown it is 70 deg. at 11 pm. Drive 10 minutes out to desert area and its 50 deg. a small example but when multiplied by all the cement and ash fault on the planet, add deforestation, how can this not be a factor? I have yet to see this mentioned or discussed by scientists. why ignore it; there is no money in that argument. JS.
Dear J Biss,
Actually this effect has been discussed. The National Science Foundation funded a large field project in and surrounding St. Louis, MO, in the early 1970s. The goal was to measure the effect of the city on local and surrounding temperature and precipitation. I was the NSF program manager for this project. The project was called METROMEX for "Metropolitan Meteorological Experiment."
This experiment proved a large city can and does modify its environment. As a by product, it also showed that weather stations in large cities do not accurately measure the weather outside the city effect. Therefore, temperature data from stations that were once in open areas that became surrounded by cities show over time a warming. But this warming is not "global warming." It is city warming.
To get to the crux of your question, as easy calculation shows that this heating caused by cities and other blacktop has negligible effect on global warming. This is because the area occupied by all such cities is a very small part of the area of the Earth. But, you are correct. There is an effect. It's just too small to be of concern.
Also, this should not be confused with the claim that our CO2 causes global warming. This claim has been proven to be false. Just because global warming alarmists do not acknowledge this fact does not negate this fact.
Just think of it in these terms. The Alps and even the great Rocky Mountains are but minuscule decorations on the big cake we call Earth.
Good discussion, with the exception of the wheat price analysis. In Alberta at least, things like frost, hail and snow at the wrong time, even for a day, can ruin a crop but probably wouldn't even register on the temperature scale overall. While last year's provincial hay crop was a disaster, there were pockets where the rains came at exactly the right time. So farming is a risky business, and prices fluctuate for a wide variety of reasons. I don't pretend to know about the wheat market in 19th century England, but suspect Adam's Smith's law of supply and demand was well known by then.
Good discussion with the possible exception of the wheat crop analysis in 19th century England. In Alberta hail, frost, snow…even for 1 day…can devastate a crop and I suspect not even put a blip in the annual temperature records. Even back then I think the effects of Adam Smith's law of supply and demand were well known and probably more significant than solar activity.
Man-made global warming/climate change, is the second biggest hoax ever perpetrated on civilized man! It takes an extremely arrogant, self important individual to believe that this little colony of ants inhabiting this planet can affect this terrestrial mass more than the sun, moon, volcanoes and ocean currents, to name a few! That being said, it doesn't take a whole lot of common sense to realize that we are systematically destroying all that this planet has provided, for our sustainability as mammals! We have for centuries used our rivers streams and oceans as hazardous waste dumps (including, but most definitely not limited to, raw sewage, bio-hazard waste, biological weaponry, pesticides, radioactive waste awa irradiated water etc. etc. etc.! We are on the verge of totally eliminating the rain forests awa old growth forests that are the only source the planet has provided us to oxygenate the air, that we must obviously have to survive! We have allowed our food to become so genetically altered and infiltrated with pesticides, hormones and pharmaceuticals that we are on the verge of not having a food supply that's edible! I fear that we are beyond the point of attaining the gumption to hold people accountable and reversing the self destructive trend! The insane part is that many self important folks try their best to attribute the effects of all this, to man-made climate change. Yes, man's days are numbered, and yes, it's the result of his own self destructive actions/in-actions! Unfortunately we have too many pious people with stages and microphones, that have found that it's more financially rewarding to convince others that we control the sun, moon and stars, than to attack Monsanto and Merck!
There are too many people on the planet. 3rd world countries are producing babies like never before…
So very true…and we keep sending them money! That disappears and is never accounted for, ever…
Good information in easy to follow form.
Thanks.
Thanks Dr. Roger Posadas for your interpretation of the effects of fossil oil oxidation (burning for energy), changes of solar radiation on climate change. If we have to account also for the effects of other natural processes like volcanic eruptions and oxidation of organic matters, the burning of fossil oil by humans may really be just insignificant. But this conclusion should not encourage us to continue using or even intensifying fossil oil burning for energy since its supply from natural sources is fast diminishing. We should instead find other safe and sustainable sources of energy like wind, sea tide, solar, hydroelectricity from impounded water and even nuclear fission or fusion. More of UN resources and power should be addressed to this pressing global problem. We simply cannot afford to allow private business or enterprise or few strong nations to control the supply and distribution of energy that has been the major causes of wars and international political intrigues.
Fay. A sensible and cogent observation. First, I don't think we should worry too much – this kind of problem will take care of itself in a natural way. Prices will inevitably rise which will choke off demand. We will all be conservers then! Our inventiveness will intensify.
Second, if we want to help this process, we could adopt…. wait for it….
A Carbon Tax! We do not need to believe in CO2 hoax to tax anything we want less of.
Hey, most fossil fuels are polluting, some more, some less.
BUT – the tax must not be imposed by treaty – which usurps democracy, by removing choices from future electorates. British Columbia seems to have adopted a reasonable intervention.
For this reason we should also cancel all trade treaties.
You have made a point…so what do we do to adapt…
Chris, you are confusing global warming and pollution. CO2 is not pollution, it is plant food.
Chris: There is no such thing as "the environment." There is only nature which is comprised of many environments. We are not ruining the planet. Through technology we are making it better.
I'll go with Chris on nature (but not on CO2). But Chris, seems we are failing to clean stuff up (oceans, runoff, soils, etc) BECAUSE everyone is distracted by climate. We should definitely stop wasting billions on climate and spend instead to keep plastic out of oceans, contain stockyard waste, restore soils, stop dragnetting and so on.
Don't forget his obvious strawman comparing this with flat earthers.
I've been thinking the whole "Global Warming/Climate Change" deal has been nothing but a hoax..I started following the arguments from the other side of the debate (not the celebrity side) and, as soon as our own gov't jumped on board with the celeb side, my cynical side rose to the forefront! Next came the Carbon Tax (very shortly) which will drive the price of everything up and also fatten the coffers of this Liberal Gov't which is in power right now! I've now read and listened to scientists claiming the whole thing is a tax grab and a hoax..and it's not just ANY hoax, it's very likely going to be the Greatest Hoax ever perpetrated in the history of mankind!
It is PLANET X! Thats what the toxic chemtrails sprayed every day globally are hiding.
The entire government are evil treasonous criminals. The day of the next false flag using the nuke they stole in 2007 and blamed on Iran, America will be destroyed by Russia, China and the SCO. This is the war of Armageddon and you can know it is now because of Planet X and the toxic chemtrails that hide it every day. Planet X will end the war when it rips the earth apart again but 90% of Americans will be dead already. All planned by your evil government.
Your response to this is that the NYT is biased? That's an insufficient response. The reality is that this author has accepted a lot of $ and this introduces a large portion of bias for his views, which aren't supported by the mass majority of climate scientists. Have a better response than "conspiracy."
So the scientists that say otherwise don't receive large amounts of money to do their studies? Hey get paid large amounts from GOVERNMENT funding. So in turn if they want to continue geting funding then they come up with the answers they the funders want the scare people in to believing that…….. just saying…..
In my mind the government has much to gain from denying global warming/climate change. Making your argument moot. While ignoring a large plausible bias present in Soon's work. It is good scientific practice to present plausible conflicts of interest prior to scientific data/arguments. You haven't done so here.
Theyre saving their own asses because we would lynch them all if the whole public knew all this is over Planet X and the evil government is planning for 90% of Americans to die in WW3!
The entire government are evil treasonous criminals. The day of the next false flag using the nuke they stole in 2007 and blamed on Iran, America will be destroyed by Russia, China and the SCO. This is the war of Armageddon and you can know it is now because of Planet X and the toxic chemtrails that hide it every day. Planet X will end the war when it rips the earth apart again but 90% of Americans will be dead already. All planned by your evil government.
YES! Finally! You have answered my questions!! Well "question" actually. I don't know how many times or all the sites on the internet, or all the news articles, that I have asked this question: "Does the sun contribute to climate change?" I have been kicked off environmental pages, blocked etc., just for asking that question. While I agree we need to fix some things and clean up our garbage, taxing the people into poverty will not fix it! Or is that the plan?
Berry rides again!
And how much money have the alarmists been paid by the government? Goes both ways don't you think.
Dr David Evans' new papers out later this year look to confirm this paper's outcome. It's the sun that causes the earth to warm, and cool, not CO2. Part 22 here: http://joannenova.com.au/2016/02/new-science-22-s…
Well, this not so ignorant and not yet a friend in Canada has always had difficulty accepting man made global warming. I've always said that it is probably a 10,000 year to 1,000,000 year global warming event. Nothing scientific about my deduction other than articles read and listening to the deafening rhetoric spewing out of the "environmentalists" mouths.
ignorant friends in canada? i hope you're referring to specific friends who are ignorant on the issue. however, without the context of knowing you have friends there, it is better interpreted that you are assuming all canadians are ignorant of the issue. shame on you.
"Well, not even Ken Schatten believes the old, obsolete Hoyt & Schatten TSI reconstruction is valid [not even approximately] so I'll not put any credence in the Soon et al. paper"…. Dr. Leif Svalgaard – Solar Physicist who has written against AGW on Wattsupwiththat.
Absolutely, great article. Not written by actors who are just looking to updated their profiles and get some easy publicity.
I've written and study this for years and agree Fully with this article. Please share this is not written by an actor or ex-politician looking to make some money on speaking tours. If they are that concerned why don't they donate their money to scientist instead telling naive people the world is coming to an end soon and to buy their books or movies as soon as possible. Meanwhile you see these guys on Jets skies zooming around in the ocean polluting and that's OK. Shame on them.
"If you truly believe the red CO2 line in chart (a) fits the blue Temperature line better than the red Solar line in chart (c), then you are a true believer in Al Gore and Obama’s version of climate change."
Quotes like this make me question the integrity of the publication. The whole article is LITERALLY a precursor to this political statement. To deny that there maybe a correlation between all these factors is also incredibly Unscientific. I did not read the report and neither will 98% of the people who'll repost this article. Shit, I bet 80% will repost without reading the whole article in general.
Does the sun contribute to climate change? Seriously that question has so many variables that even thinking of writing them down gives me a headache. Geothermal? Atmospheric? Gravitational? Weather over a short period of time? Thermodynamics of other molecules in our air that may have changed because of natural or man made phenomena?
Does the sun contribute to climate change? Directly, of course.
Denial is a tough gig, not politically correct so I don't hassle him over non disclosure, especially if its oil money. But you are right, Soon shouldn't be shy. So what if it is oil money.
Consider the alarmists. "According to the Auditor General, Environment Canada spent $6.8 billion from 1997 to 2005 on climate change." Sure they can boast about which agency funded the project. But I notice the taxpayer rarely finds out directly how his money is being spent/ wasted. And notice the difference in magnitude.
As I see it, there are only a few (half dozen?) scientists willing to stick their necks out on this. If they each got 2 million, that's only 12 million to play with – a pittance compared to the orthodox side.
This is an important question which will have repercussions for generations. I would insist that funding for each side be equal. We can't afford to make a mistake.
In the meantime, I'm now a denier. I base my case on the Vikings having raised cattle on Greenland only 1000 years ago. We are a lot cooler but even if it does return to that condition, should we really worry? Should humanity remove from itself all the wonderful inventions that run on fuel? You can bet the militaries wont let go of their machines. So why should I/we? If sea levels do rise, won't we need machines to help humanity cope? Think about it.
So, a year ago, scientists witnessed CO2 trapping heat in the atmosphere. I'm no expert, but doesn't this directly contradict what you're saying?
http://www.huffingtonpost.com/2015/02/25/scientis…
Considering that your link doesn't actually link to an article on Nature, and a search on Nature for the reported Author doesn't return a paper with that content, I don't believe there is much merit.
Of course Nature has a pay wall. That might be the reason they mention it as their source.
Dear Terrance, Of course we expect to be able to detect radiation absorption and emission by CO2 in the atmosphere. But that measures only one small path of energy flow in our atmosphere. It does not measure the overall effect of CO2 after the feedbacks. These feedbacks overwhelm and reduce the small effect of CO2.
If our atmosphere were as simple as Al Gore claimed then average global temperature would have increased in direct proportion to the measured increase in CO2. The fact that this has not occurred shows Gore is wrong.
The whole global warming alarm is not based on the direct effect of CO2 warming. All scientists agree this effect is too small to cause concern. The alarm is based upon the assumption that an increase in CO2 causes an increase in water vapor, and this added water vapor then produces enough added heat trapping to be of concern. That assumption is in the climate models.
The alarmist's problem is data show water vapor does not increase with CO2. It decreases. This decrease greatly cancels the CO2 effect and makes the data in your link irrelevant to global warming.
There has been climate change from day one. The recorded info is a millisecond in the history of Earth. There has been cooling and warming, ice ages and areas that were once moderate or even tropical, now covered with ice, sea ice thins and thickens.
You can read opinions on both side of the debate. Who and what do we believe?? The lie that 97% of scientists believe in global warming, or the fact that the numbers were faked? Over 10,000 scientists were polled and the "results" were based on a selected few to get to the 97% figure. There are always those that are influenced by the almighty buck (research grants), and those that jump on the bandwagon and agree with other opinions.
Back in 1968 Paul R. Ehrlich a respected Stanford University Professor predicted that the sky was falling, his best-selling book "Population Bomb" warned of the mass starvation of humans in the 1970s and 1980s due to overpopulation, as well as other major societal upheavals, and advocated immediate action to limit population growth. Fears of a "population explosion" were widespread in the 1950s and 60s, but the book and its author brought the idea to an even wider audience. Many were advocating Government laws limiting family growth and sterilization of women. The movie "Soylent Green" was based on this premise. The book has been criticized since its publishing for its alarmist tone, and in recent decades for its inaccurate predictions.
Even though it is a minority opinion, there are educated, thoughtful scientists that believe that man's affect on "Global Warming" (or as it is now called) "Climate Change" is minimal, and that it is caused primarily by Solar activity.
You are making the wrong comparison. The Flat Earthers are more comparable to proponents of AGW. Like the Flat Earthers, the AGW proponents make baseless assertions that can easily be dismissed by even interested amateurs. Given the shadow that the Earth casts on the Moon during a lunar eclipse, the way that anyone can see further if they are higher up, and how ships sailing into the distance disappear from the bottom up, no one who ever took an interest in the Earth's shape ever considered it to be anything but a sphere.
The 'AGW deniers' keep pointing to evidence and the AGW proponents keep making ad hominems and appeals to authority– which group is being more scientific?
I'm not surprised to hear that the price of wheat affected solar cycles. It is just another example of a few monopolists through the ages trying to dominate the whole solar system using food as a weapon. obviously the sun realizes what is going on subconsciously
through outstanding facilities of premonition, but is nevertheless unable to do anything about it due to lack of consensus amongst earthlings it would otherwise consider allies.
Fog and haze from melting ice, co2, from evaporating all our solar savings, smoke from forest fires and con trails are all being used to block transcendental communication between us and communication with our true cosmic outer selves.
"Therefore, the global warming, climate change promoted by our government, our schools, and our media is a hoax."
You honestly think that you can draw this definitive conclusion from one paper?
Dear Johnty, Yes. Einstein famously said, "Many experiments may show me right but it takes only one experiment to prove me wrong." Call this Scientific Method 101.
Or as Feynman put it, "If your prediction is wrong, your theory is wrong."
The paper shows CO2 is not even correlated with global temperature. When there is no correlation, there is no cause-effect. There is only one conclusion: CO2 does not drive global temperature.
Peter, I agree that we need a nice and clear assessment such as this, but I must add that there are many Canadians that do not believe the myth of GW, our media does a great job of saying that we do, but many Canadians are not that gullible, lol. Keep fighting the good fight!
S
So, judge Scalia died over co2 nonsense, God bless his soul!
Scalia went to an underground city in preparation for WW3 and Planet X.
https://www.youtube.com/watch?v=id5m1eINubI
The SECOND sun, PLANET X is causing the "climate change." Thats what the toxic chemtrails hid e every day globally. Everything the evil government says is a lie.
The entire government are evil treasonous criminals. The day of the next false flag using the nuke they stole in 2007 and blamed on Iran, America will be destroyed by Russia, China and the SCO. This is the war of Armageddon and you can know it is now because of Planet X and the toxic chemtrails that hide it every day. Planet X will end the war when it rips the earth apart again but 90% of Americans will be dead already. All planned by your evil government.
That comment sounds a lot like a government liar comment. "Global warming" is PLANET X! Thats what the toxic chemtrails sprayed every day globally are hiding. Thats whats bring all the big meteors exploding in the atmosphere. Thats what is causing "global warming" on every planet in the solar system and it is that big RED glow behind the chemtrails down left of the sun every sun set.
Really? When we KNOW the evil government has hired thousand of paid liars? We also know they developed software to handle multiple accounts over multiple platforms to spread their lies in social media and comment sections of articles like this one. The best way to know hes a liar is he is covering up Planet X that we know is here. NASA told us they found it when they launched IRAS in 1983 specifically to look for it. Is that enough substance?
Have St.Suzuki, Big Al & Chinookie deCap been advised of this heresy?
This is how the sun achieves the observed effect:
http://joannenova.com.au/2015/01/is-the-sun-drivi…
You failed to note that Willie Soon has been widely discredited. It's hard to discredit the other two, because they are amateurs, so we'll just focus on Soon. How can we believe that this man hasn't just fudged the statistics like he did 20 years ago?
The controversy has its own wiki for crying out loud.
Aren't you ashamed?
We are talking about a peer-reviewed publication. Because the data contradict your delusional belief, you reject the data and challenge the messenger. Do you not understand the scientific method?
Your challenge of the messenger does not change the data. If you wish to challenge the publication then you must show how the publication is wrong.
"A new, peer-reviewed professional paper shows our sun, not our carbon dioxide, causes climate change."
Ed: Do you think CO2 doesn't absorb infrared radiation, or do you think the Earth doesn't emit any?
David, You don't understand science. If you did, you would realize that the lack of correlation means the lack of cause and effect.
Of course, CO2 absorbs infrared radiation, but you think that means CO2 causes significant climate change. Soon's paper proves your hypothesis is wrong.
Willie Soon.
Is there a funnier, more dismissed scientist on the planet?
Who paid him for this study, anyway?
David, You prove you are not a scientist when you ignore the basic logic of science. If you were a real scientist, you would make a scientific point rather than an ad hominem attack.
Last time I checked, Willie Soon had a lot more good scientific papers than you have ever published. You say he is "dismissed." Yes, by people like you who have no other way to rebut what he publishes.
I see you did not even read Soon's paper. If you had, you would have read that the authors did their study with no supporting funds.
I think you are funny.
Dr. Berry, you have to ignore Arple. You’re right he isn’t a scientist. He is a hardcore leftist propagandist-bought and paid for. He won’t try to refute your math or your logic. If he truly were a scientist he would show you where your math or logic are wrong like you did with Cawley. He can’t and he won’t. He won’t admit Big Climate controls most of the major peer-reviewed publications. Salby often uses this quote: “Truth is the daughter of time, not authority.”
Ed: Google Scholar says this Soon et al paper has been cited a total of…. drum roll please…. 2 times in the one year since it has been published.
https://scholar.google.com/scholar?hl=en&q=Re…
Not. Very. Impressive.
David, You are really scraping the bottom of the barrel in your attempt to rebut Soon's paper. You would not need to do this if there were a fault in his paper.
If you were a real scientist, you would admit that Soon's paper, and many others, prove your AGW hypothesis is wrong.
"Is there a funnier, more dismissed scientist on the planet?"
Yes. You, Appell, but then you're not even a scientist or meteorologist. Your PhD is 30 years old and you never used it or got accepted at any university if you did.
Your silly assumptions are always the same. Such as asking the stupid question " does Co2 absorb infrared radiation?" as if that proves it causes the climate to change just because the answer is yes.
You remain clueless, even as a journalist, Appell.
Chuck Wiese
Meteorologist
Maybe Arple can get some of his “peers” in atmospheric physics to come here and debate the science with Dr. Berry. Arple you can squash this once and for all. Maybe if you can get Daniel Jacobs to come on here and debate Dr. Berry. Maybe he can show Dr. Berry how his use of the continuity equation is wrong or that e-time for anthropogenic CO2 is partitioned.
Invaluable discussion – I learned a lot from the info – Does anyone know if I might be able to find a template Decap form nyc form to edit ?
Greetings Brian . my friend saw a blank Decap form nyc document with this link <a>"https://goo.gl/xz2ohc".
Dr. Ed,
I admire your patience with Appell. If he holds a PHD then I'm a brain surgeon. His comments are both ignorant and shallow. I am surprised you tolerate his routine. BTW, I've seen him do the same stuff on Dr. Roy Spencer's blog. He is a liberal troll.
George
The evidence for Climate Change is right around you and denial of its existence is mere 'whistling in the dark'.
At the start of the Industrial Revolution, around three centuries ago, a prehistoric sun lit earth up, for the first time in millenia. This was not like our own, natural sun of today, however, – it is a turbocharged version of the original.
A simple thing like a Thermos vacuum flask is the best analogy I can think of for our planet Earth – no heat at all can escape by the only transmissive means we know – conduction, convection and radiation – so the temperature can only increase, the longer that second sun stays lit.
There have been alternative means available for at least half a century – efficient and essentially limitless – it is these means that are being suppressed by the globalists, in promoting fossil fuels and insisting their inhuman second sun stays lit, whatever the cost to the Earth.
steve makes a good point, i think.
https://tambonthongchai.com/2019/10/31/connolly/
Of course the sun is the cause of – basically everything in the world. Without sun, you and me, will not even exist to produce carbon dioxide. Period.
https://www.quora.com/What-do-climate-change-believers-know-that-climate-change-deniers-dont-know/answer/Mike-Free-18
Willie Soon funded by oil company:
https://af.reuters.com/article/energyOilNews/idAFN1E75Q1ZO20110628
https://www.nytimes.com/2015/02/22/us/ties-to-corporate-cash-for-climate-change-researcher-Wei-Hock-Soon.html
Dear Mike, Thank you for your comment because it shows how climate alarmists (like you?) are anti-science. Rather than judge the post by Soon on the basis of its science, you discredit Soon’s conclusions on the basis of funding he has received.
The relevant question is: Does a funding source require a specific conclusion for the funded research?
It depends upon the funding source. Since about 1988, the US and state governments began to fund research that would confirm the IPCC hypothesis that human emissions causes dangerous climate change. These funding sources began to fund scientists who would support the political agenda of the funding source. The same holds true for funding by environmental non-profit corporations. Almost all fund only what supports their political agenda.
I know, I was in that game. I was at a meeting where the US government lawyer told atmospheric physicists (like me) that the government would no longer fund us. Instead, the government would fund ecologists and environmentalists who would do calculations to support the illusion that human emissions cause climate change.
So, if you are going to play the funding source card, you must first disregard all the so-called scientific reports supported by government funding. That includes by university professors.
Why do you think I do all my climate research with no funding? Do you think I like to work for free after spending my time and money to get my education?
I used to receive government funding for my research. But in 1982, that all changed. After 1988, no government agency has funded climate research that disagrees with the political agenda that human emissions cause climate change.
It is no wonder that Soon had to find other means of support. If Soon wanted to do fake science to support the political agenda, he could have received funding from a government agency. But Soon is an honest scientist, so he did not accept blood money. He found sources of funds that would support the science that he believes is honest science.
Moral: if you want to learn the truth about climate science, you should try to learn from the scientists who do not receive government funding.
So the sun is getting hotter….? Good luck trying to cool that thing. Ha-ha, or maybe not funny. As there is no way of stopping global warming. Just party on then? Corona, not a problem. We will fry within 2050 anyway.
And 10 months after this idiots post, USA is frozen.