
Note: The International Journal of Atmospheric and Ocean Sciences published its online version of this paper on July 4, 2019, here.
Edwin X Berry, Climate Physics LLC, Bigfork, Montana, USA
Abstract
The United Nations Intergovernmental Panel on Climate Change (IPCC) agrees human CO2 is only 5 percent and natural CO2 is 95 percent of the CO2 inflow into the atmosphere. The ratio of human to natural CO2 in the atmosphere must equal the ratio of the inflows. Yet IPCC claims human CO2 has caused all the rise in atmospheric CO2 above 280 ppm, which is now 130 ppm or 32 percent of today’s atmospheric CO2.
To cause the human 5 percent to become 32 percent in the atmosphere, the IPCC model treats human and natural CO2 differently, which is impossible because the molecules are identical. IPCC’s Bern model artificially traps human CO2 in the atmosphere while it lets natural CO2 flow freely out of the atmosphere.
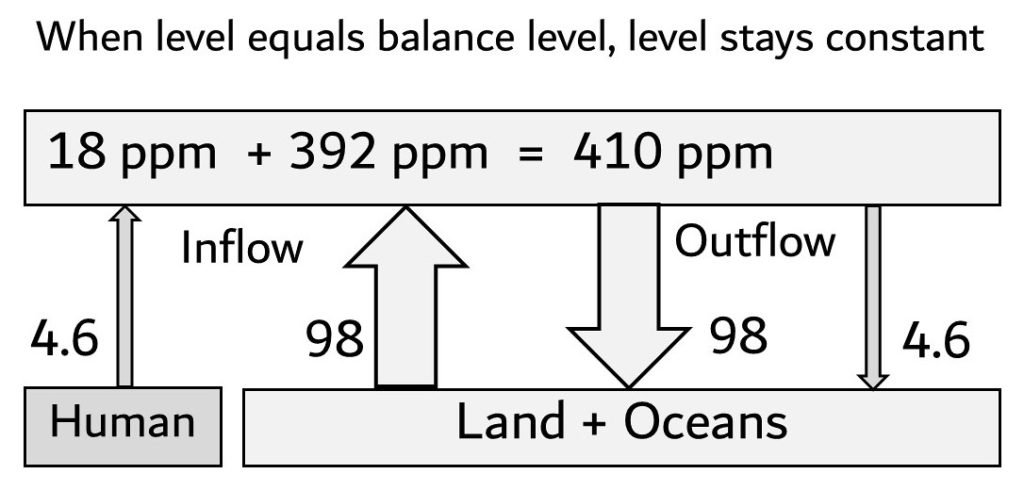
By contrast, a simple Physics Model treats all CO2 molecules the same, as it should, and shows how CO2 flows through the atmosphere and produces a balance level where outflow equals inflow. Thereafter, if inflow is constant, level remains constant.
The Physics Model has only one hypothesis, that outflow is proportional to level. The Physics Model exactly replicates the 14C data from 1970 to 2014 with only two physical parameters: balance level and e-time. The 14C data trace how CO2 flows out of the atmosphere.
The Physics Model shows the 14CO2 e-time is a constant 16.5 years. Other data show e-time for 12CO2 is about 4 to 5 years. IPCC claims human CO2 reduces ocean buffer capacity. But that would increase e-time. The constant e-time proves IPCC’s claim is false.
IPCC argues that the human-caused reduction of 14C and 13C in the atmosphere prove human CO2 causes all the increase in atmospheric CO2. However, numbers show these isotope data support the Physics Model and reject the IPCC model.
The Physics Model shows how inflows of human and natural CO2 into the atmosphere set balance levels proportional to their inflows. Each balance level remains constant if its inflow remains constant. Continued constant CO2 emissions do not add more CO2 to the atmosphere. No CO2 accumulates in the atmosphere.
Present human CO2 inflow produces a balance level of about 18 ppm. Present natural CO2 inflow produces a balance level of about 392 ppm. Human CO2 is insignificant to the increase of CO2 in the atmosphere. Increased natural CO2 inflow has increased the level of CO2 in the atmosphere.
Keywords: carbon dioxide, CO2, climate change, anthropogenic
1. Introduction
The U.S. Global Change Research Program Climate Science Special Report (USGCRP) [1] claims,
This assessment concludes, based on extensive evidence, that it is extremely likely that human activities, especially emissions of greenhouse gases, are the dominant cause of the observed warming since the mid-20th century.
The United Nations Intergovernmental Panel on Climate Change (IPCC) [2] Executive Summary claims human emissions caused atmospheric CO2 to increase from 280 ppm in 1750, to 410 ppm in 2018, for a total increase of 130 ppm.
IPCC and USGCRP claim there are “no convincing alternative explanations” other than their theory to explain the “observational evidence.”
This paper presents a “convincing alternative explanation” that properly explains the data. The Physics Model explains the required first step of human-caused climate change: how human CO2 changes atmospheric CO2.
For simplicity, this paper uses levels in units of ppm (parts per million by volume in dry air) and flows in units of ppm per year. GtC (Gigatons of Carbon) units are converted into CO2 units in ppm using:
1 ppm = 2.12 GtC
Authors who support the USGCRP [1] and IPCC [2, 3] include Archer et al. [4], Cawley [5], Kern and Leuenberger [6], and Kohler [7].
Authors who conclude human CO2 increases atmospheric CO2 as a percentage of its inflow include Revelle and Suess [8], Starr [9], Segalstad [10], Jaworoski [11, 12], Beck [13], Rorsch, Courtney, and Thoenes [14], Courtney [15], Quirk [16], Essenhigh [17], Glassman [18], Salby [19-22], Humlum [23], Harde [24, 25], and Berry [26, 27].
2. The Science Problem
IPCC [2, 3] says nature emits about 120 GtC from land and 90 GtC from ocean for a total of 210 GtC per year. This is equivalent to about 98 ppm per year of natural CO2 that flows into the atmosphere. IPCC admits its estimates of “gross fluxes generally have uncertainties of more than ±20%.”
Boden [28] shows human CO2 emissions in 2014 were 9.7 GTC per year, or 4.6 ppm per year. So, IPCC agrees that human inflow is less than 5% and nature is more than 95% of the total CO2 inflow into the atmosphere. Yet IPCC assumes nature stayed constant since 1750 and human CO2 causes 100 percent the increase in atmospheric CO2 above 280 ppm, which today is 130 ppm or 32 percent of 410 ppm.
The Physics Model concludes the percent of human CO2 in the atmosphere equals the percent of human CO2 in the inflow.
Figure 1 shows how the predictions of the Physics Model and IPCC model differ regarding the composition of human CO2 in the atmosphere.
If the IPCC model is correct, then the effect of human CO2 emissions on atmospheric CO2 is 100 percent. If the Physics Model is correct, then human CO2 emissions do not cause climate change.
3. The Physics Model
3.1 How CO2 flows through the atmosphere
IPCC states, and much of the public believes, human emissions “add” CO2 to the atmosphere. IPCC’s view is the atmosphere is a garbage dump where human CO2 is deposited and mostly stays forever.
However, nature must treat human and natural CO2 the same because their molecules are identical. Nature has had millions of years to “add” to atmospheric CO2. If nature’s CO2 “adds” to atmospheric CO2, the CO2 in the atmosphere would be much higher than it is today.
Therefore, natural and human CO2 do not “add” CO2 to the atmosphere. Both natural and human CO2 “flow through” the atmosphere. As CO2 flows through the atmosphere, it raises the level of atmospheric CO2 just enough so CO2 outflow equals CO2 inflow. Nature balances CO2 in the atmosphere when outflow equals inflow.
You pump air into a tire or inner tube that has a leak. As you pump air into the tube, air leaks out of the tube. The faster you pump air in, the faster air leaks out. If you pump air into the tube at a constant rate, the air pressure in the tube will find a level where outflow equals inflow.
River water flows into a lake or a pond and flows out over a dam. If inflow increases, the water level increases until outflow over the dam equals inflow from the river. Then, the water level will remain constant so long as inflow remains constant. The river does not “add” water to the lake. Water “flows through” the lake and finds a balance level where outflow equals inflow.
Similarly, human and natural CO2 flow through the atmosphere. The inflow creates a balance level that remains constant so long as inflow remains constant.
3.2 Physics Model system description
Figure 2 shows a bucket of water as an analogy to CO2 in the atmosphere. Water flows into the bucket at the top and flows out through a hole in the bottom. An outside source (faucet) controls the inflow.
The water level and the hole size control the outflow. No matter what the inflow, the level and the size of the hole control the outflow. Inflow only serves to set a balance level.
This paper uses e-time rather than “residence” time because there are many definitions of residence time. E-time has a precise definition: the time for the level to move (1 – 1/e) of the distance from its present level to its balance level. The balance level is defined below.
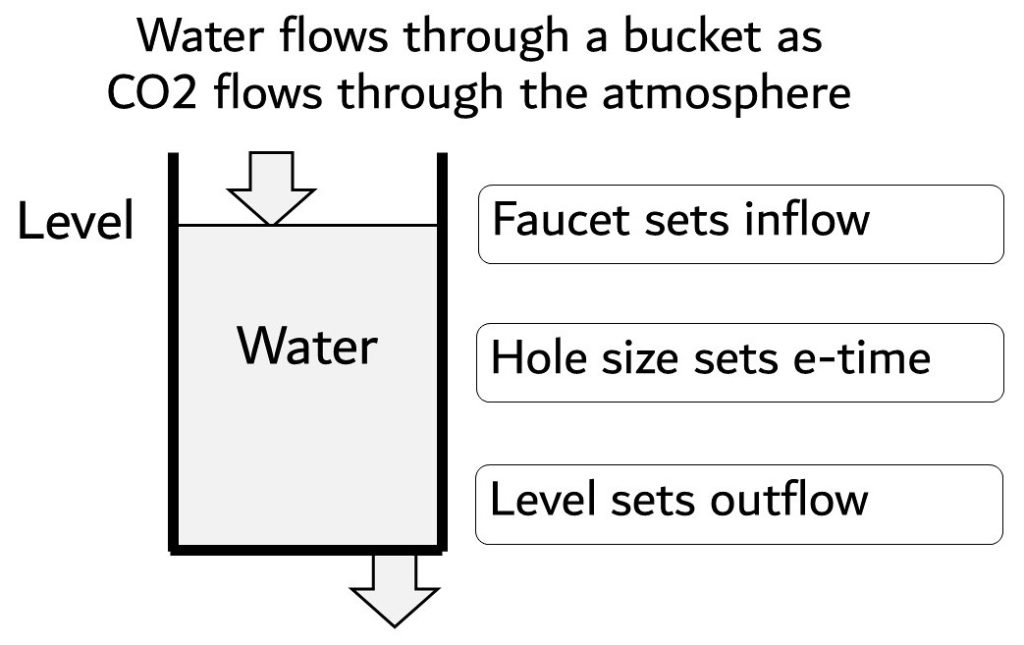
The bucket analogy provides insight into e-time. If the hole in the bucket gets smaller, e-time increases. If the hole in the bucket gets larger, e-time decreases. The hole is an analogy to the ability of the oceans and land to absorb CO2 from the atmosphere.
Figure 3 shows the Physics Model system for atmospheric CO2. The system includes the level (concentration) of CO2 in the atmosphere and the inflow and outflow of CO2.
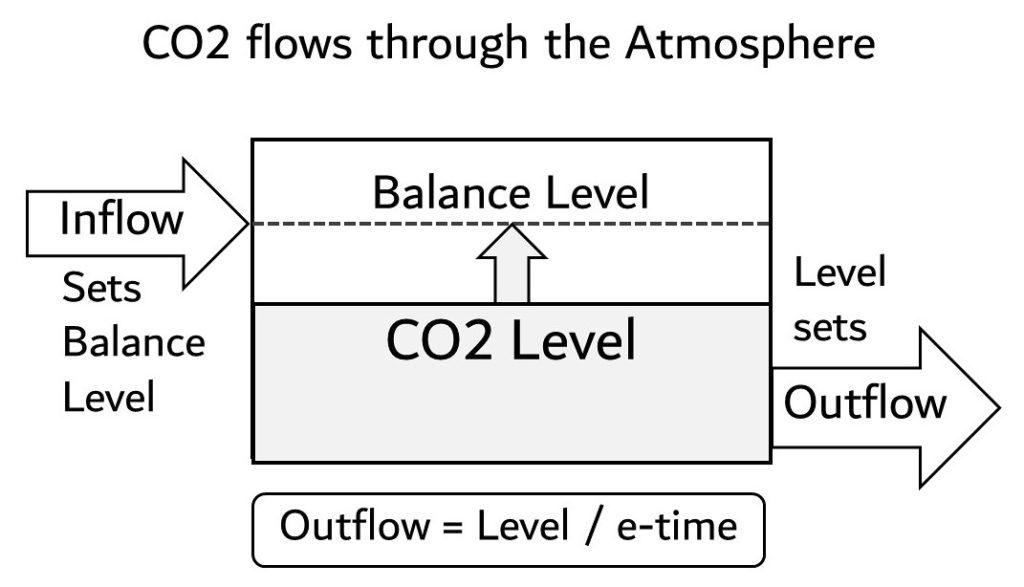
The Physics Model applies independently and in total to all definitions of CO2, e.g., to human CO2, natural CO2, and their sums, and to 12CO2, 13CO2, and 14CO2, and their sums.
The Physics Model is complete. It is not necessary to add separate inflows for human and natural CO2 to the Physics Model. Just use a copy of the Physics Model for each CO2 definition desired.
The Physics Model does not need to describe the details of the external processes. Inflow, outflow, and e-time include all the effects of outside processes. If the Physics Model were connected to land and ocean reservoirs, it would behave exactly as derived in this paper.
Kohler [7] claims Harde’s [24] model and therefore the Physics Model is “too simplistic” and “leads to flawed results for anthropogenic carbon in the atmosphere.”
Kohler is wrong. There is no such thing as a system being “too simplistic.” A system should be as simple as possible to solve a problem. The Physics Model shows how inflow, outflow, and e-time affect the level of CO2 in the atmosphere. The IPCC model cannot do this.
3.3 Physics Model derivation
A system describes a subset of nature. A system includes levels and flows between levels. Levels set flows and flows set new levels. The mathematics used in the Physics Model are analogous to the mathematics used to describe many engineering systems.
The Physics Model derivation begins with the continuity equation (1) which says the rate of change of level is the difference between inflow and outflow:
dL/dt = Inflow – Outflow (1)
Where
L = CO2 level (concentration in ppm)
t = time (years)
dL/dt = rate of change of L (ppm/year)
Inflow = rate CO2 moves into the system (ppm/year)
Outflow = rate CO2 moves out of the system (ppm/year)
Following the idea from the bucket of water, the Physics Model has only one hypothesis, that outflow is proportional to level:
Outflow = L / Te (2)
where Te is the “e-folding time” or simply “e-time.”
Substitute (2) into (1) to get,
dL/dt = Inflow – L / Te (3)
One way to replace Inflow in (3) is to set dL/dt to zero, which means the level is constant. Then Inflow will equal a balance level, Lb, divided by e-time. However, a more elegant way to replace Inflow is to simply define the balance level, Lb, as
Lb = Inflow * Te (4)
Equation (4) shows how Inflow and Te set the balance level. Substitute (4) for Inflow into (3) to get,
dL/dt = – (L – Lb) / Te (5)
Equation (5) shows the level always moves toward its balance level. At this point, both L and Lb are functions of time. Te can also be a function of time.
In the special case when Lb and Te are constant, there is an analytic solution to (5). Rearrange (5) to get
dL / (L – Lb) = – dt / Te (6)
Then integrate (6) from Lo to L on the left side, and from 0 to t on the right side [29] to get
Ln [(L – Lb) / (Lo – Lb)] = – t / Te (7)
where
Lo = Level at time zero (t = 0)
Lb = the balance level for a given inflow and Te
Te = time for L to move (1 – 1/e) from L to Lb
e = 2.7183
The original integration of (6) contains two absolute values, but they cancel each other because both L and Lo are always either above or below Lb.
Raise e to the power of each side of (7), to get the level as a function of time:
L(t) = Lb + (Lo – Lb) exp(– t/Te) (8)
Equation (8) is the analytic solution of (5) when Lb and Te are constant.
The hypothesis (2) that outflow is proportional to level creates a “balance level.” Equation (4) defines the balance level in terms of inflow and e-time.
Figure 4 shows how the level always moves toward its balance level according to (5). While outflow is always proportional to level, inflow sets the balance level.
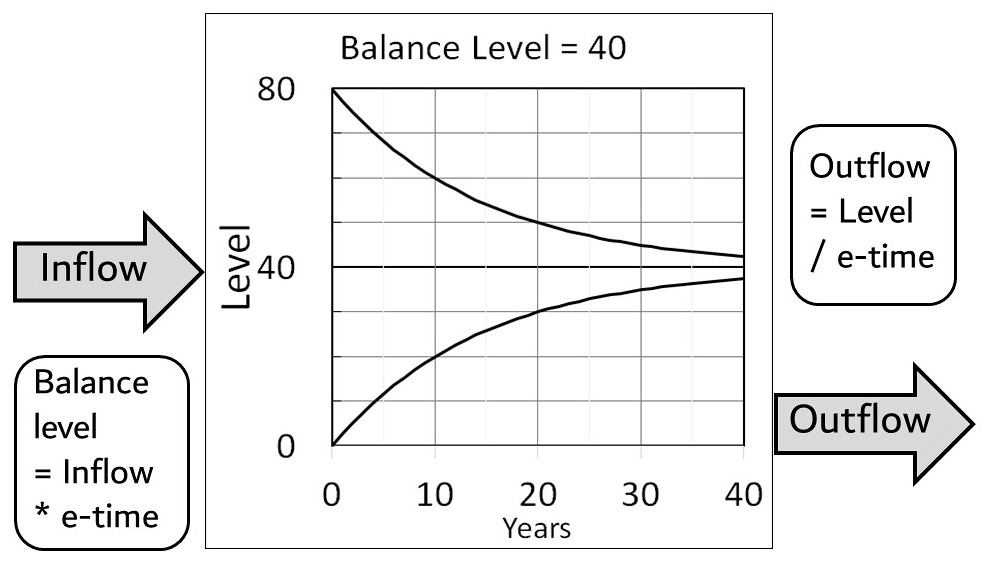
The Physics Model shows how CO2 flows through the atmosphere. CO2 does not “stick” in the atmosphere. A higher inflow merely raises the balance level. Then the level will rise until outflow equals inflow, which will be at the balance level.
3.4 Physics Model consequences
All equations after (2) are deductions from hypothesis (2) and the continuity equation (1).
Equation (4) shows the balance level equals the product of inflow and e-time. Using IPCC numbers, and subscripts “p” to mean human (or people) and “n” to mean natural, the balance levels of human and natural CO2 are 18.4 and 392 ppm:
Lbp = 4.6 (ppm/year) * 4 (years) = 18.4 ppm (9)
Lbn = 98 (ppm/year) * 4 (years) = 392 ppm (10)
The ratio of human to natural CO2 is 4.6%. The percentage of human CO2 to total CO2 is 4.5%. Both are independent of e-time:
Lbp / Lbn = 4.6 / 98 = 4.6% (11)
Lbp / (Lbn + Lbp) = 4.6 / 102.6 = 4.5% (12)
Equation (9) shows present human emissions create a balance level of 18 ppm, independent of nature’s balance level. If nature’s balance level remained at 280 ppm after 1750, then present human emissions would have increased the CO2 level 18 ppm from 280 ppm to 298 ppm.
Equation (10) shows present natural emissions create a balance level of 392 ppm. The human contribution of 18 ppm brings the total balance level to 410 ppm, which is close to the level in 2018.
Equation (11) shows the ratio of human to natural CO2 in the atmosphere equals the ratio of their inflows, independent of e-time.
Equation (12) shows the percentage of human-produced CO2 in the atmosphere equals its percentage of its inflow, independent of e-time.
Figure 5 illustrates these Physics Model conclusions when e-time is 4 years.
Equations (9) and (10) support the key conclusions of Harde [24, 25]:
Under present conditions, the natural emissions contribute 373 ppm and anthropogenic emissions 17 ppm to the total concentration of 390 ppm (2012).
4. The IPCC Bern model
4.1 IPCC Bern model origin
In 1992, Siegenthaler and Joos [30] created the original Bern model. Their Figure 1 connects the atmosphere level to the upper ocean level, and the upper ocean level to the deep and interior ocean levels. They used 14C data to trace the flow of 12CO2 from the atmosphere to the upper ocean and to the deep and interior oceans. Using some physics constraints, they attempted without success to fit three versions of their model to available data.
Earlier, in 1987, Maier-Reimer and Hasselmann [31] used an ocean circulation model connected to a one-layer atmosphere to reproduce the main features of the CO2 distribution in the surface ocean. They applied a mathematical curve fit to represent their conclusions. Their curve fit used a sum of four exponentials with different amplitudes and time constants, as in today’s Bern model.
The use of four exponentials by [31] seems to result from their reconnection of both the deep and interior ocean levels directly to the atmosphere level. Such reconnection would be a serious modelling mistake. Other papers followed the model developed by [31].
Archer et al. [4] found the four-exponential models “agreed that 20–35% of the CO2 remains in the atmosphere after equilibration with the ocean (2–20 centuries).”
Joos et al. [32] compared the response of such atmosphere-ocean models to a pulse emission of human CO2. All the models predicted a “substantial fraction” of pulse would remain in the atmosphere and ocean for millennia.
The conclusions of [4, 30, 31, 32] must be questioned because:
- Agreement among models does not prove they are accurate.
- All models treat human and natural CO2 differently, which violates physics.
- All models assume human CO2 causes all the increase in atmospheric CO2, which violates physics.
- All models partition human CO2 inflow into four artificial bins, which is unphysical.
- All models lack a valid physics model for atmospheric CO2.
Segalstad [10] notes that the models like [31] do not allow CO2 to flow out of the atmosphere in linear proportion to the CO2 level. Rather they use a non-linear constraint on the outflow that contradicts physics and chemistry.
Segalstad [10] concludes the alleged long residence time of 500 years for carbon to diffuse to the deep ocean is inaccurate because the 1000 GtC of suspended organic carbon in the upper 75 meters of the ocean can sink to the deep ocean in less than one year. That gives a residence time of 5 years rather than 500 years.
The IPCC Bern model that evolved from models like [31] artificially partitions human CO2 into four separate bins. The separate bins prevent human CO2 in one bin from moving to a bin with a faster e-time. This is like having three holes of different sizes in the bottom of a bucket and claiming the smallest hole restricts the flow through the largest hole.
The IPCC Bern model is unphysical. It begins with the assumption that human CO2 causes all the increase in atmospheric CO2. Then it creates a model that supports this assumption.
The Bern model fails Occam’s Razor because it is unnecessarily complicated.
4.2 IPCC Bern model derivation
The Joos [33] Bern model is an integral equation rather than a level equation.
It is necessary to peer inside IPCC’s Bern model. To deconstruct the integral version of the Bern model, let inflow occur only in the year when “t-prime” equals zero. Then the integral disappears, and the Bern model becomes a level equation.
The Bern level equation is,
L(t) = Lo [ A0 + A1 exp(– t/T1) + A2 exp(– t/T2) + A3 exp(– t/T3)] (13)
Where
t = time in years
Lo = level of atmospheric CO2 in year t = 0
L(t) = level of atmospheric CO2 in year t
and the Bern TAR standard values, derived from curve-fitting the Bern model to the output of climate models, are,
A0 = 0.150
A1 = 0.252
A2 = 0.279
A3 = 0.319
T1 = 173 years
T2 = 18.5 years
T3 = 1.19 years
The A-values weight the four terms on the right-hand side of (13):
A0 + A1 + A2 + A3 = 1.000
In (13), set t equal to infinity to get,
L = A0 Lo = 0.152 Lo (14)
Equation (14) predicts a one-year inflow that sets Lo to 100 ppm, followed by zero inflow forever, will cause a permanent level of 15 ppm.
The four terms in (13) separate human (but not natural) CO2 into 4 bins. Each bin has a different e-time. Only one bin allows human CO2 to flow freely out of the atmosphere. Two bins trap human CO2 for long times. One bin has no outflow and traps human CO2 forever.
Figure 6 shows the size of the four Bern-model bins in percent and the amount of human CO2 that remains in the atmosphere 8 years after an artificial pulse of human CO2 enters the atmosphere.
Bern (13) predicts 15 percent all human CO2 entering the atmosphere stays in the atmosphere forever, 25 percent stays in the atmosphere almost forever, and only 32 percent flows freely out of the atmosphere.
4.3 How IPCC gets 32 percent
The burden of proof is upon the IPCC to explain how 5 percent human inflow becomes 32 percent in the atmosphere. IPCC cannot change the inflow. Therefore, IPCC must change the outflow. The IPCC Bern model restricts the outflow of human CO2 while it lets natural CO2 flow freely out of the atmosphere. The IPCC Bern model incorrectly treats human CO2 differently than it treats natural CO2. By doing so, it artificially increases human CO2 in the atmosphere to 32 percent and beyond.
IPCC assumes its Bern model applies to human but not to natural CO2. That assumption is unphysical because CO2 molecules from human and natural sources are identical. All valid models must treat human and natural CO2 the same.
If applied to natural CO2, the Bern model predicts 15 percent of natural CO2 sticks in the atmosphere. Then in 100 years, 1500 ppm of natural CO2 sticks in the atmosphere. This clearly has not happened. Therefore, the Bern model is invalid.
For you mathematicians:
It is simple to prove the Bern model is unphysical. Take the derivative of (13) with respect to time. It is impossible to get rid of the exponential terms because the Bern model has more than one time constant in its exponentials. The Bern model dL/dt does not correspond to a physics formulation of a problem.
By contrast, it is straightforward to take the time derivative of the Physics Model (8) and reproduce its dL/dt form of (5).
The Physics Model began as a rate equation, as all physics models should. The Bern model began with a curve fit to an imaginary scenario for a level rather than as a rate equation for a level. The Bern model does not even include a continuity equation.
5. Theories must replicate data
5.1 The 14C data
The above-ground atomic bomb tests in the 1950s and 1960s almost doubled the concentration of 14C in the atmosphere. The 14C atoms were in the form of CO2, called 14CO2.
After the cessation of the bomb tests in 1963, the concentration of 14CO2 decreased toward its natural balance level. The decrease occurred because the bomb-caused 14C inflow became zero while the natural 14C inflow continued.
The 14C data are in units of D14C per mil. The lower bound in D14C units is -1000. This value corresponds to zero 14C inflow into the atmosphere. In D14C units, the “natural” balance level, defined by the average measured level before 1950, is zero, 1000 up from -1000. [34].
Hua [34] processed 14C data for both hemispheres from 1954 to 2010. Turnbull [35] processed 14C data for Wellington, New Zealand, from 1954 to 2014. After 1970, 14CO2 were well mixed between the hemispheres and 14CO2 in the stratosphere were in the troposphere. The 14C data from both sources are virtually identical after 1970.
14C is an isotope of 12C. Levin et al. [36] conclude the C14 data provide “an invaluable tracer to gain insight into the carbon cycle dynamics.”
5.2 Physics Model replicates the 14C data
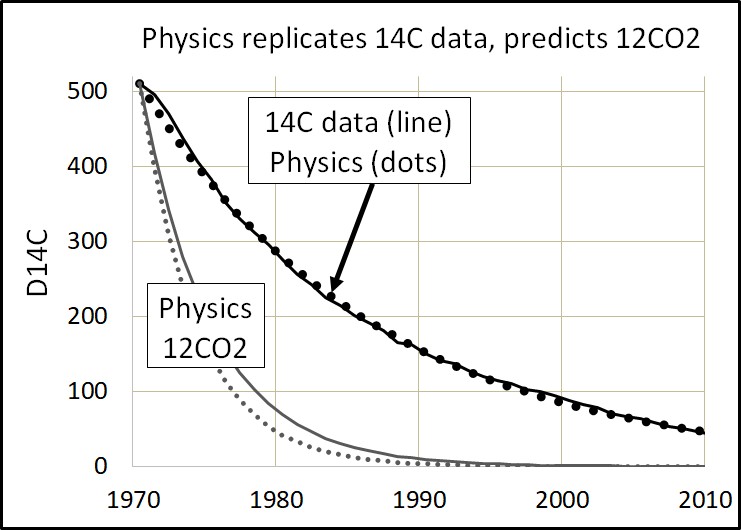
The Physics Model (8) accurately replicates the 14CO2 data from 1970 to 2014 with e-time set to 16.5 years, balance level set to zero, and starting level set to the D14C level in 1970.
Figure 7 shows how the Physics Model replicates the 14C data.
The Physics Model is not a curve fit with many parameters like the Bern model. The Physics model allows only 2 parameters to be adjusted: balance level and e-time, and they are both physical parameters. It is possible that the data would not allow replication by the Physics Model.
The replication of the 14C data begins by setting the Physics Model to the first data point in 1970. Then it is a matter of trying different balance levels and e-times until the model best fits the data. Although there is room for minor differences in the fit, the best fit seems to occur when the balance level is zero and e-time is 16.5 years.
The replication of the 14C data by the Physics Model has significant consequences. It shows the 14C natural balance level has remained close to zero and e-time has remained constant since 1970. If the e-time had changed since 1970, it would have required a variable e-time to make the Physics Model fit the data.
5.3. 12CO2 reacts faster than 14CO2
Isotopes undergo the same chemical reactions but the rates that isotopes react can differ. Lighter isotopes form weaker chemical bonds and react faster than heavier isotopes [37].
Because 12CO2 is a lighter molecule than 14CO2, it reacts faster than 14CO2. Therefore, its e-time will be shorter than for 14CO2.
Equation (4) shows e-time equals Level divided by Inflow. Using IPCC numbers, e-time for 12CO2 is about 400 ppm divided by 100 ppm per year, or 4 years. Also, IPCC [3] agrees 12CO2 turnover time (e-time) is about 4 years. Segalstad [10] calculated 5 years for e-time.
Figure 8 shows the Physics Model (8) simulation of 12CO2 using an e-time of 4 years. For comparison, Figure 8 shows the 14C data from Hua [34] and the Physics Model replication of 14CO2 data with an e-time of 16.5.
5.4 IPCC model cannot simulate 12CO2
The Bern model claims to predict the outflow of 12CO2. Therefore, the Bern model should come close to predicting the outflow of 12CO2 as calculated by the Physics Model that replicates the 14C data.
Figure 9 shows the Bern model (13) predictions. The IPCC Bern model begins with a short e-time, then increases its e-time. The increased e-time causes the Bern line to cross the 14C line and thus conflicts with the 14C data. The Bern model traps 15 percent of human CO2 in the atmosphere forever.
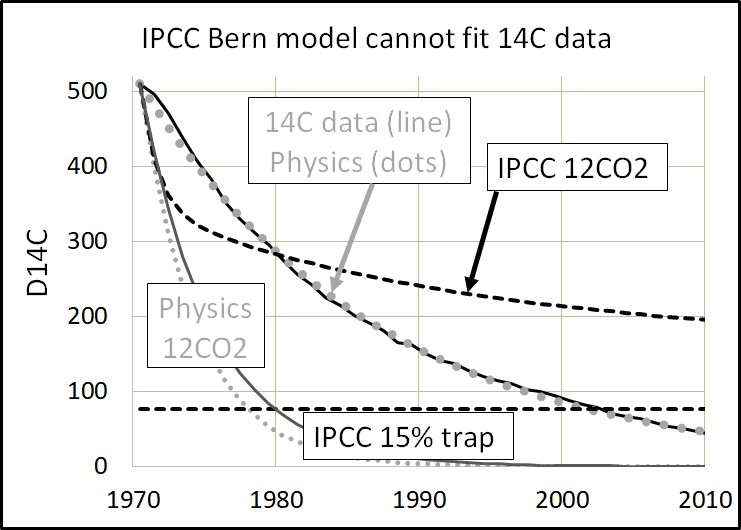
The IPCC Bern model is not just a failure to simulate data. The Bern model is a functional failure. It’s e-time increases significantly with time when 14C data show e-time is constant. The only way the Bern model can increase with time is by using its history as a reference.
Figure 10 shows how the IPCC Bern model cannot even replicate itself when it is restarted at any point in its simulation.
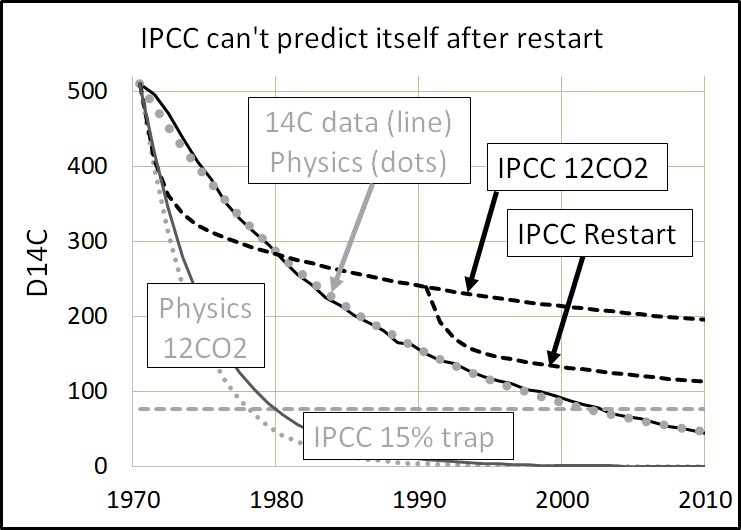
The IPCC Bern model cannot continue its same prediction line if it is restarted at any point. The Bern model cannot properly restart because it depends upon its history, which makes it an invalid model.
A restart deletes the Bern model’s history. This forces the Bern model to create a new history. In the real world, molecules do not remember their history. Molecules only know their present. Therefore, the IPCC Bern model fails the most basic test for a physical model.
Revelle and Suess [8] used 14C data to calculate correctly that human CO2 would increase atmospheric CO2 by only 1.2 percent as of 1957, based for an e-time of 5 years.
5.5 IPCC’s buffer theory is invalid
IPCC [3] claims:
The fraction of anthropogenic CO2 that is taken up by the ocean declines with increasing CO2 concentration, due to reduced buffer capacity of the carbonate system.
Buffer capacity is the ability of the oceans to absorb CO2.
Kohler et al. [7] claim human (but not natural) CO2 has reduced the “buffer capacity” of the carbonate system:
the rise in atmospheric and oceanic carbon content goes along with an increase in the Revelle factor, a phenomenon which is already measurable. This implies that the oceanic uptake of anthropogenic carbon will become slower if we continue to increase anthropogenic CO2 emissions. This is already seen in all CHIMP5 model simulations.
Kohler’s last sentence exhibits circular reasoning when it claims a model can prove what has been fed into the model.
All IPCC models use the buffer factor myth instead of Henry’s Law to conclude human CO2 causes all the rise in atmospheric CO2 [10].
The problem for Kohler and IPCC is data. Where are the data that support their claim? They have only their models. Models are not data. Models must make predictions that replicate data. Their models cannot replicate data.
Ballantyne et al. [38] found “there is no empirical evidence” that the ability of the land and oceans to absorb atmospheric CO2 “has started to diminish on the global scale.”
The 14C data are the most accurate way to measure changes in the Revelle factor and “buffer capacity.” Reduced buffer capacity, if it existed, would increase e-time. The 14C data prove e-time has been constant since 1970. Therefore, IPCC’s buffer capacity has been constant.
IPCC’s buffer capacity claim is absurd because it assumes only human CO2 reduces the buffer capacity while natural CO2 outflow does not. IPCC treats human and natural CO2 differently, which is impossible.
Kohler [7] claims lower buffer capacity affects only 12CO2, not 14CO2. That claim violates chemistry and physics. Segalstad [10] previously showed Kohler’s claim is impossible because “chemical and isotropic experiments show the equilibrium between CO2 and water is obtained within a few hours.”
The IPCC Bern model is based upon the invalid assumption that human CO2 decreases buffer capacity.
5.6 Isotope data support the Physics Model
IPCC [3] writes:
Third, the observed isotropic trends of 13C and 14C agree qualitatively with those expected due to the CO2 emissions from fossil fuels and the biosphere, and they are quantitatively consistent with results from carbon cycle modeling.
Human fossil-fuel CO2 is “14C-free” and the 14C balance level has decreased. IPCC [3] and Kohler [7] claim this proves human CO2 caused all the rise in atmospheric CO2.
But neither IPCC nor Kohler argue with numbers. Let’s do the calculations to compare the results from both models with the data. IPCC [2] says human CO2 comprises 32 percent of atmospheric CO2 while the Physics Model (12) says human CO2 is less than 5%. The question is whether the available isotope data support or reject either of the models.
RealClimate [39] says the 13C/12C ratio for human CO2 is about 98 percent of the ratio in natural CO2, and the 13C ratio has declined about 0.15 percent since 1850. RealClimate says this proves human CO2 caused all the increase in atmospheric CO2 since 1850.
Human CO2 causes the new balance level of D14C and 13C/12C to be:
Lb = Ln Rn + Lh Rh (15)
Where
Lb = the new balance level (of D14C or 13C/12C)
Ln = the natural balance level (D14C = 0; 13C/12C = 100%)
Lh = the human balance level (D14C = –1000; 13C/12C = 98%)
Rn = the fraction of natural CO2
Rh = the fraction of human CO2
The Physics Model predicts for D14C:
Lb = (0) (0.955) + (–1000) (0.045) = – 45 (16)
The IPCC model predicts for D14C:
Lb = (0) (0.68) + (–1000) (0.32) = – 320 (17)
The Physics Model predicts for 13C/12C:
Lb = (100) (0.955) + (98) (0.045) = 99.91 (18)
The IPCC model predicts for 13C/12C:
Lb = (100) (0.680) + (98) (0.320) = 99.36 (19)
The 14C data
The Physics Model (16) predicts human CO2 has lowered the balance level of 14C from zero to –45. The IPCC model (17) predicts human CO2 has lowered the 14C balance level to –320.
Figure 11 compares the Physics and IPCC predicted levels for human CO2 in the atmosphere.
Figure 11 shows the Physics Model result of 5 percent human CO2 in the atmosphere matches the 14C data much better than the IPCC model of 32 percent of human CO2 in the atmosphere.
In summary, the 14C data support the Physics Model and reject the IPCC model.
The 13C data
The Physics Model (18) predicts human CO2 has lowered the 13C ratio by 0.09. The IPCC model (19) predicts human CO2 has lowered the 13C ratio by 0.64.
Figure 12 compares the Physics and IPCC predictions of the 13C/12C ratio to RealClimate’s numbers.
There seem to be no error bounds in the available 13C data. Nevertheless, even without error bounds the 13C data do not support the IPCC model over the Physics Model. So, the IPCC argument fails.
Segalstad [10] calculated similar results using permil units. He concluded the isotope data show human CO2 cannot be more than 4 percent of atmospheric CO2.
5.7 Mauna Loa data
Some scientists argue that a viable CO2 model must replicate the Mauna Loa CO2 data. The Physics Model can simulate the Mauna Loa data for atmospheric CO2.
Spencer [40] has a model that fits the Mauna Loa data. Spencer assumes like the IPCC that the natural level of CO2 is fixed at 280 ppm and human CO2 causes all the increase in atmospheric CO2. His model has many variables available to adjust so a fit to the Mauna Loa data is guaranteed.
The significance of the fit by the Physics Model is that it comes with physical constraints that the other models do not have. The Physics Model e-time must be 4 years and natural CO2 must be 95 percent of atmospheric CO2.
Figure 13 shows how the Physics Model fits the Mauna Loa data.
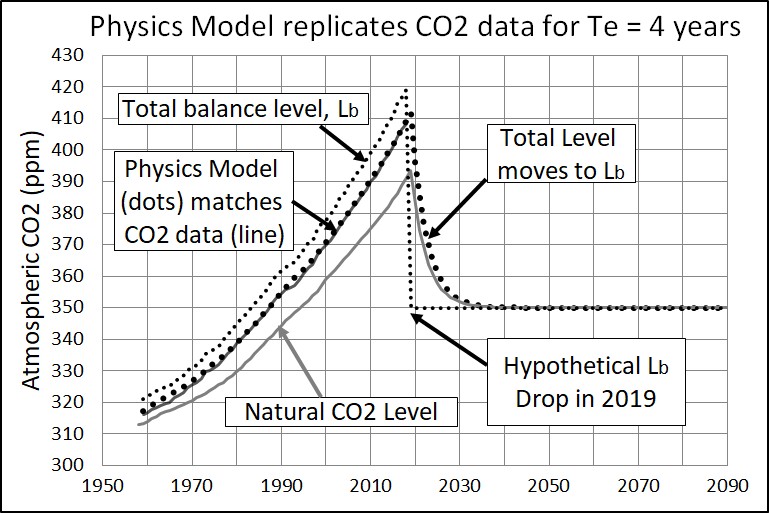
In Figure 14, the total balance level is the sum of natural and human balance levels. The balance level continues to rise. Level follows the balance level with a lag of about 4 years (the e-time), after the year 2000. This lag keeps the level about 10 ppm below the its balance level. Human CO2 adds to the natural level to produce the total level, about 15 ppm above the natural level.
In 2019, the balance level in Figure 14 is artificially reset to 350 ppm to test how fast the CO2 level moves to the new balance level. The total CO2 level falls to its new balance level of 350 ppm in about 10 years. No CO2 remains stuck in the atmosphere.
5.8 Ice-core data
IPCC claims “the observational CO2 records from ice cores … show that the maximum range of natural variability about the mean of 280 ppm during the past 1000 years was small.”
Using this invalid claim, IPCC assumes natural CO2 emissions remained constant within about one percent. IPCC’s invalid claim about ice-core data is the basis of IPCC’s invalid claim that human CO2 causes all the increase in atmospheric CO2 above 280 ppm. This increase is presently 130 ppm or 32 percent.
Siegenthaler and Joos [30] observed that ice-core data show natural CO2 increased by 17 ppm or 6 percent before 1900, when human CO2 emissions totaled only 5 ppm. These ice-core data contradict IPCC’s claim that natural CO2 emissions stayed constant after 1750.
Jaworoski [12] explains why ice-core data do not properly represent past atmospheric CO2. He concludes nature produces 97 percent of atmospheric CO2.
Proxy ice-core values for CO2 remained low for the past 650,000 years [10, 12]. If these ice-core values represent atmospheric CO2, then atmospheric CO2 did not cause any of the global warming in the last 650,000 years. And if CO2 did not cause global warming in the past, then the IPCC has lost its claim that CO2 causes present global warming [12].
Leaf stomata and chemical data prove the historical CO2 level was much higher than derived from ice cores [12]. There is no evidence that the pre-industrial CO2 level was 280 ppm as IPCC assumes.
Beck [13] reconstructed CO2 from chemical data show the level reached 440 ppm in 1820 and again in 1945.
IPCC’s claim that human CO2 produces all the increase in atmospheric CO2 above 280 ppm is invalid. In science, when data contradict a theory, the theory false. The IPCC, however, ignores how its theories contradict data.
6. Theories must be logical
6.1 IPCC’s response times fail physics
The Physics Model e-time has a precise definition: e-time is the time for the level to move (1 – 1/e) of the distance to its balance level.
Segalstad [10] observes IPCC [3] uses many definitions of lifetime — like residence time, transit time, response time, e-folding time, and adjustment time — in its quest to prove human CO2 remains in the atmosphere for hundreds of years. Many investigators, from 1957 to 1992, have calculated the e-time of atmospheric CO2 is about 5 years [10].
IPCC [3] defines “adjustment time (Ta)” as:
The time-scale characterising the decay of an instantaneous pulse input into the reservoir.
Cawley [5] defines “adjustment time (Ta)” as:
The time taken for the atmospheric CO2 concentration to substantially recover towards its original concentration following a perturbation.
The word “substantially” is imprecise.
Cawley follows IPCC to define “residence time (Tr)” as:
The average length of time a molecule of CO2 remains in the atmosphere before being taken up by the oceans or terrestrial biosphere.
Some authors use “residence time” to mean “e-time” but other authors, such as Cawley and IPCC, have a different meaning for residence time. This paper uses e-time because its definition is precise.
In summary, IPCC uses two different response times when it should use only e-time:
- When the level is far from its balance level (which can be zero), IPCC thinks e-time is an adjustment time because the level is moving rapidly toward its balance level.
- When the level is close to its balance level, IPCC thinks e-time is a residence time because “molecules” are flowing in and out with little change in level.
Figure 14 illustrates how e-time relates to IPCC’s adjustment and residence times.
IPCC defines “turnover time (Tt)” as:
The ratio of the mass M of a reservoir (e.g., a gaseous compound in the atmosphere) and the total rate of removal S from the reservoir: Tt = M/S.
IPCC’s turnover time seems to be the same as e-time except “removal” is not the same as outflow. Near the balance level, IPCC sometimes interprets “removal” to mean the difference between outflow and inflow.
IPCC says when outflow is proportional to level (the Physics Model hypothesis) then adjustment time equals turnover time. IPCC claims:
In simple cases, where the global removal of the compound is directly proportional to the total mass of the reservoir, the adjustment time equals the turnover time: Ta = Tt.
The Physics Model’s replication of the 14C data shows the 14CO2 outflow is proportional to level. Therefore, by IPCC’s own definition, adjustment time equals e-time equals residence time.
IPCC says in further confusion:
In more complicated cases, where several reservoirs are involved or where the removal is not proportional to the total mass, the equality T = Ta no longer holds.
Carbon dioxide is an extreme example. Its turnover time is only about 4 years because of the rapid exchange between atmosphere and the ocean and terrestrial biota.
Although an approximate value of 100 years may be given for the adjustment time of CO2 in the atmosphere, the actual adjustment is faster initially and slower later on.
IPCC agrees 12CO2 turnover time (e-time) is about 4 years. IPCC claims adjustment time is “fast initially and slower later on” which is why its Bern model cannot replicate the 14C data in Figure 9.
The 14C data show the e-time for 14CO2 is 16.5 years. This e-time is the upper bound for 12CO2 e-time. The IPCC claim of hundreds of years is based on IPCC’s misunderstanding of e-time.
Unfortunately, there are many different definitions of residence time. Therefore, this paper uses e-time with its exact definition.
6.2 IPCC’s first core argument is illogical
The IPCC [2] first core argument notes that human emissions from 1750 to 2013 totaled 185 ppm while atmospheric CO2 increased by only 117 ppm. These numbers are OK. But IPCC claims this proves human CO2 caused all the increase in atmospheric CO2 above 280 ppm. IPCC’s logic is faulty.
Figure 15 shows the IPCC first core argument.
However, the fact that the sum of human emissions is greater than the increase does not prove human CO2 caused the increase. The IPCC argument omits natural CO2 which totaled about 6000 ppm during the same period, much larger than the sum of human CO2.
Figure 16 shows the plot when the sum of natural CO2 is included.
The sum of natural CO2 from 1959 to 2018 is 5700. The sum of human CO2 over the same period is 170 ppm which is 3 percent of the natural CO2 sum. IPCC’s whole case depends upon its incorrect assumption that nature did not vary more that 3 percent since 1959 or since 1750. At the same time, IPCC admits it does not know nature’s CO2 emission within 50 percent.
The fundamental error in this IPCC argument is discussed in Section 3.1. The sums of inflows do not matter because inflows do not “add” to atmospheric CO2. Inflows set balance levels. The human effect on the total balance level is less than 5 percent.
6.3 IPCC’s second core argument is illogical
IPCC [2] claims nature has been a “net carbon sink” since 1750, so nature could not have caused the observed rise in atmospheric carbon dioxide. Please refer to Figure 5 that shows the inflow and outflow of atmospheric CO2.
Of course, nature is a “net carbon sink” because nature absorbs human CO2 emissions. However, absorption of human CO2 has no bearing whatsoever on how much natural CO2 flows into the atmosphere. Nature can set its inflow as it pleases, no matter how much human inflow nature absorbs. The 98-ppm natural flow can double or reduce to one-half while nature continues to absorb the outflow of the human addition to atmospheric CO2. So, the IPCC argument is absurd.
The Physics Model shows how CO2 inflows set balance levels in atmospheric CO2. At the balance level, outflow will equal inflow. No CO2 gets trapped in the atmosphere.
6.4 Key IPCC paper makes serious errors
Kohler [7] uses Cawley [5] to “prove” the IPCC case. But Cawley fails physics and statistics.
Cawley [5] is a key paper for the IPCC theory. Cawley claims human CO2 caused all the increase of atmospheric CO2 above the 280 ppm in 1750. But Cawley’s attempted proof fails physics.
Figure 17 shows three of Cawley’s equations.
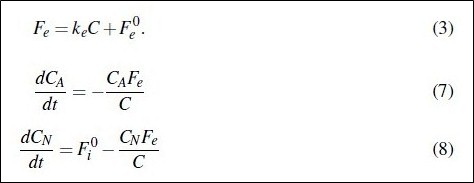
Cawley’s equation (3) attempts to do the same job as Physics Model (2), namely, to represent how level sets outflow. But Cawley adds to his equation (3) a second term that represents a steady-state outflow that is independent of level. Cawley’s added term is fictitious because his first term on the right side of his equation (3) is the true source of all outflow. As a result, all Cawley’s equations after his (3) are wrong, which makes his whole paper wrong.
Cawley’s equation (7) should include his Fa for human inflow. His equations (7) and (8) should omit his arbitrary Fe for outflow and set outflow equal to level (his C) divided by his residence time. His residence time is also inaccurate as shown in Section 6.1.
6.5 Statistical correlation
Cawley [5] argues,
Lastly, the rise in atmospheric carbon dioxide closely parallels the rise in anthropogenic emissions … which would be somewhat of a coincidence if the rise were essentially natural in origin!
IPCC [3] writes:
Second, the observed rate of CO2 increase closely parallels the accumulated emission trends from fossil fuel combustion and from land use changes.
IPCC incorrectly claims this proves human CO2 causes the increase in atmospheric CO2.
A standard scientific test for the non-existence of cause and effect is to show the correlation, of the assumed cause with the assumed effect, is zero.
For the IPCC to argue that human CO2 causes climate change, the IPCC must show that the correlation of human emissions with the increase in atmospheric CO2 is significantly greater than zero.
Proper statistics requires a detrended analysis of a time series to conclude cause and effect. Munshi [41] shows the “detrended correlation of annual emissions with annual changes in atmospheric CO2” is zero. Chaamjamal [42] extended Munshi’s calculations and found the correlations are zero for time intervals from one to five years.
Therefore, the standard statistical test for cause and effect proves human CO2 is insignificant to the increase in atmospheric CO2.
The ratio of annual change in atmospheric CO2 to annual human CO2 emissions that Munshi [41] tested is IPCC’s “airborne fraction”. Therefore, IPCC’s airborne fraction has no useful meaning.
An estimate of the airborne fraction is about 2.5 ppm/year divided by 5 ppm/year, or 0.5. Since the increase in level is caused by an increase in natural CO2 emissions, the airborne fraction has little physical meaning, and it would go to infinity if human emissions stopped.
Conclusions
The IPCC model and the Physics model compete to describe how human CO2 emissions add to atmospheric CO2. Both models agree that the CO2 inflow into the atmosphere is less than 5 percent human CO2 and more than 95 percent natural CO2.
The IPCC model concludes that human CO2 causes all the increase in atmospheric CO2 above 280 ppm; that 15 percent of all human CO2 emissions stays in the atmosphere forever; that 53 percent stays for hundreds of years; and only 32 percent flows freely out of the atmosphere like natural CO2.
The Physics Model treats human CO2 and natural CO2 the same because their CO2 molecules are identical. The Physics model makes only one hypothesis: CO2 outflow equals the level of CO2 in the atmosphere divided by e-time.
The Physics Model concludes that inflow sets a balance level equal to inflow multiplied by e-time, and that continuing inflow does not continue to increase atmospheric CO2. Rather inflow sets a balance level where outflow equals inflow and continuing inflow will not further increase the level of atmospheric CO2 beyond the balance level.
The proper test of two theories is not to claim the IPCC theory explains “observational evidence.” The proper test is the scientific method: if a prediction is wrong, the theory is wrong.
The 14C data following the cessation of the atomic bomb tests show how the level of CO2 in the atmosphere returns to its balance level after inflow decreases. All valid models of atmospheric CO2 must be able to replicate the 14C data.
The Physics Model exactly replicates the 14C data after 1970. This replication shows the e-time for 14CO2 is 16.5 years and that this e-time has been constant since 1970. The replication shows the Physics Model hypothesis — that outflow equals level divided by e-time — is correct.
The IPCC Bern model cannot replicate the 14C data. Its curve crosses the 14C data curve. The Bern model cannot even replicate itself if it is restarted at any point. This failure proves the IPCC Bern model does not have the mathematical structure for a valid model.
If natural CO2 is inserted into the Bern model, as physics requires, the Bern model predicts that 15 percent of natural CO2 inflow sticks in the atmosphere forever, which contradicts data and proves the Bern model is invalid.
The Physics Model concludes that the ratio of human to natural CO2 in the atmosphere equals the ratio of their inflows, independent of e-time, and that the e-times for both human and natural CO2 are the same. Using IPCC data, the e-time for 12CO2 is about 4 years.
The ratio conclusion means human CO2 adds only about 18 ppm and natural CO2 adds about 392 ppm to today’s CO2 level of 410 ppm. If all human CO2 emissions stopped and natural CO2 emissions stayed constant, then the level of atmospheric CO2 would fall only to 392 ppm in about 10 years. Nothing would be gained by stopping human CO2 emissions. There are no long-term effects of human CO2 emissions. Continued constant CO2 emissions do not add more CO2 to the atmosphere. Continued constant CO2 emissions simply maintain the balance level.
Acknowledgments
The author thanks Chuck Wiese, Laurence Gould, Tom Sheahen, Charles Camenzuli, and others who reviewed this paper and provided scientific critique and suggestions. The author thanks Daniel Nebert, Gordon Danielson, and Valerie Berry, who provided language and grammar suggestions.
This research did not receive any grant from funding agencies in the public, commercial, or not-for-profit sectors. This research was funded solely by the personal funds of the author.
Author’s contributions
The author declares he is the only contributor to the research in this paper.
Downloads
References
[1] USGCRP, 2017: Climate Science Special Report: Fourth National Climate Assessment, Volume I. U.S. Global Change Research Program, Washington, DC, USA, 470 pp; 2018. doi: 10.7930/J0J964J6. https://science2017.globalchange.gov/
[2] IPCC, 2001: Working Group 1: The scientific basis. The Carbon Cycle and Atmosphere CO2. https://www.ipcc.ch/site/assets/uploads/2018/02/TAR-03.pdf
[3] IPCC, 2007: Climate Change 2007: The Physical Science Basis. https://www.ipcc.ch/site/assets/uploads/2018/05/ar4_wg1_full_report-1.pdf
[4] D. Archer, M. Eby, V. Brovkin, A. Ridgwell, L. Cao, U. Mikolajewicz, et al., “Atmospheric Lifetime of Fossil Fuel Carbon Dioxide”. Annu. Rev. Earth Planet. Sci., 37, pp. 117–134; 2009. https://www.annualreviews.org/doi/pdf/10.1146/annurev.earth.031208.100206
[5] G.C. Cawley, “On the Atmospheric residence time of anthropogenically sourced CO2”. Energy Fuels 25, pp. 5503–5513; 2011. http://dx.doi.org/10.1021/ef200914u
[6] Z. Kern, M. Leuenberger, Comment on “The phase relation between atmospheric CO2 and global temperature” by Humlum et al. Glob. Planet. Change 100: 51–69.: Isotopes ignored. Glob. Planet. Chang. 109, 1–2; 2013. https://dx.doi.org/10.1016/j.gloplacha.2013.07.002
[7] P. Kohler, J. Hauck, C. Volker, D.A. Wolf-Gladrow, M. Butzin, J.B. Halpern, et al. Comment on “Scrutinizing the carbon cycle andCO2residence time in the atmosphere” by H. Harde, Global and Planetary Change; 2017. https://www.soest.hawaii.edu/oceanography/faculty/zeebe_files/Publications/KoehlerGPC17.pdf
[8] R. Revelle, H. Suess, “CO2 exchange between atmosphere and ocean and the question of an increase of atmospheric CO2 during past decades”. Tellus. 9: 18-27; 1957. http://onlinelibrary.wiley.com/doi/10.1111/j.2153-3490.1957.tb01849.x/abstract.
[9] C. Starr, “Atmospheric CO2 residence time and the carbon cycle”. Science Direct, 18, 12, pp. 1297-1310; 1992. https://www.sciencedirect.com/science/article/pii/0360544293900178
[10] T. V. Segalstad, “Carbon cycle modelling and the residence time of natural and anthropogenic atmospheric CO2: on the construction of the “Greenhouse Effect Global Warming” dogma”. In: Bate, R. (Ed.): Global warming: the continuing debate. ESEF, Cambridge, U.K. [ISBN 0952773422]: 184-219; 1998. http://www.co2web.info/ESEF3VO2.pdf
[11] Z. Jaworowski, “Climate Change: Incorrect information on pre-industrial CO2”. Statement written for the Hearing before the US Senate Committee on Commerce, Science, and Transportation. 2003. http://www.mitosyfraudes.org/Calen5/JawoCO2-Eng.html
[12] Z. Jaworowski, “CO2: The Greatest Scientific Scandal of our Time”. 21st CENTURY Science & Technology. 2007. https://21sci-tech.com/Articles%202007/20_1-2_CO2_Scandal.pdf
[13] E. Beck, “180 Years of Atmospheric CO2 Gas Analysis by Chemical Methods”. Energy & Environment. Vol 18, No. 2. 2007. https://21sci-tech.com/Subscriptions/Spring%202008%20ONLINE/CO2_chemical.pdf
[14] A. Rorsch, R.S. Courtney, D. Thoenes, “The Interaction of Climate Change and the CO2 Cycle”. Energy & Environment, Volume 16, No 2; 2005. https://journals.sagepub.com/doi/pdf/10.1260/0958305053749589
[15] R.S. Courtney, “Limits to existing quantitative understanding of past, present and future changes to atmospheric CO2 concentration”. International Conference on Climate Change, New York. 2008. https://www.heartland.org/multimedia/videos/richard-courtney-iccc1
[16] T, Quirk, “Sources and sinks of CO2”. Energy & Environment. Volume: 20 Issue: 1, pp. 105-121. 2009. https://journals.sagepub.com/doi/10.1260/095830509787689123
[17] R.E. Essenhigh, “Potential dependence of global warming on the residence time (RT) in the atmosphere of anthropogenically sourced CO2”. Energy Fuel 23, pp. 2773-2784; 2009. https://pubs.acs.org/doi/abs/10.1021/ef800581r
[18] J.A. Glassman, “On why CO2 is known not to have accumulated in the atmosphere and what is happening with CO2 in the modern era”. Rocket Scientist Journal; 2010. https://www.rocketscientistsjournal.com/2007/06/on_why_co2_is_known_not_to_hav.html#more
[19] M. L. Salby, “Physics of the Atmosphere and Climate”. Cambridge University Press. 2012. (ISBN: 978-0-521-76718-7) https://www.amazon.com/Physics-Atmosphere-Climate-Murry-Salby/dp/0521767180/ref=mt_hardcover?_encoding=UTF8&me=
[20] M. L. Salby, “Relationship Between Greenhouse Gases and Global Temperature”. Video Presentation, April 18, 2013. Helmut-Schmidt-University Hamburg. https://www.youtube.com/watch?v=2ROw_cDKwc0
[21] M. L. Salby, “Atmosphere Carbon”. Video Presentation, July 18, 2016. University College London. https://www.youtube.com/watch?v=3q-M_uYkpT0&feature=youtu.be
[22] M. L. Salby, “What is really behind the increase in atmospheric CO2?” Video Presentation, October 10, 2018. Helmut-Schmidt-University Hamburg, Germany. https://www.youtube.com/watch?time_continue=10&v=rohF6K2avtY
[23] O. Humlum, K. Stordahl, J.E. Solheim, “The phase relation between atmospheric CO2 and global temperatures”. Global and Planetary Change, 100, pp 51-69, 2013. https://www.sciencedirect.com/science/article/pii/S0921818112001658
[24] H. Harde, “Scrutinizing the carbon cycle and CO2 residence time in the atmosphere”. Global and Planetary Change. 152, 19-26; 2017. https://www.sciencedirect.com/science/article/pii/S0921818116304787. (https://edberry.com/wp-content/uploads/Climate/HardeHermann17-March6-CarbonCycle-ResidenceTime.pdf)
[25] H. Harde, “What Humans Contribute to Atmospheric CO2: Comparison of Carbon Cycle Models with Observations”. International Journal of Earth Sciences Vol. 8, No. 3, 2019, pp. x=x. doi: 10.11648/j.earth.20190803.xx http://article.esjournal.org/pdf/10.11648.j.earth.20190803.13.pdf
[26] E. X Berry, “A fatal flaw in global warming science”. Basic Science of a Changing Climate. Porto University, Portugal. Sep 7; 2018. https://www.portoconference2018.org/uploads/1/1/7/3/117342822/11_edwinberryportosep7final.pdf
[27] E. X Berry, “Contradictions to IPCC’s climate change theory”. Annual meeting of the American Meteorological Society, Phoenix; 2019. https://ams.confex.com/ams/2019Annual/meetingapp.cgi/Paper/349565
[28] T. Boden, B. Andres, (2017) Global CO2 emissions from fossil-fuel burning, cement manufacture, and gas flaring: 1751-2014. http://cdiac.ornl.gov/ftp/ndp030/global.1751_2014.ems.
[29] H. B. Dwight, “Tables of Integrals and Other Mathematical Data” Item 90.1. MacMillian Company; 1955. https://www.amazon.com/Tables-Integrals-Other-Mathematical-Data/dp/0023311703
[30] U. Siegenthaler, F. Joos, “Use of a simple model for studying oceanic tracer distributions and the global carbon cycle”. Tellus, 44B, 186-207; 1992. https://onlinelibrary.wiley.com/doi/10.1034/j.1600-0889.1992.t01-2-00003.x/epdf
[31] E. Maier-Reimer, L. Hasselmann, “Transport and storage of CO2 in the ocean – an inorganic ocean-circulation carbon cycle model”. Climate Dynamics 2(2):63–90; 1987. DOI: 10.1007/BF01054491
[32] F. Joos, R. Roth, J. S. Fuglestvedt, G. P. Peters, I. G. Enting, von Bloh, et al. “Carbon dioxide and climate impulse response functions for the computation of greenhouse gas metrics: a multi-model analysis”. Atmospheric Chemistry and Physics 13(5), doi: 10.5194/acpd-12-19799-2012. Atmos. Chem. Phys. 13, 2793-2825; 2013. https://www.atmos-chem-phys.net/13/2793/2013/acp-13-2793-2013.pdf
[33] F. Joos, “Parameters for tuning a simple carbon cycle model”. 2002. https://unfccc.int/resource/brazil/carbon.html
[34] Q. Hua, M. Barbetti, A. Z. Rakowski. “Atmospheric radiocarbon for the period 1950–2010”. RADIOCARBON, Vol 55, pp. 2059–2072. Table S2c. 2013. https://doi.org/10.2458/azu_js_rc.v55i2.16177
[35] J. C. Turnbull, S. E. Mikaloff Fletcher, I. Ansell, G. W. Brailsford, R. C. Moss, Norris, et al. “Sixty years of radiocarbon dioxide measurements at Wellington, New Zealand: 1954–2014”. Atmos. Chem. Phys., 17, pp. 14771–14784. 2017. https://doi.org/10.5194/acp-17-14771-2017
[36] I. Levin, T. Naegler, B. Kromer, M. Diehl, R. Francey, A. Gomez-Pelaez, et al., “Observations and modelling of the global distribution and long-term trend of atmospheric 14CO2”. Tellus B: Chemical and Physical Meteorology. 2010. https://www.tandfonline.com/doi/abs/10.1111/j.1600-0889.2009.00446.x
[37] Wikipedia: Isotopes. https://simple.m.wikipedia.org/wiki/Isotope
[38] A. P. Ballantyne, C. B. Alden, J. B. Miller, P. P. Tans, J. W. C. White, “Increase in observed net carbon dioxide uptake by land and oceans during the past 50 years”, Nature 488, pp. 70-73, 2012. doi:10.1038/nature11299. https://www.researchgate.net/publication/230615762_Increase_in_observed_net_carbon_dioxide_uptake_by_land_and_oceans_during_the_past_50_years
[39] RealClimate, “How do we know that recent CO2 increases are due to human activities?”. 2004. http://www.realclimate.org/index.php/archives/2004/12/how-do-we-know-that-recent-cosub2sub-increases-are-due-to-human-activities-updated/
[40] R. Spencer, “A simple model of the atmospheric CO2 budget”. 2019. http://www.drroyspencer.com/2019/04/a-simple-model-of-the-atmospheric-co2-budget/
[41] J. Munshi, “Responsiveness of atmospheric CO2 to fossil fuel emissions: Updated”. SSRN; 2017. https://papers.ssrn.com/sol3/papers.cfm?abstract_id=2997420
[42] Chaamjamal, “Fossil fuel emissions and atmospheric composition”. Thongchai Thailand. 2019. https://tambonthongchai.com/2018/12/19/co2responsiveness/
I believe that this reference has already covered what the current paper is saying. (Unfortunately it is in Swedish)
http://falsktalarm.se/onewebmedia/Falskt%20Alarm%20full%20web%20version%2020190219.pdf
Dear Jan, Thank you for this link. Gosta Pettersson has done very good work.
Congratulations Dr. Ed! I do hope your paper and Harde’s new paper get wide exposure. I mentioned them on Climate Etc. and was notified that the publishers are on Beal’s list. I hope this will not influence response to the truth they contain. I have had conversations shut down when I tried to discuss other Beal’s list works. I think the new changes are good for the readability and coverage of this most important topic.
I did note a typo in the last sentence of section 5.8.
Dear DMA, Thank you for your comment and the note about my type that I have now fixed.
Beal’s list never was relevant and has now died. Beal was a librarian who had no experience with how scientific journals work.
Also, Science PG purchased the International Journal of Atmospheric and Ocean Sciences and significantly upgraded it. My experience with journals is that the Science PG is now the best I have dealt with. I don’t say this just because a Science PG journal accepted my paper. I say this because it is an excellent journal group. They did the best reviews of my paper and sent me the most useful comments.
Compare the several journals that rejected my paper solely on the basis that my conclusions without being able to show my paper had any scientific faults. Those are biased journals. They include the journals by the American Meteorological Society, of which I am a member and a certified consulting meteorologist.
Second to last paragraph in conclusion typo-atmospheric
Got it and fixed. Thanks.
Dr Berry, great exposition. I note the bicycle pump analogy is based on air pressure. In my opinion, your explanation would benefit from more explicit reference to equilibrium atmospheric air pressure in relation to the sources and sinks for CO2.
It seems to me that modern plants are taking up CO2 that was sequestered by ancient plants in the form of coal. This process sets and maintain equilibrium air pressure both on land and in the world ocean as you describe in your paper.
Source: https://www.nasa.gov/feature/goddard/2016/carbon-dioxide-fertilization-greening-earth
Dear Frederick, Air pressure has the same effect as partial pressure of CO2 in the atmosphere. Chemically, it is known that chemical reactions are proportional to partial pressure or concentration of a molecule.
While what you say is true, I don’t include the history of molecules because molecules do not know their history. Therefore, history should not be used in a physical model.
A very good read. My devil’s advocate question might be whether the 5% human CO2 overwhelms and slows the equilibrium process, at least from a human-based time scale perspective? Perhaps that was addressed, as I am reading this in “sleepy mode” before bed.
Dear Bill, The fact that the Physics Model replicates the 14C data and shows the e-time for the 14C data is constant, is proof that the 5 percent human CO2 has not affected the equilbrium process.
Thanks Ed. I need to digest first.
BTW you may be aware of this but I add it to my comment.
re: Stomatal proxy record of CO2, where they have a nice figure (Figure 8) comparing the stomatal record with the ice core record.
From Abstract: The record is of high chronological resolution and spans most of Greenland Interstadial 1 (GI-1a to 1c, Allerød pollen zone), Greenland Stadial 1 (GS-1, Younger Dryas pollen zone) and the very beginning of the Holocene (Preboreal pollen zone).
Paper link: https://doi.org/10.1016/j.quascirev.2013.02.003
Title: Stomatal proxy record of CO2 concentrations from the last termination suggests an important role for CO2 at climate change transitions
Authors: Margret Steinthorsdottira et al.
Cheers,
John Barrett
Dear John, Thank you for that reference. I will use it. It shows that atmospheric CO2 was much higher than derived from ice-core data. This shows the IPCC claim that historical CO2 was below 280 ppm is invalid. The referenced paper does not show that CO2 was important to climate change. The fact that the CO2 concentration was high does not prove it caused climate change. Other studies, like Salby, prove the CO2 concentration follows temperature.
How is the percentage of human CO2 inflow into the atmosphere (5 %) calculated? How/where did the IPCC arrive at this figure?
Thanks and good luck with the paper.
Dale
Dear Dale, Bowen [28] calculated the human CO2 inflow. Many IPCC studies produced the natural CO2 inflow.
As an interested layperson in the field, the only complaint I have is that there didn’t seem to be any definitions of ‘human’ versus ‘natural’ sources of CO2.
Perhaps this is a ‘given’ in the community, but if I were trying to explain the illogic of the IPCC, I think I should know those definitions up-front in a paper like this, rather than have to research the definitions.
Excellent paper, and I hope it’s a great stepping-stone to stopping the MMGW stupidity that’s engulfing the planet…
Dear Alan, Thank you for your comment. Indeed, the science world realizes the CO2 produced by human activities causes the human inflow. However, in my public presentations, I will be sure to make this clear to my audience.
Dear Dr. Ed,
Unfortunately I couldn’t be in Porto to further discuss your work, but as you know, I do disagree a lot on several of your basic assumptions…
To keep it short: let us begin with Figure 2.
That shows one inflow, a container and one outflow. In reality, there are several inflows and outflows, which shouldn’t make a difference if they all were active in the same direction, but that is not the case.
The formula that you use in general is to calculate the residence time:
residence time = mass / throughput (or input or output once in equilibrium).
For the current atmosphere that gives:
410 ppmv / 98 ppmv/year = 4.2 years
For the residence time it doesn’t matter in what direction the flows are going: as long as that is trough the atmosphere that adds to the throughput in the above formula.
You can use the opposite formula if and ONLY IF all flows are unidirectional. The problem is that the main CO2 fluxes are seasonal and for ocean surface and vegetation each other’s opposite. And opposite over the hemispheres.
That means that the the bulk of the outputs are NOT caused by the CO2 pressure in the atmosphere, as that only shows a small change around an average (globally +/- 5 ppmv/season mostly in the NH), but by the huge seasonal temperature changes in both ocean surface and vegetation.
Over the past about 60 years, the CO2 level in the atmosphere increased with about 30%. With your formula, that should mean that the outflow (and also the inflow) increased some 30% over time. That also means that the residence time would have been reduced with some 30%.
There is zero evidence for that, to the contrary: if you take the many estimates of the residence time:
http://jennifermarohasy.com//wp-content/uploads/2009/09/Carbon-dioxide-residence-time.jpg
and sort them on date, you will see that the average of the more recent estimates show a longer residence time that the average of the older ones. That points to a rather stable natural carbon cycle in an increasing mass of CO2 in the atmosphere.
There is also no evidence for more amplitude in the seasonal exchanges, only an increased residual over time:
http://www.ferdinand-engelbeen.be/klimaat/klim_img/seasonal_CO2_MLO_trend.jpg
Again, that points to a rather stable natural carbon cycle (for the seasonal part) over time.
Dear Ferdinand, Welcome back.
I think you mean to refer to my Figure 3 since Figure 2 is only an analogy to help readers nonscientific readers to understand my Figure 3.
Yes, Figure 3 shows only one inflow and one outflow. The text explains “The Physics Model applies independently and in total to all definitions of CO2, e.g., to human CO2, natural CO2, and their sums, and to 12CO2, 13CO2, and 14CO2, and their sums.”
The model definition does not require multiple inflow and outflow. Simply replicate the model to achieve this.
You say the flows described in Fig 3 are not unidirectional in nature. I beg to differ. The net flows, as you show, are not unidirectional but the flows are unidirectional. The net flows can go negative when outflows are greater than inflows. The Physics Model does not need to consider these details because it shows how inflow sets the balance level and how the level will always approach the balance level. Also, the annual flows are the sum of the monthly inflows.
The fact that the Physics Model exactly replicates the 14C data shows that outflow always equals level divided by e-time, independent of inflow.
Let’s assume over the past 60 years, the CO2 level increased 30 percent as you suggest. The 14C data show e-time has been constant. This rejects your hypothesis that the residence time decreased over the past 60 years. This means inflow increased by 30 percent and raised the balance level of CO2.
Dear Dr. Ed,
Let us consider the main seasonal flows, as that shows where it goes wrong:
In spring/summer, some 30 ppmv CO2 is absorbed by vegetation, independent of the current CO2 level in the atmosphere. In reality there is a peak outflow from the atmosphere into vegetation when there is a peak drop in CO2 level in the atmosphere June-August.
That is simply the opposite of Figure 3, where an increase in CO2 in the reservoir induces an increase in outflow.
The opposite happens in fall/winter, where there is some 30 ppmv inflow, while the CO2 levels are increasing. Again opposite to Figure 3.
The ocean inputs and outputs (around 25 ppmv/season) do go up and down with the temperature over the seasons, but the overall balance is that vegetation wins the contest with about 5 ppmv/season.
Your basic assumption is that the inflows set the balance level, but that is clearly wrong for the seasonal flows which are already half the total in/outflows. Both inflows and outflows are temperature driven, practically independent of how much CO2 is already in the atmosphere.
On the other side, your physics model is right, as that requires a different approach: that is completely independent of the height of the inflows and outflows (thus the residence time) as it only depends of the difference between inflows and outflows. That difference is quite linear in ratio with the extra CO2 above the dynamic equilibrium over the past 60 years of rather accurate CO2 measurements.
My (and the IPCC’s) point is that the removal of the extra CO2 above equilibrium has nothing to do with the short (4-5 years) residence time (which is temperature driven), but with the decay rate of any extra CO2 above equilibrium (which is pressure driven). The latter is around 50 years.
An extra assumption by the IPCC is that the oceans are saturating, leading to a long tail in uptake, which I don’t agree with.
It is not my hypothesis that the residence time decreased, it follows from your hypothesis: the CO2 level increased some 30% over the past 60 years. That is only possible if the inputs increased some 30% (or more) over the same period according to your hypothesis and thus the outflows also increased some 30% (or less) over the same period. As the formula for residence time is mass/throughput, that implies a 30% faster residence time. None of these assumptions is true, except for the 30% rise in the atmosphere which is observed.
That means that your basic assumption can’t be true…
At last: the decay rate of a 14CO2 peak is faster than for a 12CO2 peak, because what goes into the deep oceans is the 14/12CO2 ratio of today, but what returns today is the 14/12CO2 ratio of about 1000 years ago, long before any human use of fossil fuels or atomic tests.
That makes that in the year 1960, at the peak of the bomb tests 14CO2, some 97.5% of all 12CO2 returned in the same year from the deep oceans as was absorbed, but only 45% of 14CO2. That gives that the decay rate for a 14CO2 peak is at least 3 times faster than for a 12CO2 peak:
http://www.ferdinand-engelbeen.be/klimaat/klim_img/14co2_distri_1960.jpg
Dear Dr. Ed,
A second point of discussion at the root of the difference in opinion is the fact that there are two different decay rates: one is the residence time, which governs the exchange rates between the different carbon containing compartments (mainly atmosphere and surface/deep ocean and vegetation) and the other the decay rate of any sudden (or slow) addition of CO2 above the dynamic equilibrium between these four compartments. Other compartments (like rock weathering) are much smaller and/or slower in their exchanges over a year and are not included here.
The first decay rate is what one can call the turnover of a factory:
The total amount of raw materials through a factory: that is the capital that passes the factory over a year.
The second decay rate is one can call the gain (or loss) of the same factory:
That is the total amount of capital passing the factory minus the total costs (equipment + labor) over a year.
There is some remote connection between the two, but a doubling of the turnover doesn’t imply a doubling of the gain: it may be that you introduced a loss as you need to pay more overtime….
Back to CO2:
The observed decay rate for the residence time is some 4-5 years.
The observed decay rate for any excess CO2 is some 51 years.
Both are practically independent of each other.
In your work, you use both types of decay rates as if they are the same, which is not the case:
Figure 1. shows the physics ratio as 95:5 natural:human, which is true for the rate of individual molecules (if there were only unidirectional flows), while the IPCC shows the mass ratio, which is based on the second decay rate. Both are (more or less) right, because while many human CO2 input molecules are every year exchanged for natural molecules, the total mass of CO2 increases because the amount of human CO2 (as mass!) added each year is not removed (as mass!) in the same year as released by the second decay rate. Therefore the total increase in CO2 mass is (near) entirely caused by the human emissions, even if only 5% of the total emissions are human.
What I always wonder, is why so many skeptics never use the complete mass balance. No bookkeeper in this world would accept a balance with only incomes and no expenses…
Inflows: 95% natural, 5% human.
Outflows: 97.5% natural, 0% human.
Balance: -2.5% removed by nature, remainder in the atmosphere: +2.5%, completely caused by the human addition (again as mass, not the original human emitted molecules!).
Dear Ferdinand,
Section 6.1 addresses your comment about residence time and decay rates. The atmosphere is one system. A system can have only one e-time. The idea that there is a fast and slow time is absurd. Indeed, there may be some outflows that have a higher or lower e-time than the average. If so, their contribution to overall e-time gives only one e-time.
To make it simple. The Physics Model and its successful replication of the 14C data show there is only one e-time and it is constant since 1970. This means we must reject your hypothesis of multiple e-times.
You say the “observed” decay rates for natural CO2 is 4 to 5 years. I call that e-time. You also say the “observed” decay rate for “excess CO2” is 51 years. I disagree. There are no such observations. There are claims based on invalid models. I address that in Section 4.1. The idea that “excess CO2” has a longer e-time is not supported by data and is rejected by data.
Figure 1 shows the overall problem. The average annual CO2 inflow is about 5% human and 95% natural. The Physics Model and common sense require that the ratio in the atmosphere equals the ratio of the inflows.
By contrast, the IPCC claims human CO2 causes all the increase in atmospheric CO2 above 280 ppm. The IPCC theory claims this happens because human CO2 does not exit the atmosphere as fast as natural CO2. That claim violates physics and is wrong.
You argue that individual molecules have a different e-time than the overall flows. The 14C data prove e-time is constant over the whole range of levels where you claim e-time changes.
As Figure 14 shows, when the level is far from its balance level, you call e-time “adjustment” time. When the level is close to its balance level, you call e-time “residence” time. At the balance level, the level is constant while molecules continue to change places. We don’t care about molecular musical chairs because e-time explains everything we can measure about how the CO2 level changes.
You suggest that the Physics Model does not balance mass. Please note that equation (1) is the mass balance. Please refer to Figure 5. It shows how mass balances with inflows and outflows. We should agree with Figure 5.
The Physics model describes what must happen in the atmosphere to achieve the mass balance of Figure 5. By contrast, the IPCC has no model that properly shows what must happen in the atmosphere to achieve the mass balance of Figure 5.
The IPCC goal is not to simulate nature but to develop an argument, even if irrational, that shows human CO2 causes all the increase in atmospheric CO2
The Physics Model wins by Occam’s Razor and its ability to replicate the 14C data. The IPCC complex hypothesis loses by Occam’s Razor as well as by its inability to replicate the 14C data.
Thank you again, Ferdinand. Your comments are always welcome.
Dear Dr. Ed,
I fear that we don’t come to an agreement – again, thus this is my last response:
The atmosphere indeed is one system, but there is a tremendous difference between residence time, which is all about mass flows passing a mass of CO2 in the atmosphere and the removal of some extra 12/13/14CO2 above equilibrium, which is only possible with a difference between total inputs and outputs, no matter the absolute height of the inflows and outflows. Or the difference between turnover and gain (or loss) of a factory, even if that is also one system.
The average annual CO2 inflow is about 5% human and 95% natural. The Physics Model and common sense require that the ratio in the atmosphere equals the ratio of the inflows.
Again, that is only true IF and ONLY IF all flows are unidirectional. The observed 13C/12C ratio in the atmosphere shows that the human component is currently at about 9% of the atmosphere. That is nearly twice the theoretical 5% of the inputs according to your theory.
Moreover, again the 5% is small part of the turnover, but even so that 5% can give the difference between gain or loss, in this case 100% of the gain of your shares in a factory…
Moreover, the e-fold decay rate for a peak of 14CO2 is about 14 years, while the e-fold decay rate of the residence time is only 4-5 years and for a peak of 12CO2 over 50 years. That are already three different e-fold times in the same atmosphere…
The observed decay rate for the residence time is 415/98 = 4.2 years
The observed decay rate for an excess 12/13CO2 is:
In 1959: 25 ppmv extra, net sink 0.5 ppmv/year: 50 years.
In 1988: 60 ppmv extra, net sink 1.13 ppmv/year: 53 years.
In 2012: 110 ppmv / 2.15 ppmv/year = 51.2 years.
Seems very linear to me and a 10-fold slower than the residence time…
You can plot the calculated increase of CO2 in the atmosphere based on human emissions minus the calculated net sink rate with the above 51 years e-fold decay rate and that shows midst of the natural variability over the past 60 years:
http://www.ferdinand-engelbeen.be/klimaat/klim_img/dco2_em2B.jpg
Please don’t put ideas in my (and the IPCC’s) mind that I or they never said or used:
The IPCC theory claims this happens because human CO2 does not exit the atmosphere as fast as natural CO2
The IPCC never claimed that, neither did I and they and me also never claimed that the decay rates changed over time. Only that there are different decay rates for an individual molecule, before being swapped with a CO2 molecule from another reservoir (which doesn’t change the total amount of CO2 in the reservoirs at all) and the decay rate of an extra portion of CO2 (whatever the source or cause) above equilibrium…
The same for Figure 1: while human CO2 is only 5% of the input, the observed % in the atmosphere is already 9% and the total increase in mass by human emissions is 31%, of which over time thus 22% already is “diluted” by natural CO2, which exchanges over 20%/year of all atmospheric CO2 with CO2 from other reservoirs. That is the result of the residence time: while (near) 100% of the increase in mass is caused by humans, a large part is replaced by natural CO2 by the huge natural exchanges, which don’t add any net CO2 mass to the atmosphere…
At last: equation 5 still is not in balance: there still is a difference of 2.3 ppmv more inflow than outflow, which is totally caused by the 4.6 ppmv human emissions, as there are no human outflows. To reach the balance, the extra CO2 pressure in the atmosphere must be high enough to press 4.6 ppmv/year in natural sinks, which is the case at about 4.6*51 ppmv above equilibrium, that is 280 + 235 = 515 ppmv, or about double the excess CO2 of today…
I’m not a fan of any variation of the ghg theory, but for the sake of argument, I think that irrigated agriculture provides at least one anthropogenic CO2 sink, at least when the crops are growing and the sun is shining. This would be the case regardless of the minuscule changes in relative per mil of CO2, or CO2’s isotopic ratios (although uptakes of different isotopes of C by plants do vary).
The amount of irrigated acreage is perhaps significant when one considers regions such as the Nile Valley and the Western US, including California’s Central and Imperial Valleys. I suppose there are studies which relate. In any case, I am curious why given this feature that Ferdinand would state that there are no anthropogenic sinks of this gas. Ferdinand, if you haven’t cut the dialogue permanently, I’d be interested to hear your thoughts.
By the way I hope both Ed and Ferdinand continue to explore and debate climate with each other because it seems refreshing to read, and there are precious few platforms remaining I think.
Mike,
Agriculture is the human part of the large biological cycle which exchanges a lot of CO2 and O2 (and some CH4 and other stuff) with the atmosphere, including rather large isotopic changes.
Indeed agriculture removes a lot of CO2 from the atmosphere, but most of it is consumed (or composted or decayed) within months to a few years. For forests even a few decades to a few centuries, but at last, almost all of it returns to the atmosphere in short term.
The biological human CO2 balance depends of the total amounts added and removed by agriculture and land use changes. Until now, that seems more negative than positive: more (tropical) forests are cut and burned than new forests are planted (in more temperate areas).
I have not used these figures in any calculation, as the figures are quite uncertain and rather small compared to the use of fossil fuels.
What we have about the overall balance of the total biological cycle is more interesting: Fossil fuel use needs oxygen, thus one can calculate the oxygen use from fossil fuel sales (taxes!) and burning efficiency. Plant CO2 uptake produces oxygen and plant decay/food/feed uses oxygen. The difference between observed O2 decline and calculated from fossil fuel use thus gives you what the total biosphere (including human land use) does.
That shows that the whole biosphere is a net O2 source, thus a net CO2 sink and preferentially a 12CO2 sink, leaving relative more 13CO2 in the atmosphere, the earth is greening:
http://www.bowdoin.edu/~mbattle/papers_posters_and_talks/BenderGBC2005.pdf
Has the great climatologist, Eric Grimsrud, presented you with his appraisal of your great paper yet? He is very opposed to air travel and I hope that he does not become like radicalized Muslims and start to blow airplanes up to keep them from adding his hated devil in the sky, CO₂, into the atmosphere. As usual, he is out of the loop on that point about airplanes and cars and which is the best way to travel.
“Surprisingly, Airplanes More Energy Efficient Than Cars
In fact, unless you drive a car that gets 33.8 gallons per mile (or carry more than one passenger), new airplanes coming off the assembly line are more fuel-efficient, according to researchers at University of Michigan’s Transportation Research Institute.
“Fuel economy must improve 57% (from the current average of 23.8 mpg) in order for light-duty vehicles to match the current energy efficiency of commercial airline flights,” notes Michael Sivak at University of Michigan. The option is for cars to carry at least 2.3 people, up from 1.38 today. That could happen given the trend toward car-sharing and ride-sharing.”
http://www.sustainablebusiness.com/index.cfm/go/news.display/id/25497
I have no idea why anyone would be interested in this; but, this is Eric Grimsrud’s latest attempt to save the planet and perhaps a few of the inhabitants on it. “The desire to save humanity is always a false front for the urge to rule it” — H L Mencken
Some overdue criticism of the airlines June 14, 2019
The article referred to below is a “must read” for the multitude of Americans that are so in love with and/or dependent on travel by aircraft that they ignore its great contribution to global warming. See it at:http://www.politico.eu/article/the-popular-revolt-against-flying-climate-european-airlines-carbon-emissions/
https://ericgrimsrud.org/2019/06/14/some-overdue-criticism-of-the-airlines/
Dear Ed
Ref. your fig 4.
Could you please add labels on the horisontal and vertical axis ?
I have been struggling somewhat to know for sure what time it takes for inflows and outflows to balance out – I have reasoned this time to be around 4 years and would like to be more certain on this.
Best regards
Dear Ove, Thank you. Your comment came just in time for me to update this figure in the galley proof the journal sent to me this morning. See my revised Figure 4 with proper labels on the axes.
Nice for me to hear your reply on this Ed.
It certainly helped me in clearing up my own mind on this issue.
Ed, I don’t get it. If you add 5% man caused CO2 PER YEAR to the atmosphere, in just ten years, you will have an atmosphere with very roughly 50% of the CO2 being man-caused. Just like a bank savings count yielding 5%, after 10 years, your account will be mainly that due to interest.
I will be very surprised if your paper has, in fact, been accepted (as written). But do keep us posted on that detail.
Eric
Sorry, after 10 years at 5% your savings account would be roughly 50% due to interest.
Dear Eric, Welcome back. Indeed, you don’t get it. Please read Section 3 again. It shows how inflow does not “add” to the CO2 in the atmosphere. Inflow sets a balance level. When the level is at the balance level, then outflow equals inflow and the level remains constant.
It’s like having a leak in your savings account where your money leaks out as fast as you put it in.
Ed, I see things differently. When fossil C is burned, the amount of C in the biosphere in increased and that C will stay in the biosphere for centuries as it cycles between the atmosphere, plants, animals and the oceans. Thus if we add 5% C to the biosphere by ff burning, the amount of C in the biosphere increases by that amount every year. After several decades the amount of C in each of these biosphere reservoirs will have increased by roughly 5 x number of years %. Thus the CO2 in the atmosphere becomes roughly what it is today, about 50% greater than it was before the Industrial Rev.
Simple: We are continuously converting Geo carbon to biocarbon. So, of course, mankind is adding CO2 to the atmosphere as well as the oceans and plants. About half will reside in that atm.
Eric
Dear Eric, Fair enough, but you must consider the following.
Your first 3 sentences agree with Figure 5. Indeed, human CO2 is added to the biosphere. Some of it will go to the bottom of the ocean and not get recycled. Some of the CO2 reservoirs will absorb more human CO2, some less. But what you write is close enough for government work, meaning for our discussion.
Given Figure 5, the question is: How much does human CO2 inflow increase the level of CO2 in the atmosphere?
Your theory concludes human CO2 has caused all the increase in atmospheric CO2 since 1750 while natural CO2 inflow stayed constant. Your theory is the same as the Bern model, if I understand your comment correctly.
The Physics Model concludes that human and natural CO2 inflows must increase the CO2 level in the atmosphere in proportion to their inflows, which is about 5% to 95%. Therefore, it concludes that human CO2 inflow increases the level by about 18 ppm and natural CO2 inflow increases the level by about 392 ppm. Those are balance levels where outflow equals inflow.
Both models agree with Figure 5 except for the ratio of human to natural CO2 in the atmosphere.
The necessary test for all models, of how CO2 flows through the atmosphere, must be their ability to replicate the 14C data after 1970. Only the Physics Model can replicate the 14C data.
The replication also shows that e-time has remained constant since 1970. This means the increase in atmospheric CO2 from whatever cause, has not overburdened the ability of the CO2 sinks to absorb that increase.
The Bern model fails to replicate the 14C data. Therefore, we must reject the Bern model.
Dr. Ed,
Indeed this is where we differ in opinion…
1. According to your theory, the inputs (human + natural) must have increased with some 30% since 1960, because the CO2 levels increased with some 30% in (not yet complete) equilibrium.
2. According to your theory, for a constant e-time of 4 years in 1960 up to now and a level of 315 ppmv and a human contribution of 1.1 ppmv/year in 1960, the natural inputs must have been around 78 ppmv/year, indeed an 28% increase since that year.
3. There is no evidence whatever to support a 30% increase in natural inputs since 1960. To the contrary: all estimates for the (residence) e-time show an increase over time which points to a rather constant carbon cycle in an increasing CO2 level of the atmosphere.
4. The e-time for the 14C decay in Figure 7. is 16.5 years, while the e-time is 4 years in all your basic calculations. Indeed that are two different e-times which don’t agree with each other for the simple reason that the 4 years is only swapping CO2 molecules (but influences the isotopic ratios) between reservoirs, while the second changes the CO2 masses in the reservoirs. In the case of 14CO2, both are influencing the 14C level in the atmosphere, but in the case of a bulk 12/13CO2 the e-time is around 51 years and the 4 years residence e-time plays no role at all.
5. The observed level of human CO2, based on the 13C/12C ratio in the atmosphere is around 9%, way above the 4.4% input according to your theory. That is because your theory assumes that equilibrium levels are set by the inputs, while in reality the equilibrium levels are set by the ocean surface temperature and inputs and outputs are mostly set by temperature too. Human emissions are temperature independent and only can be removed by the difference between inputs and outputs and that is a pressure dependent process, hardly temperature dependent.
As said before, different mechanisms, like between the turnover of your money at the bank and the gain (or loss) you make after a year, where Eric Grimsrud shows the same approach which is the only one which explains what happens with CO2 in the atmosphere in all observations…
BTW: the Bern model is also wrong, because it assumes a saturation of the deep oceans (and vegetation), while these are far from saturated…
Dear Ferdinand,
Thank you for your kind critique.
Regarding your (1) and (2), I agree. In simple numbers, using my theory, the natural CO2 inflow in 1960 was about 310 ppm / 4 years = 75 ppm per year. In 2016, the natural CO2 inflow was about 400 ppm / 4 years = 100 ppm per year.
Regarding (3), The evidence is the 14C data which show outflow = level / e-time and show e-time has been constant from at least 1970 and likely before 1970. If these two things are true, then my theory is true.
For a constant e-time, I choose 4 years only because that is the IPCC number. E-time for 12CO2 only needs to be less than the e-time measured for the 14C data, which is about 16.5 years. My theory is independent of e-time because the ratio of human to natural balance levels cancel e-time. See my equations (11) and (12).
So, your argument about estimates of residence time do not rebut my theory. My theory would work even if e-time had increased. My theory does not conclude that e-time is constant. Only the 14C data prove that e-time has been constant.
Regarding (4), my section 6.1 explains my argument about why there is only one e-time. Your argument has not rebutted my section 6.1. Rather your argument has only repeated the theory that I have shown is wrong.
Regarding (5), my section 5.6 calculates the expected decrease in the 13C/12C ratio according to the Physics Model and the Bern model. Please tell me how you got the numbers 9% and 4.4% for me to respond to your (5).
However, regarding your explanation in (5), the IPCC theory assumes inflows set balance levels. Otherwise, the IPCC has no basis to argue that continuing constant natural CO2 inflow could produce its claimed constant CO2 level of 280 ppm.
Also, the replication of the 14C data by the Physics Model affirms that outflow = level / e-time. That affirmation is all that is required to conclude that inflow sets the balance level.
Your argument that temperature sets the balance level ignores the steps required to support your argument. Temperature does not directly affect the level of CO2 in the atmosphere. Temperature affects inflow and outflow, which in turn affect the level.
Presumably, the drop in atmospheric CO2 levels in the 2008-2009 period was largely due to reduced human emissions as global economic activity temporarily declined. Is this consistent with the Physics Model? The Berne Model?
There was a sharp reduction in fossil fuel emissions in 2008 and 2009 but no visible change in the atmospheric growth rate. This is consistent with the physics rule and Dr. Berry’s paper.
Kevin
this relationship is explored quite well beginning at 37:40 in the Salby video at https://edberry.com/blog/climate-physics/agw-hypothesis/what-is-really-behind-the-increase-in-atmospheric-co2/
Kevin,
It is consistent with the physics model for an e-fold time of about 51 years:
http://www.ferdinand-engelbeen.be/klimaat/klim_img/dco2_em2B.jpg
Where the purple line is the calculated increase of CO2 from the difference between human emissions and the calculated net sink rate as based on the extra CO2 pressure in the atmosphere above the current equilibrium (about 290 ppmv for the current average seawater surface temperature).
That there is not much reaction on small changes in human input is explainable, as the sinks react on the total extra CO2 in the atmosphere, not the emissions of one or a few years. See the last years in the graph: human emissions are for years quite constant, but the net increase gets lower, as the total CO2 in the atmosphere above equilibrium still increases, thus the net sink rate still increases…
Has the dramatic increase in human populations and therefore respiratory CO2 been included in the calculations?
The Jane Fondas, the Al Gores of our land will always promote lies to get what they want. So they adopt their outcome then come up with their “evidence”. They care nothing about another Ice Age or Global Warming Or Climate Change. It’s all about $the Love of Money $$. Where do we think that “carbon Footprint” money will go?
This entire CO2 climate change is another Hoax like Russian Collusion. The communist big lie tactic ” Tell a big enough lie and keep telling it until the masses accept it as fact”.
If anyone tells the truth their Big Lie is exposed and they cannot allow that.
Of course there is no Man Made CO2 pollution causing an ice age/global warming/climate change so why do we play their game? We must put them in front of a firing squad for trying to overthrow the government of the USA.
Dr. Berry–a few months ago I reprinted “Falsification Of The Atmospheric CO2 Greenhouse Effects Within The Frame Of Physics” from your site and now I am curious if any credible source has found technical flaws with the conclusions of the authors. If their paper has withstood the test of time, then any discussions of CO2 sources and content of the atmosphere is merely a discussion about who is the taller dwarf since CO2 levels above ~300 PPM have no known way to cause the warming of the atmosphere as promulgated by the UN conjecture. Are you aware of any conflicting articles?
Dear David, You refer to the publication by GERHARD GERLICH and RALF D. TSCHEUSCHNER found here: https://www.worldscientific.com/toc/ijmpb/23/03
I do not know of any publications that show any physics errors in their paper.
LOL. Click on the link. Click on the title of the paper. Scroll down to “We recommend”. Click on ” COMMENT ON “FALSIFICATION OF THE ATMOSPHERIC CO2 GREENHOUSE EFFECTS WITHIN THE FRAME OF PHYSICS” JOSHUA B. HALPERN et al., International Journal of Modern Physics B, 2012″
Even easier, google scholar is a really useful tool for this sort of basic scholarship as it gives you a list of papers that have cited a paper in which you are interested.
It is interesting to read through the comments presented in reply to Edwin X Berry’s paper, “Human CO2 Emissions Have Little Effect on Atmospheric CO2”. There is no need for any in depth studies regarding this issue when considered by the way I have done so for some time now. I have viewed this anthropogenic climate change hoax being perpetrated on us by, what I consider to be a few very dishonest and deceitful individuals, who seem to be aided by a large number of what can truthfully be called useful idiots who help them expand their hoax.
I am a realistic skeptic and therefore I know that what the alarmist ignore is these truths. The sun makes up 99.86% of the mass of the solar system. Do you agree with that summation? Carbon dioxide is .03% of the earth’s atmosphere. Do you agree with that summation? Of the two, the sun or CO₂, which do you believe has the most influence on the Earth’s climate? The people associated with the essential for the survival of modern civilization, the fossil fuel industries, also know the correct answer and will continue to supply the resources that are in demand while ignorant goons who share your views supply nothing of value to anyone, not even yourselves.
I had submitted this view of mine above to Eric Grimsrud on his web site after reading another of his post blaming all of the Earth’s ills on the trace gas, CO₂. He immediately kept it from seeing the light of day, which he does any comment that runs counter to his apocalyptic view of what CO₂ is going to do to the planet unless immediate measures are taken to NOT emit any more of what he sees to be a devil in the sky. BTW, I requested no proof of the warming effect of the GHGs because I only submitted what is showed above and an answer should not have been a hard thing for such an illustrious climatologist as what Eric Grimsrud imagines himself to be
Eric Grimsrud Tue, May 28, 1:43 AM
to me
John, FYI, I trashed your recent comment requesting proof of the warming effect of the GHGs . Just at I don’t do experiments proving that gravity exists or that the Sun is emitting energy, I don’t do experiments showing that the GHGS warm the atm by absorbing IR radiation. These experiments were done long ago to the satisfaction of all scientists except a very few. I don’t use may web site for the education of those few. I like everyone else, they should read the now ancient and accepted literature of science. Eric
http://coolcosmos.ipac.caltech.edu/ask/64-What-is-the-atmosphere-of-Earth-made-of-
http://coolcosmos.ipac.caltech.edu/ask/5-How-large-is-the-Sun-compared-to-Earth-
Hi Ed,
As far as I can see it, the UN-IPCC only sees humans in a negative light, that for them humans are a degradation to what they (the UN-IPCC ) would wish in their version of a natural order.
However that aside the part of the whole paradigm I don’t get — why is life left out of the model, maybe it’s because life is so difficult to accurately quantify because it IS A VARIABLE not a constant. Let me explain …
What they continually miss is the ever increasing amount of CO2 that humans (by shear wight of population growth) take out of the natural system.
Since 1800 when the population was 1 billion to the current population of around 8 billion the population has doubled 3 times. To keep up with that growth we have our farming and agriculture, and a lot of ignorance of Malthus 🙂 . And all through that period humans have been eating food, food which at its base level comes from CO2+H2O and solar energy. Solar energy to bind CO2+H2O (from solar energy to chemical energy) into new compounds of sugars, starches, proteins, cellulose type structural material, etc, etc. From those low energy basics to synthesis of higher energy foodstuffs.
Surely for our population to have grown as much as it has we have increasingly been sequestering away both CO2 and solar energy.
It is the part of the whole paradigm I don’t get — why is life left out of the model, maybe it’s because life is so difficult to accurately quantify because it IS A VARIABLE not a constant.
As DR. ED stated to DAVE BURTON; “You are unaware that the real predatory journals that deal with climate science are those that reject good papers only on the basis that the paper’s conclusion disagrees with the UN IPCC.”
The IPCC’s mandate provides the reason WHY the UN’s IPCC is so selective regarding what information that they are willing to publicize.
1. Scope and Approach of the Assessment 1.1. Mandate of the Assessment
The Intergovernmental Panel on Climate Change (IPCC) was established by World Meteorological Organization and United Nations Environmental Programme (UNEP) in 1988 to assess scientific, technical, and socioeconomic information that is relevant in understanding human-induced climate change, its potential impacts, and options for mitigation and adaptation. The IPCC currently is organized into three Working Groups: Working Group I (WGI) addresses observed and projected changes in climate; Working Group II (WGII) addresses vulnerability, impacts, and adaptation related to climate change; and Working Group III (WGIII) addresses options for mitigation of climate change.
http://www.ipcc.ch/ipccreports/tar/wg2/index.php?idp=22
Question: How can we be assured that any climate change is human induced? Be reminded that there has never been a repeatable, empirical experiment conducted that shows that the amount of CO₂ present in the earth’s atmosphere today, .04% or 415 ppm, can possibly control the Earth’s climate. Logic and also the current state of the earth’s climate today, plus the facts from history, tells me that it is the sun and it’s various cycles that controls the climate. After all, the sun makes up 99.86% of the mass of the total solar system.
A happy 4th to all and congratulations to Dr Ed for the publishing of his paper today. I perceive an appropriate independence day message in this fortuitous coincidence.
Unfortunately, Ed, you are apparently unaware of “Beall’s List.” It is a quite famous list of known “predatory journal” publishers, which mimic legitimate academic journals, but publish for pay, without proper peer-review. They’re called “predatory” because they prey upon authors, who have to pay substantial amounts of money to get their work published in those journals.
“Science Publishing Group,” is a known predatory publisher, and its International Journal of Atmospheric and Oceanic Sciences is not a respectable academic journal.
https://hyp.is/YxJhXJ7yEemPM_cKQJ88ZQ/beallslist.weebly.com/
In short, you’ve been robbed.
Unfortunately, Dave, you are unaware of the criticisms of Beall’s list and the fact that Beall shut down his website two years ago because he could not defend his criticisms of open access journals.
You are unaware that most journals not on his list now offer optional open access publishing. Open access has become the new norm because few people wish to pay to read a scientific publication.
You are unaware that Beall’s belief that good journals should not charge authors a publication fee is ridiculous. Every journal does and has always charged a publication fee.
You are unaware that the real predatory journals that deal with climate science are those that reject good papers only on the basis that the paper’s conclusion disagrees with the UN IPCC. The journals of the American Meteorological Society, for example, fall into this category. Personally, I think it is predatory that an AMS journal charges many thousands of dollars for a publication. I know because I submitted my paper to the AMS Journal of Climate, even though it cost some 5 times as much as other journals. But, that is history because the AMS editor supported the present AMS policy to not publish any papers that disagree with the UN IPCC. That is unscientific and predatory at the same time.
You are unaware that my paper has received sufficient peer reviews that have rated it excellent and recommended its publication.
You are unaware that the scientific way to review a publication is by reviewing the publication’s content and not by making an unfounded claim that the journal is bad because of the opinion of an irrelevant librarian who has no expertise in evaluating science.
You are unaware that before you brought your claim that the journal that has published my paper and Harde’s paper is on “Beall’s list,” you attempted and failed to show that the science in my paper is incorrect in any way. So, your claim is unscientific and shows the lengths you will go to attempt to undermine a paper that disagrees with your incorrect view of atmospheric science.
Here is some information from the Internet that should be evaluated before one uses the “Beall’s list” claim:
Jeffrey Beall is an American librarian, best known for drawing attention to “predatory open access publishing”, a term he coined,[1] and for creating what is now widely known as Beall’s list, a list of potentially predatory open-access publishers. He is a critic of the open access publishing movement.
Beall has a bachelor’s degree in Spanish from California State University, Northridge (1982), as well as an MA in English from Oklahoma State University (1987) and an MSc in library science from the University of North Carolina (1990).
https://en.wikipedia.org/wiki/Jeffrey_Beall
Beall’s List was a prominent list of predatory open-access publishers that was maintained by University of Colorado librarian Jeffrey Beall on his blog Scholarly Open Access. The list aimed to document open-access publishers who did not perform real peer review, effectively publishing any article as long as the authors pay the open access fee. Originally started as a personal endeavor in 2008, Beall’s List became a widely followed piece of work by the mid-2010s. Its influence led some publishers on the list to threaten defamation lawsuits against Beall, as well as to lodge official complaints against Beall’s work to the University of Colorado. As a result, Beall deactivated his blog and the list in January 2017.
https://en.wikipedia.org/wiki/Beall%27s_List
Beall published an article arguing against the whole of open access publishing and not just predatory open access, claiming it to be an “anti-corporatist” [sic], “collectivist”, “cooperative” movement which wishes to “replace a free market with an artificial and highly regulated one”. He also plays up the connections to George Soros, describing him as “known for his extreme left-wing views and the financing of their enactment as laws”.[7] Oh, and he published this nonsense in an open access journal!
https://rationalwiki.org/wiki/Beall%27s_List
Ed wrote, “Beall’s belief that good journals should not charge authors a publication fee is ridiculous. Every journal does and has always charged a publication fee.”
I wasn’t charged a penny for my one little paper, in Natural Hazards, a Springer journal.
DOI:10.1007/s11069-012-0159-8
Dear Dave, Your “one little paper” was not a paper. It was a 77-word comment on a published paper. Of course, the journal did not charge you for your comment. But you can be sure the journal billed the authors or their institutions for the cost of publishing their paper.
You tried to make the point that good journals do not charge for publishing papers. Your attempt failed. How do you think journals can pay their electricity bill if they do not receive an income for publishing papers?
Ed wrote, “Your “one little paper” was not a paper. It was a 77-word comment …”
MS Word counts 1213 words and one graph, including a link to the supplemental material, which includes another 16 graphs, a spreadsheet, source code, and data files.
It was a comment, but very useful on sea levels, so thanks!
Can’t play the ball so play the man. Can’t play the man, so play the journal.
That a matter of science should be deferred to the authority of a Spanish and English major says all one needs to know.
Philip, the average residence time of CO2 added to the atmosphere is about fifty years. For the details of how that figure is derived, see:
https://wattsupwiththat.com/2019/06/21/lumpy-science-from-ken-caldeira/#comment-2734776
(If that link doesn’t take you directly to my comment, scroll to the bottom of the page: it’s the very last comment.)
It is trivially true that changes to the average atmospheric CO2 level must be equal to the difference between the processes which add to that level and the processes which subtract from it.
1 ppmv CO2 (molecular wt 44.01) has mass 8.053 Gt, of which 12/44-ths or 2.196 Gt is carbon. (Note: I have a hard time remembering such numbers, so I have a crib sheet of conversion factors on my web site.) We have good economic data for the global production & use of fossil fuels, so we can trivially calculate anthropogenic emissions from those sources.
It is generally acknowledged that fossil fuels are the main source of anthropogenic CO2 emissions. So even if estimates of the other sources (concrete, land use changes, etc.) are badly botched, we still will be “in the ballpark” for our anthropogenic emissions estimates. Those emissions are currently estimated to be a little over 10 Gt carbon per year, equivalent to almost 5 ppmv CO2 per year.
The various processes which remove CO2 from the air (mainly terrestrial greening, and dissolution in seawater) have rates which are governed by many factors, but those factors are dominated by just one: the average atmospheric CO2 level.
Note that simple physics & chemistry cannot possibly govern the removal rate, because the most important factors are probably biological.
Note also that those processes cannot be significantly affected by the emission rate of “fossil” (anthropogenic) CO2. There simply is no plausible physical mechanism for such a coupling. It is the CO2 level, not the CO2 emission rate, which primary governs the CO2 removal rate.
Now, as it happens, the CO2 removal rate has generally been fairly close to half the anthropogenic CO2 emission rate, for many years, with the result that CO2 levels have increased only about half as fast as would have happened w/o the negative feedbacks that remove CO2 at an accelerating rate (which apparently came as a big surprise for Hansen et al (1988), and is one of the main reasons their predictions 30 years ago were so far off).
As CO2 emission rates have increased, CO2 levels have also unsurprisingly increased, and as CO2 levels have risen, CO2 removal rates have also unsurprisingly risen. The one really surprising thing about it is the certainly coincidental fact that CO2 removal rates have been consistently near half the anthropogenic CO2 emission rates.
Back in 1988, Hansen & his seven illustrious co-authors equated emissions with level increases, which means they assumed that rising CO2 levels would not cause an acceleration in the processes that remove CO2. But now a remarkable number of supposed authorities on climate change make the opposite mistake: they suffer from the delusion that CO2 removal rates are governed by the emission rates, and that it is some sort of law that “half of the CO2 we emit stays in the atmosphere.” That leads to foolish claims that anthropogenic CO2 emissions must be lowered to zero to stop the rise in CO2 levels, and to the idiotic notion of a “carbon budget.” (Actually, if anthropogenic CO2 emission rates were merely halved, CO2 levels would completely cease rising, at least for quite a while.)
The belief that the ongoing increase in atmospheric CO2 levels is due to rising temperatures, rather than to mankind’s CO2 emissions, is wrong. Ice core records tell us that we get only 90 ±10 ppmv CO2 level change from a full change between glacial maximum and interglacial, and that’s a temperature change at least 7 times as large as we’ve seen in the last sixty years, and even that 90 ppmv change is only seen after a slow equilibration process that takes at least five hundred years. So the warming over the last sixty years could account for at most about 2 ppmv atmospheric CO2 level increase — and we’ve measured a 95 ppmv increase.
https://sealevel.info/GISS_vs_UAH_and_HadCRUT_1958-2018_woodfortrees_annot2.png
I found it interesting when I looked at the graph from Wood For Trees that you wanted folks to view. It states that the CO₂ levels have gone from 315 to 410 ppm in the 60 years that they are presenting temperature data for from GISS and HadCRUD. There is a large discrepancy of .5⁰C in what the two institutions report. Why is that?
The main glaring thing that jumps out from when one views the graphs is that both show declines in the recorded temperatures from about 2014 on to the end of the reporting period. Why is that when the CO₂ levels have gone up and the theme that the IPCC and the alarmist want people to believe is that an increase in CO₂ levels will cause the Earth’s temperatures to rise? The graphs do not show that to be true, do they, because both show a downward trend in the temperatures. It is obvious to me that there is much more to the earth’s climate changes, as it always has done, and that it is the sun that is the cause of such changes and not a trace gas, CO₂.
I am a realistic skeptic and therefore I know that what the alarmist ignore is these truths. The sun makes up 99.86% of the mass of the solar system. Do you agree with that summation? Carbon dioxide is .03% of the earth’s atmosphere. Do you agree with that summation? Of the two, the sun or CO₂, which do you believe has the most influence on the Earth’s climate?
Dear Dave,
Your comment contains too much unnecessary material and maybe that is why you come to the wrong conclusion.
Your “trivially” is an imprecise description of my continuity equation (1). Your ppm’s and Ts’s repeat the IPCC data that I use. You agree that CO2 level drives the outflow but you do not realize the full formula for Outflow is my equation (2) and you do not realize that (2) is correctly a hypothesis according to the scientific method. And although you do not state it as precisely as I do, you acknowledge that Outflow is independent of Inflow.
You realize the rate of increase of atmospheric CO2 is not strongly based on human CO2 emissions.
But then you start to get the physics wrong. You talk of “removal rates” without defining the term. You should connect removal rates with equation (2), but you do not.
You claim that rising temperatures cannot cause the increase in natural CO2 inflow, but you base your conclusion on ice core data, which is a poor case. You completely ignore my references [10-25] which is an unscientific way to build your case.
Worse, you ignore the simple physics that derives from (1) and (2), which is in my Section 3.4 and equations (9) to (12). In other words, you acceptance of (1) and (2) requires you agree with (11) and (12) which say the ratio of human to natural CO2 in the atmosphere equals the ratio of their inflows, and you agree with the ratio of the inflows.
This ratio requires you to accept the fact the natural emissions cause 95 percent of the CO2 in the atmosphere and human CO2 causes only 5 percent, in round numbers.
I won’t comment on the claims you made on WUWT because you did not make those claims here. Suffice it to say that your argument that the residence time is 50 years or more is junk science and nothing you wrote on WUWT shows anything in my post is incorrect.
” the average residence time of CO2 added to the atmosphere is about fifty years.
….simple physics & chemistry cannot possibly govern the removal rate, because the most important factors are probably biological.”
Sorry, but no. Why these statements are incorrect can be understood from the physical analysis in Dr. Berry’s paper and references therein. Importantly, the removal time of CO2 can’t be longer than about a decade. What’s responsible for the removal of CO2 is immaterial – because the removal time is an empirical fact. It’s established by the post-nuclear decline of carbon 14, a tracer of CO2. If carbon 14 is removed in about a decade, so is CO2.
Indeed, Dr. Harde’s recent paper (https://notrickszone.com/2019/07/03/new-study-in-journal-of-earth-sciences-human-activities-not-responsible-for-observed-co2-increase/ ), also Dr. Salby’s lecture referenced above by DMA, show that the removal time is probably well shorter than a decade. All of these analyses demonstrate that the human component of increased CO2 is therefore small. The observed increase is caused almost entirely by nature.
Dear Edwin Berry. Valentina Zharkova predicts that it will be as warm in the current Modern Warm Period as in the Minoan Warm Period (1300 BC). Is it reasonable to assume that the atmospheric CO2 content is determined by Henry’s Law and the temperature of the oceans and can you estimate the concentration we will then reach?
This link is most likely known to you, but just in case: The Half Life of CO2 in Earth’s Atmosphere http://euanmearns.com/the-half-life-of-co2-in-earths-atmosphere-part-1/
Many thanks for your publication.
At La Jolla, CO2 concentration in 1992: 357.16 ppm
in 2007: 384.79 ppm
in 1992, ∆14C, ‰: 132.3
in 2007: 42.3
By this reckoning, *all* of the CO2 that was added to the atmosphere was *completely* depleted of 14C. *All* of it was fossil-fuel carbon.
Something isn’t adding up.
There just isn’t some enormous reservoir of natural 14C-depleted CO2 that’s going into the atmosphere.
Dear Eric,
The data you provide are the 14CO2 balance levels. In 2007 it was 42.3.
My section 5.6 shows how to calculate the expected balance level for the physics model and the IPCC model. Neither model can account for all the inflow of 14C into the atmosphere, so some error is expected.
The physics model predicts the balance level of -45. The IPCC model predicts the balance level of -320. Neither are correct but the physics model is much closer to your 42.3 than the IPCC model.
It is not a matter of “some enormous reservoir” but a matter of the inflow of 14C. Natural inflow dominates human inflow by 21 to 1. So, the one part of 14C deficient inflow is overwhelmed by 21 parts of natural inflow. Therefore, we expect the balance level of D14C to be close to zero, which is the pre-bomb observed level of D14C.
Note also that the bomb-added 14C was still declining in 1992. So, the decline to 2007 was not totally a product of human emissions. It was a product of the level of 14C being above its normal balance level.
Dear Ed,
My compliments for your excellent website on this subject. I think that the physical model that Hermann Harde and you describe for the change in CO₂-concentration makes much more sense than what the IPCC is showing us. My name is Frans Schrijver and I recently started a website on climate change in the Netherlands (https://www.klimaatfeiten.nl) which is focused on highschool students. I want to add an article on the causes of the change in CO₂-concentration, so I am interested in all your arguments.
But I have a question on one of your figures, where I think you make a mistake. In Figure 1 in the Introduction you say that the IPCC claims human CO₂ adds all atmospheric CO₂ above 280 ppm, which results in a different composition of human CO₂ in the atmosphere. I don’t think that climate alarmists disagree with you about the composition in the air, I think they agree with you that if you could earmark the molecules only 5% of them would be human CO₂. But they still would argue that the concentration has increased due to anthropogenic CO₂.
Let me illustrate it with a bin of balls. If you add every minute 20 green balls + 1 red ball and at the same time you drop 21 random balls, then at the end of the day you end up with a bin with about 5% red balls. But climate alarmists will argue that you don’t drop 21 balls every minute, but only random 20 balls. So, at the end of their day they will also have about 5% red balls, but much more than in the first situation. They simply say that the ocean buffer can only handle 210 GtC per year and the every perturbation leads to much longer e-times. I don’t agree with them, but if you do have that point of view the right column of Figure 1 is wrong.
I hope you can clarify this to me.
Frans
I do not want to try to give you Dr. Ed’s answer to your question but I have had the same argument posed to me and will share part of my analysis. First the ball example is flawed because it is do precise and all inputs and extractions are counted. My idea of a better analogy to atmospheric CO2 flux is a river drainage with many creeks joining a main river and canals and ditches removing all along the drainage. Now we add a single monitoring station on one small creek and another to the main river at the end of the drainage area. If the small creek increases more than the main river no one would guess that all the river increase is from the small stream. We just don’t know the natural part of the CO2 flux any better than we know the contribution of all the unmonitored streams. The assumption that atmospheric CO2
has been in equilibrium before the industrial revolution is very weekly supported and broadly contested.
Dear Frans,
I intended Figure 1 to illustrate how the claim of 32% by IPCC and climate alarmists differs from a more rational claim that the atmosphere composition will reflect the relative inflows into the atmosphere, which is about 5% from human sources.
My preprint best answers your question. It shows the complete effect of human emissions on the carbon cycle. The proper way to model the human effect is to model it independently from the natural carbon cycle. That way, we don’t have to count colored balls.
My preprint accounts for how fast human carbon flows from the atmosphere to land and ocearns. Using IPCC data, my preprint shows human carbon emissions have increased atmospheric CO2 by 31 ppm as of the end of 2019. This is higher than the 5 percent because human carbon flow into the land and oceans lags behind the human carbon that flows into the atmosphere. If human carbon emissions were terminated in 2020, then the human carbon in the atmosphere would rapidly decrease to its equilibrium value which would be about 8 ppm.
Thank you very much Ed for this reply! It helps to get a better understanding. I still have to read your new paper, but I see that your calculation of the human contribution adds up a little higher than what Hermann Harde shows. He estimates this contribution at 17 ppm (Harde 2019, Figure 8). But I will have a closer look at your preprint. For me the biggest challenge is to present all this information in a way that it can be understood by high-school students, journalists and politicians.
Dear Frans,
Harde calculates the human contribution is 17 ppm. I get 18 ppm. This small difference is likely due to my use of an additional year or so of emission data. Fundamentally, Harde and I get the same answer.
But this answer, 17 or 18 ppm, does not include a calculation of the full carbon cycle. That is in my Preprint. My preprint gets 31 ppm as of the end of 2019. The reason the carbon-cycle calculation gives a higher result is because the calculations account for the rate that human carbon flows from the atmosphere to land and oceans versus the rate that human carbon enters the atmosphere.
I have the same interest as you do regarding how to present this information so high-school students can understand it.
Dear Frans,
Please see my Preprint #3. It expands upon this post that I published July 4, 2019, almost a year ago. My arguments in Preprint #3 are much better than my arguments in this post.
Dr. Berry was your paper peer reviewed and by whom. Thanks for your excellent work!
Dear George, the Journal chose the reviewers but does not make reviewers’ names public.
Dr. Berry, thank you so much for your reply. I know you are a busy man. I tout your model on climate sites. You should see the stupid replies I get saying your model has been debunked and that you are no climate scientist. I challenge them to come here and debate you but they won’t. As far as I can see, you have taken on every commenter who has challenged your model and have done an effective job of refuting what they claim. Again, great work and may God bless you and your family!
Dear George, If I am not a climate scientist then no one is a climate scientist.
Since climate alarmists cannot defend their climate religion, the only recourse they have is to attack the messengers who challenge their scientific arguments.
Mostly, they are eco-freaks who may have taken environmental or ecology courses that do not teach them climate physics.
By the way, check out my Preprint #3. It uses IPCC data to prove the IPCC is wrong. It puts the climate alarmists in checkmate.
Yes George, I share your same sentiments. I am not a scientist but find the comments section most interesting and learn much from Eds responses, thanks Ed for bringing sanity to this madness.
Dr. Berry. Comments please: https://www.youtube.com/watch?v=CcmCBetoR18
Dear Richard, I clicked on you link and watched the video. Potholer54 does not reveal his name but says he is a “former science journalist with a degree in geology.” A BS degree in geology is useless in this field. But with 205K subscribers, maybe he is responsible the much of the global warming nonsense.
Nothing he concludes in his video is true. He uses DOE as a scientific reference. No government website these days is a valid source of climate change science. Government websites reflect the political views of the bureaucrats who work for the government and cannot be fired.
Potholer54 uses outdated arguments of the climate alarmists. His facts are wrong and his logic is pathetic.
Please check the Introduction to my Preprint #3 that I have just posted.
Potholer is a shill for the political climate change mantra, he conveniently pieces together one side of the argument and completely dismisses the other, all the while pretending to be very sophisticated about it. Astrophysicist Joseph Postma has offered to debate him many times Potholer did not respond. Tony Heller also has open invitation to debate him live and the “tv personality” seems camera shy.
In fact Potholer hides behind “selective peer review” to support the politically accepted view on climate change.
His real name is Peter Hadfield…
https://en.wikipedia.org/wiki/Peter_Hadfield_(journalist)
From: Allan MacRae
Sent: July-04-20 6:14 AM
To: Sallie Baliunas; Tim Patterson
Cc: Willie Soon
Subject: Congratulations and Happy 4th of July2020!
In 2002 Dr Sallie Baliunas, Astrophysicist, Harvard-Smithsonian, Dr Tim Patterson, Paleoclimatologist, Carleton U and Allan MacRae TOLD YOU SO 18 YEARS AGO:
http://www.friendsofscience.org/assets/documents/KyotoAPEGA2002REV1.pdf
1. “Climate science does not support the theory of catastrophic human-made global warming – the alleged warming crisis does not exist.”
See Michael Shellenberger’s 2020 confession “On Behalf Of Environmentalists, I Apologize For The Climate Scare”. https://quillette.com/2020/06/30/on-behalf-of-environmentalists-i-apologize-for-the-climate-scare/
2. “The ultimate agenda of pro-Kyoto advocates is to eliminate fossil fuels, but this would result in a catastrophic shortfall in global energy supply – the wasteful, inefficient energy solutions proposed by Kyoto advocates simply cannot replace fossil fuels.”
See Michael Moore’s 2020 film “Planet of the Humans”. https://www.youtube.com/watch?v=Zk11vI-7czE
Regarding Michael Shellenberger’s 2020 condemnation of the false climate scare and Michael Moore’s 2020 film slagging green energy schemes based on intermittency and diffusivity, I say “better late than never”. The irony is that “the Michaels”, who were wrong for decades, have more credibility with their recent conversions than those of us who were never deceived by the leftists’ climate-and-energy scams.
The Michaels are now under attack by their former green comrades, who want to preserve their false climate and green-energy scams that have so effectively deceived the pubic and our politicians and squandered trillions of dollars. The Michaels both deserve kudos for having the courage to tell the truth, especially considering how radically they have changed direction from their former positions. They both deserve our scientific and moral support.
The leftists have already started their counterattack – censoring Shellenberger’s article in Forbes magazine and attempting to block Moore’s film on YouTube. The left continues to lie.
Allan
Thank you for your long service to truth and this post sharing your debate from 2002. I will enjoy rereading it this week.
Dr Berry,
I was curious as I watched this video on YT where they sited your work it was an excellent presentation, a little hard on the sound which was unfortunate.
https://www.youtube.com/watch?time_continue=784&v=Xgx1O3lHSGI&feature=emb_logo
I noticed a key point of 0.06 degrees increase if all IR according to the IPCC was reabsorbed to the surface. I wasn’t sure if the .341 W/m^2 was your calculation or the IPCC.
So the question is, do you understand that all energy distribution does not equate an increase in temperature even if radiation was being re-absorbed back to the surface? This is a climate change trick
not supported by the standard Laws of Thermodynamics, but more importantly the Bose-Einstein Statistic, where it is obvious unlike fermions, low level bosons can stack without an increase in temperature, for bosons, in this case photons, are frequency/wavelength dependent.
Any line spectrum (a quantized discrete package) only carries transferable energy according to its frequency/wavelength.
Photon Energy=Delta E =hf
E=Energy of the photon
h=Plank’s constant (6.63×10^(-)34 J*s)
f=frequency (^14 Hz)=6.63×10(-)20 J
That energy must be greater than the radiative emissions of the frequency/wavelength of the object receiving it to increase the temperature.
And always thank you for your informed and mature replies I wish other scientists would practice a more civil rapport.