
Human CO2 has little effect on atmospheric CO2
Please see the published version of this paper here.
Edwin X Berry, Ph.D., CCM
Climate Physics LLC, Bigfork, Montana, USA
“The formulation of a problem is often more essential than its solution, which may be merely a matter of mathematical or experimental skill. To raise new questions, new possibilities, to regard old problems from a new angle requires creative imagination and marks real advances in science.” – Albert Einstein
Abstract
Aims: Test the United Nations Intergovernmental Panel on Climate Change (IPCC) theory that human CO2 has caused all or most of the rise in atmospheric CO2 since 1750 or above 280 ppm.
Place and Duration: edberry.com, Bigfork, Montana, USA. First post on this subject was on December 19, 2016. It gathered 244 comments.
Methodology: Derive a simple Physics Model that makes only one assumption: outflow is proportional to the level (or concentration) of CO2 in the atmosphere. Compare and evaluate the Physics Model and the IPCC model.
Results: The Physics Model replicates the decay of 14CO2 after 1970 using a constant e-time of 16.5 years. This replication has significant theoretical consequences. By contrast the IPCC model cannot replicate the data and contains internal inconsistencies that violate physics.
Conclusions: The 14C data validate the Physics Model and reject the IPCC model. Inflows of human and natural CO2 into the atmosphere set balance levels proportional to their inflows. Each balance level remains constant if its inflow remains constant. Continued, constant CO2 emissions do not add more CO2 to the atmosphere. Neither human nor natural CO2 accumulate in the atmosphere. The balance level of present human CO2 is about 18 ppm. The balance level of natural CO2 is about 392 ppm. Human CO2 does not increase atmospheric CO2 enough to cause climate change and restricting CO2 emissions will not stop climate change.
Keywords: carbon dioxide, CO2, climate change, anthropogenic, accumulation
1. Introduction
The United Nations Intergovernmental Panel on Climate Change (IPCC) [1] Executive Summary claims human emissions caused atmospheric CO2 to increase from 280 ppm in 1750, to 410 ppm in 2018, for a total increase of 130 ppm.
IPCC claims “abundant published literature” shows, with “considerable certainty,” that nature has been a “net carbon sink” since 1750, so nature could not have caused the observed rise in atmospheric carbon dioxide.
The U.S. Global Change Research Program Climate Science Special Report (USGCRP) [2] claims,
This assessment concludes, based on extensive evidence, that it is extremely likely that human activities, especially emissions of greenhouse gases, are the dominant cause of the observed warming since the mid-20th century.
IPCC and USGCRP claim there are “no convincing alternative explanations” other than their theory to explain the “observational evidence.”
This paper shows these IPCC and USGCRP claims are incorrect and presents a “convincing alternative explanation” that IPCC and USGCRP claim does not exist. Specifically, this paper shows:
- Why human CO2 has little effect on atmospheric CO2.
- Why carbon isotope data support this conclusion.
- Why human CO2 is less than 5% of today’s atmospheric CO2.
- Why natural CO2 is more than 95% of today’s atmospheric CO2.
- Why nature, not human CO2, causes the climate to change.
IPCC [3] bases all its climate conclusions on this flawed 3-step argument:
How do we know that in
fact human activity has been responsible for the well documented 25% increase in atmospheric CO2 since the early 19th century?
First, the observational CO2 records from ice cores … show that the maximum range of natural variability about the mean of 280 ppm during the past 1000 years was small.
Segalstad [4] and Jaworowski [5] present evidence that the CO2 level before 1750 was much higher than 280 ppm. Nevertheless, this paper accepts IPCC’s assumption that the CO2 level was 280 ppm in 1750. However, this paper rejects the implication that the ice-core mean of 280 ppm implies nature’s CO2 emissions did not change after 1750.
IPCC continues:
Second, the observed rate of CO2 increase closely parallels the accumulated emission trends from fossil fuel combustion and from land use changes.
Proper statistics show correlation does not mean causation and time-series correlations must be detrended. Munshi [7] shows the detrended correlation of annual human emissions with
IPCC continues:
Third, the observed isotropic trends of 13C and 14C agree qualitatively with those expected due to the CO2 emissions from fossil fuels and the biosphere, and they are quantitatively consistent with results from carbon cycle modeling.
This paper shows the isotropic trends of 14C and 13C support the Physics Model and reject the IPCC model.
For simplicity, this paper uses levels in units of ppm (parts per million by volume in dry air) and flows in units of ppm per year. GtC (Gigatons of Carbon) units are converted into CO2 units in ppm using:
1 ppm = 2.12 GtC
Authors who conclude human CO2 adds only a minor increase in atmospheric CO2 include Revelle and Suess [7], Starr [8], Segalstad [9], [10], Rorsch, Courtney, and Thoenes [11], Courtney [12], Quirk [13], Essenhigh [14], Glassman [15], Humlum [16], Salby [17], Harde [18], and Berry [19], [20].
Authors who support the IPCC conclusion include Archer et al. [21], Cawley [22], Joos et al. [23], Kern and Leuenberger [24], and Kohler [25].
2. The Physics Model
2.1 Physics Model derivation
A system describes a subset of nature. A system includes levels and flows between levels. Levels set flows and flows set new levels [31].
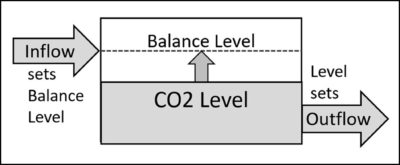
Figure 1 illustrates the system for atmospheric CO2. The system includes the level (concentration) of CO2 in the atmosphere and the inflow and outflow of CO2.
Figure 1. The system for atmospheric CO2 includes the level (concentration) of CO2 and the inflow and outflow of CO2. It applies to all definitions of CO2.
The derivation begins with the continuity equation (1) which says the rate of change of the level is the difference between inflow and outflow:
dL/dt = Inflow – Outflow (1)
Where
- L = CO2 level (concentration in ppm)
- t = time (years)
- dL/dt = rate of change of L (ppm/year)
- Inflow = rate CO2 moves into the system (ppm/year)
- Outflow = rate CO2 moves out of the system (ppm/year)
The Physics Model has only one hypothesis, that outflow is proportional to level:
Outflow = L/Te (2)
where Te is the “e-folding time” or simply “e-time.”
Substitute (2) into (1) to get,
dL/dt = Inflow – L/Te (3)
Define the balance level, Lb, as
Lb = Inflow * Te (4)
Equation (4) shows how Inflow and Te set the balance level. Substitute (4) for Inflow into (3) to get,
dL/dt = – (L – Lb)/Te (5)
Equation (5) shows the level always moves toward its balance level. At this point, both L and Lb are functions of time. Te can also be a function of time.
In the special case when Lb and Te are constant, there is an analytic solution to (5). Rearrange (5) to get
dL/(L – Lb) = – dt/Te (6)
Then integrate (6) from Lo to L on the left side, and from 0 to t on the right side [26] to get
Ln [(L – Lb)/(Lo – Lb)] = – t/Te (7)
where
- Lo = Level at time zero (t = 0)
- Lb = the balance level for a given inflow and Te
- Te = time for L to move (1 – 1/e) from L to Lb
- e = 2.7183
(The original integration of (6) contains two absolute functions, but they cancel each other because both L and Lo are always either above or below Lb.)
Raise e to the power of each side of (7), to get the level as a function of time:
L(t) = Lb + (Lo – Lb) exp(– t/Te) (8)
Equation (8) is the analytic solution of (5) when Lb and Te are constant.
2.2 Physics Model explanation
All equations after (2) are deductions from this hypothesis and the continuity equation (1).
The hypothesis (2) that outflow is proportional to level creates a “balance level.” Equation (4) defines the balance level in terms of inflow and e-time. If inflow exceeds outflow, the level increases. When level increases, outflow increases. When outflow equals inflow, the level equals the balance level and remains constant for constant inflow.
It may seem like the inflow and outflow are interlinked because, in general, increased inflow causes increased outflow. However, the physical processes are independent.
Consider the analogy of a bucket of water. Water flows into the bucket at the top and flows out through a hole in the bottom. Outside sources control the inflow. The water level and the hole size control the outflow, even if the inflow is zero.
The bucket analogy provides insight into e-time. If the hole in the bucket gets smaller, e-time increases. If the hole in the bucket gets larger, e-time decreases. The hole is an analogy to the ability of the oceans and land to absorb CO2 from the atmosphere.
It is not necessary to add separate inflows for human and natural CO2 to the Physics Model. The Physics Model applies independently and in total to all definitions of CO2, e.g., to human CO2, and natural CO2, and their sums, and to 12CO2, 13CO2, and 14CO2, and their sums.
The Physics Model is complete. Inflow and outflow include all the effects of outside processes. If the Physics Model were connected to land and ocean reservoirs, it would behave exactly as derived in this paper. The mathematics used in the Physics Model are analogous to the mathematics used to describe many engineering systems.
Discussion
Kohler [25] claims Harde’s [18] model and therefore the Physics Model is “too simplistic.” Kohler commented on Harde,
Harde … uses a too simplistic approach, that is based on invalid assumptions, and which leads to flawed results for anthropogenic carbon in the atmosphere. We suggest that the paper be withdrawn by the author, editor or publisher due to fundamental errors in the understanding of the carbon cycle.
Kohler wants Harde [18] withdrawn. In response, the journal refused to publish Harde’s (2017) rebuttal to Kohler.
There is no such thing as a system being “too simplistic.” A system should be as simple as possible to solve a problem.
2.2 Physics Model consequences
IPCC [1], [26] says nature emits into the atmosphere about 120 GtC from land and 90 GtC from
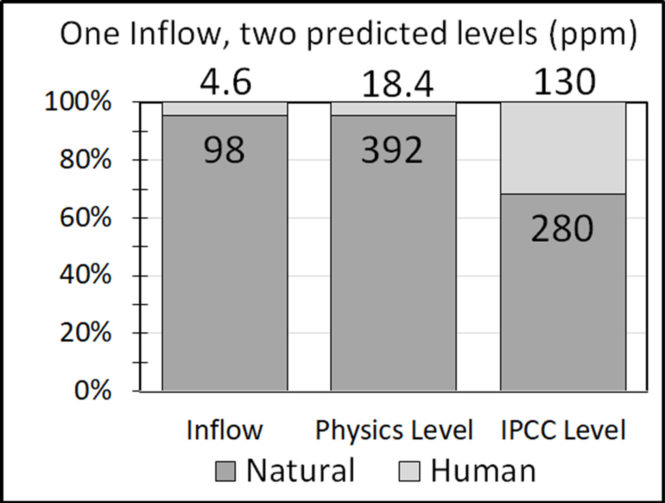
Boden [27] shows human CO2 emissions in 2014 were 9.7 GTC per year, or 4.6 ppm per year.
Equation (A.4) shows the balance level equals the product of inflow and e-time. Using IPCC numbers, and subscripts “h” to mean human and “n” to mean natural, the balance levels of human and natural CO2 are 18.4 and 392 ppm:
Lbh = 4.6 (ppm/year) * 4 (years) = 18 ppm (9)
Lbn = 98 (ppm/year) * 4 (years) = 392 ppm (10)
Their ratio and percentage are independent of residence time,
Lbh / Lbn = 4.6 / 98 = 18 / 392 = 4.6 percent (11)
Lbh / (Lbn + Lbh ) = 4.6 / 102.6 = 18.4 / 410 = 4.5 percent (12)
Equation (1) shows present human emissions create a balance level of 18 ppm. This is independent of nature’s balance level. If nature’s balance level remained at 280 ppm after 1750, then present human emissions would have increased the CO2 level 18 ppm from 280 ppm to 298 ppm.
Equation (2) shows present natural emissions create a balance level of 392 ppm. The human contribution of 18 ppm brings the total balance level to 410 ppm, which is close to the level in 2018.
Equation (3) shows the ratio of human to natural CO2 in the atmosphere equals the ratio of their inflows, independent of e-time. The IPCC calls the ratio in Equation (3) the “airborne fraction.”
Equation (4) shows the percentage of human-produced CO2 in the atmosphere equals its percentage of its inflow, independent of e-time.
Equations (1) and (2) support Harde [18] and its key conclusions:
Under present conditions, the natural emissions contribute 373 ppm and anthropogenic emissions 17 ppm to the total concentration of 390 ppm (2012).
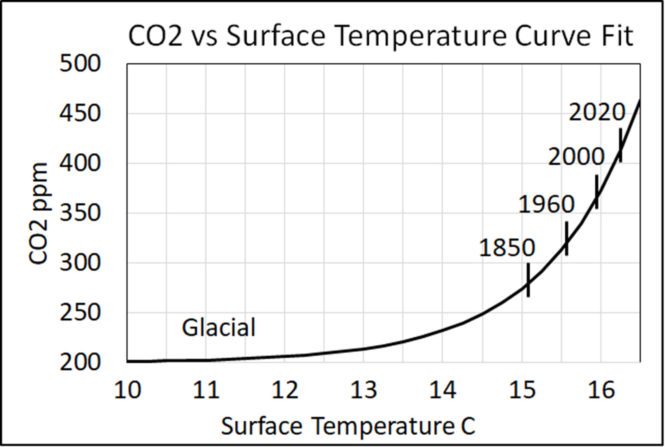
2.4 How temperature can increase CO2
Salby [17] shows how surface temperature changes the CO2 level. Harde [18] shows how an increase in surface temperature can account for the rise in atmospheric CO2 since 1750. The Physics Model suggests the cause-effect path is, first, surface temperature sets CO2 inflow and, second, inflow sets the CO2 balance level. Then there is a delay for the level to move to its new balance level.
Harde [18] showed how both inflow and outflow depend on surface temperature, and how this causes the balance level to be a non-linear function of surface temperature.
Figure 2 shows a plot of Harde’s equation (17) which shows CO2 level as a function of surface temperature.
3. Theories must replicate data
3.1 The Physics Model replicates the 14C data
The above-ground atomic bomb tests in the 1950s and 1960s almost doubled the concentration of 14C in the atmosphere. The 14C atoms were in the form of CO2, hereinafter called 14CO2.
After the cessation of the bomb tests in 1963, the concentration of 14CO2 decreased toward its natural balance level. The decrease occurred because the bomb-caused 14C inflow became zero while the natural 14C inflow continued.
The 14C data are in units of D14C per mil. In D14C units, the “natural” balance level is zero, as defined by the average measured level before 1950. If the natural 14C inflow were zero, then the natural balance level would be -1000 in D14C units [28].
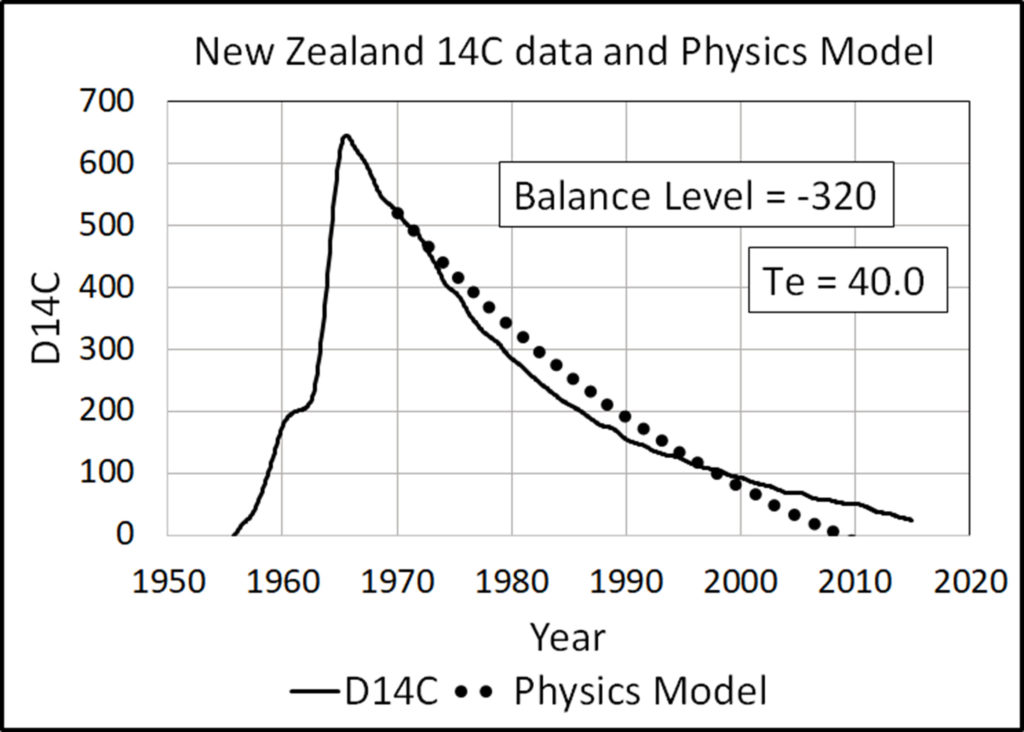
Hua [29] processed 14C data for both hemispheres from 1954 to 2010. Turnbull [29] processed 14C data for Wellington, New Zealand, from 1954 to 2014. After 1970, 14CO2 were well mixed between the hemispheres, and the 14C data from both sources are virtually identical after 1970.
The Physics Model (8) accurately replicates the 14CO2 data from 1970 to 2014 with e-time set to 16.5 years, balance level set to zero, and starting level set to the D14C level in 1970.
Figure 3 shows the global average D14C data for [28]. Figure 4 shows the New Zealand data for [29]. Both figures show the exact replication of the data by the Physics Model.

3.2 The IPCC Bern model
The Joos [31] Bern model is an integral equation rather than a level equation. To deconstruct the integral version of the Bern model, let inflow occur only in the year when “t-prime” equals zero. Then the integral disappears, and the Bern model becomes a level equation.
The Bern level equation is,
L(t) = Lo [ A0 + A1 exp(– t/T1) + A2 exp(– t/T2) + A3 exp(– t/T3)] (13)
Where
- t = time in years
- Lo = level of atmospheric CO2 in year t = 0
- L(t) = level of atmospheric CO2 in year t
and the Bern TAR standard values are,
- A0 = 0.150
- A1 = 0.252
- A2 = 0.279
- A3 = 0.319
- T1 = 173 years
- T2 = 18.5 years
- T3 = 1.19 years
The A-values weight the four terms on the right-hand side of (B.1):
A0 + A1 + A2 + A3 = 1.000
In (13), set t equal to infinity to get,
L = A0 Lo = 0.152 Lo (14)
Equation (14) predicts a one-year inflow that sets Lo to 100 ppm, followed by zero inflow forever, will cause a permanent level of 15 ppm.
3.3 The IPCC model cannot replicate the 14C data
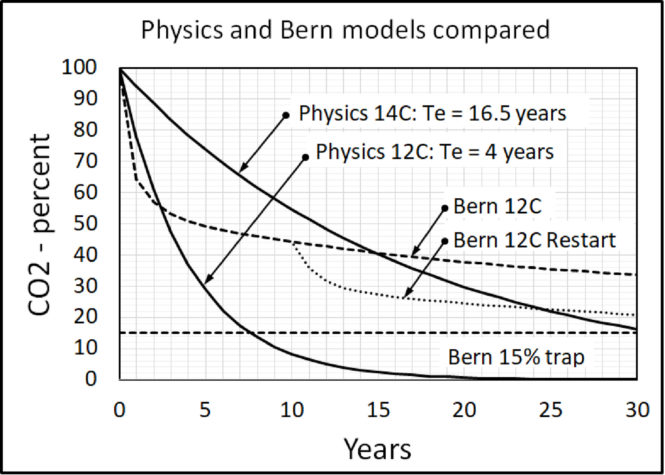
Figure 5 shows how the Bern model puts human CO2 into 4 different bins, each with a different decay time. One decay time is infinity.

Bern (13) predicts 15 percent all human CO2 entering the atmosphere stays in the atmosphere forever, 25 percent stays in the atmosphere almost forever, and 28 percent stays in the atmosphere longer than 14CO2 stays in the atmosphere. Only 32 percent flows freely out of the atmosphere.
Figure 6 shows the Bern model predictions using (13). The calculations begin with the initial level set to 100 and the balance level set to zero. Figure 6 includes the Physics Model replication of the 14C data. Equation (8) with an e-time of 4 years simulates the curve for 12CO2.
The Bern model begins with a short e-time then its e-time increases. The Bern line crosses the 14C line and thus conflicts with the 14C data. So, the Bern model is invalid.
The Bern model is also invalid because if restarted at any point, it cannot continue its same prediction line. The Bern model cannot properly restart because it depends upon its history, and a restart deletes its history. CO2 in the atmosphere does not “know” its history.
Also, IPCC [1] assumes its Bern model applies to human but not to natural CO2. That assumption is both unphysical and impossible because CO2 molecules from human and natural sources are identical. All valid models must treat human and natural CO2 the same.
Applied to natural CO2, Bern model (13) contradicts reality. It predicts 100 ppm per year of natural CO2 will cause 15 ppm per year to stay in the atmosphere forever. In 1000 years, that is 15,000 ppm stuck in the atmosphere forever. This clearly invalid prediction proves the Bern model is unphysical. IPCC’s climate models use the unphysical Bern model assumptions and therefore produce wrong predictions.
Discussion
The Bern model began with invalid physics.
In 1987, Maier-Reimer and Hasselmann [32] used an ocean circulation model connected to a one-layer atmosphere to reproduce the main features of the CO2 distribution in the surface ocean. They approximated the flow of CO2 from the atmosphere into the ocean can be by a sum of four exponentials with different amplitudes and time constants, as in today’s Bern model.
Siegenthaler and Joos [33] note it is difficult to model atmospheric CO2 using oceanic 14C lacking a physics model for atmospheric CO2.
Archer et al. [21] found such models “agreed that 20–35% of the CO2 remains in the atmosphere after equilibration with the ocean (2–20 centuries).”
Joos et al. [23] compared the response of such atmosphere-ocean models to a pulse emission of human CO2. All models predicted a “substantial fraction” of pulse would remain in the atmosphere and ocean for millennia.
The conclusions of [32], [33], [21], and [23] are invalid for five reasons:
- Inter-model agreement does not prove they are accurate.
- No model uses a valid physics model for atmospheric CO2.
- All models assume human CO2 causes all the increase in atmospheric CO2.
- All models treat human and natural CO2 differently.
- No model can replicate the 14C data.
3.4 Isotope data support the Physics Model
The Physics Model (12), predicts the ratio of human to natural CO2 in the atmosphere equals the ratio of their inflows, or 4.5 percent for human and 95.5 percent for natural CO2. IPCC [1] says natural CO2 is 68 percent and human CO2 is 32 percent.
Figure 7 shows how the predictions of the Physics and IPCC models differ.
Human fossil-fuel CO2 is “14C-free” and the 14C balance level has decreased. IPCC [3] and Kohler [25] claim this qualitative argument proves human CO2 caused all the rise in atmospheric CO2. The numbers show otherwise.
RealClimate [34] says the 13C/12C ratio for human CO2 is 98 percent of the natural CO2 ratio, and the 13C ratio has declined about 0.15 percent since 1850. RealClimate says this qualitative argument proves human CO2 caused all the increase in atmospheric CO2 since 1850. The numbers show otherwise.
3.5 Calculate model predictions
Human CO2 causes the new balance level of D14C and 13C/12C to be:
Lb = Ln Rn + Lh Rh (15)
Where
Lb = the new balance level (of D14C or 13C/12C)
Ln = the natural balance level (D14C = 0; 13C/12C = 100%)
Lh = the human balance level (D14C = –1000; 13C/12C = 98%)
Rn = the fraction of natural CO2
Rh = the fraction of human CO2
The Physics Model predicts for D14C:
Lb = (0) (0.955) + (–1000) (0.045) = – 45 (16)
The IPCC model predicts for D14C:
Lb = (0) (0.68) + (–1000) (0.32) = – 320 (17)
The Physics Model predicts for 13C/12C:
Lb = (100) (0.955) + (98) (0.045) = 99.91 (18)
The IPCC model predicts for 13C/12C:
Lb = (100) (0.680) + (98) (0.320) = 99.36 (19)
3.6 Show the model predictions
The Physics Model (16) predicts human CO2 has lowered the balance level of 14C from zero to –45. The IPCC model (17) predicts human CO2 has lowered the 14C balance level to –320.
Figure 8 shows the Physics Model comes close to the 14C data when the balance level is –45 and Te is 20. Although the fit is close, it is too high before 1995 and too low after.

Figure 9 shows the IPCC prediction does not match the 14C data.
In summary, the 14C data support the Physics Model and reject the IPCC model.
The Physics Model (18) predicts human CO2 has lowered the 13C ratio by 0.09. The IPCC model predicts human CO2 has lowered the 13C ratio by 0.64.
Figure 10 compares the Physics Model and IPCC model predictions to RealClimate’s numbers.

The 13C/12C data support the Physics Model and reject the IPCC model.
Discussion
Levin et al. [35] used absolute values of 14C and still concluded the “ocean-atmosphere disequilibrium today is close to pre-industrial times.”
4. Other problems with the IPCC Model
4.1 IPCC’s core argument is illogical
The IPCC [1] core argument notes that human emissions from 1750 to 2013 totaled 185 ppm while atmospheric CO2 increased by only 117 ppm.
However, the fact that the sum of human emissions is greater than the increase does not prove human CO2 caused the increase. The IPCC argument omits natural CO2 which totaled about 26,000 ppm during the same period. IPCC conclusion assumes natural CO2 inflow remained exactly constant since 1750, an invalid assumption.
IPCC [1] also claims nature has been a “net carbon sink” since 1750, so nature could not have caused the observed rise in atmospheric carbon dioxide.
Of course, nature is a “net carbon sink” because nature absorbs human CO2 emissions. But absorption of human CO2 does not prevent nature from increasing its own CO2 emissions because inflow and outflow are two different processes.
Discussion
Cawley [22] is a key paper for the IPCC theory. Cawley claims human CO2 caused all the increase of atmospheric CO2 above the 280 ppm in 1750. But Cawley’s attempted proof fails.
Cawley’s Equation (3) attempts to do the same job as Equation (A.2), namely, to represent how level sets outflow. But Cawley adds to his Equation (3) a term that represents a steady-state outflow that is independent of level. Cawley’s added term is fictitious because his first term on the right side of his Equation (3) is the true source of all outflow. As a result, Cawley’s Equations (3), (4), (5), and his equation after (5) are wrong, which makes his whole paper wrong.
Cawley’s Equation (7) should include his Fa for human inflow. His Equations (7) and (8) should omit his arbitrary Fe for outflow and set outflow equal to level (his C) divided by his residence time. His residence time is also inaccurate.
Cawley argues the ratio of human to natural CO2 in the atmosphere is a function of residence-time, which is incorrect. The Physics Model Equation (3) and common sense show the ratio is independent of e-time. Cawley equations cannot replicate the 14C data.
Cawley argues,
Lastly, the rise in atmospheric carbon dioxide closely parallels the rise in anthropogenic emissions … which would be somewhat of a coincidence if the rise were essentially natural in origin!
As already shown, Munshi [6] proves Cawley’s argument fails statistics.
Kohler [25] uses Cawley to “prove” the IPCC case. But Cawley fails physics and statistics. The IPCC theory pastes together observations without addressing the underlying physics.
4.2 IPCC’s time constants fail physics
The only hypothesis in the Physics Model is “outflow equals level divided by e-time” as shown in Equation (A.2). E-time is not a function of inflow.
The definition of e-time is precise. The Physics Model shows e-time is the time for the level L to move (1 – 1/e) of the distance from L to its balance level, Lb.
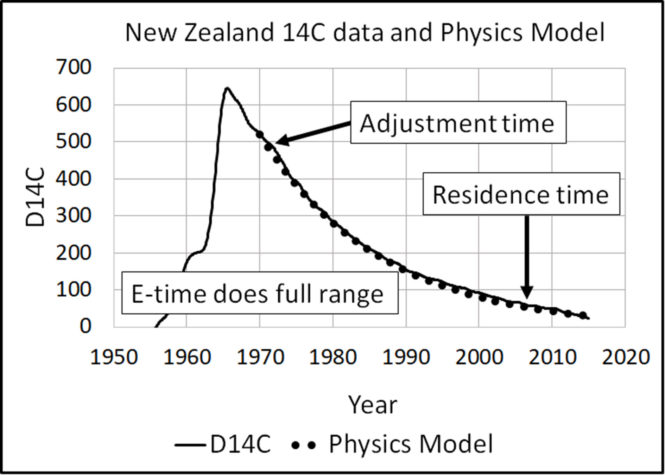
IPCC [35] defines “adjustment time (Ta)” as:
The time-scale characterising the decay of an instantaneous pulse input into the reservoir.
Cawley [22] defines “adjustment time (Ta)” as:
The time taken for the atmospheric CO2 concentration to substantially recover towards its original concentration following a perturbation.
The word “substantially” is imprecise.
Cawley follows IPCC to define “residence time (Tr)” as:
The average length of time a molecule of CO2 remains in the atmosphere before being taken up by the oceans or terrestrial biosphere.
In summary, IPCC uses two different time constants where it should use only e-time:
- When the level is far from its balance level (which can be zero), IPCC thinks e-time is an adjustment time because the level is moving rapidly toward its balance level.
- When the level is close to its balance level, IPCC thinks e-time is a residence time because “molecules” are flowing in and out with little change in level.
Figure 11 illustrates how e-time relates to IPCC’s adjustment and residence times.
IPCC defines “turnover time (Tt)” as:
The ratio of the mass M of a reservoir (e.g., a gaseous compound in the atmosphere) and the total rate of removal S from the reservoir: Tt = M/S.
IPCC’s turnover time seems to be the same as e-time.
IPCC says when outflow is proportional to level (the Physics Model hypothesis) then adjustment time equals turnover time. IPCC claims:
In simple cases, where the global removal of the compound is directly proportional to the total mass of the reservoir, the adjustment time equals the turnover time: Ta = Tt.
The Physics Model’s replication of the 14C data shows the 14CO2 outflow is proportional to level. Therefore, by IPCC’s own definition, adjustment time equals e-time equals residence time.
IPCC says in confusion:
In more complicated cases, where several reservoirs are involved or where the removal is not proportional to the total mass, the equality T = Ta no longer holds.
Carbon dioxide is an extreme example. Its turnover time is only about 4 years because of the rapid exchange between atmosphere and the ocean and terrestrial biota.
Although an approximate value of 100 years may be given for the adjustment time of CO2 in the atmosphere, the actual adjustment is faster initially and slower later on.
IPCC agrees 12CO2 turnover time (e-time) is about 4 years. IPCC claims adjustment time is “fast initially and slower later on” which is why its Bern model cannot replicate the 14C data in Figure 4.
The 14C data (Figures 3 and 4) is the upper bound for CO2 e-time. The e-time for 14CO2 is 16.5 years, not hundreds of years.
Discussion
Kohler [25] claims:
The IPCC summarizes the state of the art in peer-reviewed literature. Hence neither the residence time nor the adjustment time are assumptions or interpretations of the IPCC-AR5, but robust outcomes of the underlying science.
Kohler attempts to argue by authority. The implication of “Hence” is that IPCC summaries are so perfect that no one may disagree. That view violates the scientific method.
IPCC theory contradicts physics. Its so-called “state of the art in peer-reviewed literature” is a repetition of inbred, invalid, protected claims.
4.3 IPCC’s buffer theory is invalid
IPCC [26] claims the Bern model increases its residence time is because:
The fraction of anthropogenic CO2 that is taken up by the ocean declines with increasing CO2 concentration, due to reduced buffer capacity of the carbonate system.
There are three things wrong with this IPCC claim:
- It requires nature to treat human and natural CO2 differently, which is impossible.
- It assumes the much larger natural CO2 outflow does not reduce buffer capacity.
- It conflicts with the 14C data that show e-time is constant, which means buffer capacity has not changed.
Discussion
Kohler [25] claim human emissions have reduced the “buffer capacity” of the carbonate system:
the rise in atmospheric and oceanic carbon content goes along with an increase in the Revelle factor, a phenomenon which is already measurable. This implies that the oceanic uptake of anthropogenic carbon will become slower if we continue to increase anthropogenic CO2 emissions. This is already seen in all CHIMP5 model simulations.
Kohler’s last sentence illustrates the absence of logic by Kohler and the IPCC. They claim a model proves what has been fed into the model.
Kohler claims 14CO2 does not trace 12CO2 because 12CO2 is restrained by the decreased the ocean’s buffer capacity while 14CO2 is not.
The 14C data are the most accurate way to measure changes in the Revelle factor and “buffer capacity.” Kohler’s argument fails because the 14C data show the buffer capacity has been constant.
Levin et al. [35] concludes the C14 data provide “an invaluable tracer to gain insight into the carbon cycle dynamics.” RealClimate [33] agrees, “All isotopes of an element behave in a similar way chemically.”
As an isotope, 14CO2 will undergo the same chemical reactions as 12CO2, except slower. Both isotopes will seek their balance level according to their e-time.
4.4 IPCC’s argument does not correlate
A standard scientific test for the non-existence of cause and effect is to show the correlation of the assumed cause with the assumed effect is zero. For the IPCC to argue that human CO2 causes climate change, the IPCC must show that the correlation of human emissions with increase in atmospheric CO2 is significantly greater than zero.
IPCC claims the trend of human CO2 correlates with the trend in atmospheric CO2. But that conclusion is incorrect because the IPCC does not detrend the time series as required for a proper statistical analysis. Munshi [6] has calculated a proper detrended correlation of human CO2 emissions with changes in atmospheric CO2. Munshi shows the annual correlation is ZERO. [38] found the correlation for time intervals from one to five years is also ZERO. This is further evidence that the Physics Model is correct, and the IPCC model is incorrect.
Conclusions
The 14C data after 1970 show how CO2 flows out of the atmosphere. All valid CO2 models must replicate these 14CO2 data. The Physics Model exactly replicates these 14C data and the IPCC model does not.
The Physics Model shows the ratio of human to natural CO2 in the atmosphere equals the ratio of their inflows. Inflow and e-time set the balance level of CO2 in the atmosphere. The level and e-time set the outflow. When inflow exceeds outflow, the level increases. As the level increases, outflow increases. When outflow equals inflow, the level equals the balance level and remains constant if inflow remains constant.
Continued constant CO2 emissions do not add more CO2 to the atmosphere. CO2 emissions only set balance levels. The balance level of present human CO2 is about 18 ppm. The balance level of natural CO2 is about 392 ppm, for a total of 410 ppm.
To the extent that atmospheric CO2 causes climate change, nature is 94% responsible and human CO2 is only 5% responsible.
Acknowledgments
The author thanks Chuck Wiese, Laurence Gould, Tom Sheahen, and Charles Camenzuli, who reviewed this paper and provided scientific critique, and Daniel Nebert, Gordon Danielson, and Valerie Berry, who provided language and grammar improvements. This research project was funded by the personal funds of Valerie and Edwin Berry.
Downloads
References
[1] IPCC: Working Group 1: The scientific basis. The Carbon Cycle and Atmosphere CO2; 2001. https://www.ipcc.ch/site/assets/uploads/2018/02/TAR-03.pdf
[2] USGCRP: Climate Science Special Report: Fourth National Climate Assessment, Volume I [Wuebbles, D.J., D.W. Fahey, K.A. Hibbard, D.J. Dokken, B.C. Stewart, and T.K. Maycock (eds.)]. U.S. Global Change Research Program, Washington, DC, USA, 470 pp; 2018. doi: 10.7930/J0J964J6. https://science2017.globalchange.gov/
[3] IPCC: The IPCC Scientific Assessment (1990): 1.2.5. Evidence that the Contemporary Carbon Dioxide Increase is Anthropogenic. Page 14; 1990. https://www.ipcc.ch/site/assets/uploads/2018/03/ipcc_far_wg_I_chapter_01.pdf
[4] Segalstad, T. V.: Carbon cycle modelling and the residence time of natural and anthropogenic atmospheric CO2: on the construction of the “Greenhouse Effect Global Warming” dogma. In: Bate, R. (Ed.): Global warming: the continuing debate. ESEF, Cambridge, U.K. [ISBN 0952773422]: 184-219; 1998. http://www.co2web.info/ESEF3VO2.pdf
[5] Jaworowski, Z.: Climate Change: Incorrect information on pre-industrial CO2. Statement written for the Hearing before the US Senate Committee on Commerce, Science, and Transportation; 2004. http://www.mitosyfraudes.org/Calen5/JawoCO2-Eng.html
[6] Munshi, Jamal: Responsiveness of atmospheric CO2 to fossil fuel emissions: Updated. SSRN; 2017. https://papers.ssrn.com/sol3/papers.cfm?abstract_id=2997420
[7] Revelle, R. & Suess, H.: CO2 exchange between atmosphere and ocean and the question of an increase of atmospheric CO2 during past decades. Tellus. 9: 18-27; 1957. http://onlinelibrary.wiley.com/doi/10.1111/j.2153-3490.1957.tb01849.x/abstract.
[8] Starr, C.: Atmospheric CO2 residence time and the carbon cycle. Science Direct, 18, 12, 1297-1310; 1992. https://www.sciencedirect.com/science/article/pii/0360544293900178
[9] Segalstad, T.V.: The amount of non-fossil-fuel CO2 in the atmosphere. AGU Chapman Conference on Climate, Volcanism, and Global Change. March 23-27. Hilo, Hawaii. Abstracts: 25; and poster: 10 pp; 1992. http://www.co2web.info/hawaii.pdf
[10] Segalstad, T.V.: The distribution of CO2 between atmosphere, hydrosphere, and lithosphere; minimal influence from anthropogenic CO2 on the global “Greenhouse Effect”. In Emsley, J. (Ed.): The Global Warming Debate. The Report of the European Science and Environment Forum. Bourne Press Ltd., Bournemouth, Dorset, U.K. [ISBN 0952773406]: 41-50; 1996. http://www.co2web.info/ESEFVO1.pdf
[11] Rorsch, A., R.S. Courtney, D. Thoenes: The Interaction of Climate Change and the CO2 Cycle. Energy & Environment, Volume 16, No 2; 2005. https://journals.sagepub.com/doi/pdf/10.1260/0958305053749589
[12] Courtney, R.S.: Limits to existing quantitative understanding of past, present and future changes to atmospheric CO2 concentration. International Conference on Climate Change, New York. 2008. https://www.heartland.org/multimedia/videos/richard-courtney-iccc1
[13] Quirk, Tom: Sources and sinks of CO2. Energy & Environment. Volume: 20 Issue: 1, page(s): 105-121. January 1; 2009. https://journals.sagepub.com/doi/10.1260/095830509787689123
[14] Essenhigh, R.E.: Potential dependence of global warming on the residence time (RT) in the atmosphere of anthropogenically sourced CO2. Energy & Fuels. 23, 2773-2784; 2009. https://pubs.acs.org/doi/abs/10.1021/ef800581r
[15] Glassman, J.A.: On why CO2 is known not to have accumulated in the atmosphere and what is happening with CO2 in the modern era. Rocket Scientist Journal; 2010. https://www.rocketscientistsjournal.com/2007/06/on_why_co2_is_known_not_to_hav.html#more
[16] Humlum, O., Stordahl, K., Solheim, J.-E.: The phase relation between atmospheric CO2 and global temperatures. Global and Planetary Change, Vol 100, January, pp 51-69; 2013. https://www.sciencedirect.com/science/article/pii/S0921818112001658
[17] Salby, Murry: Physics of the Atmosphere and Climate. Cambridge University Press. 666 pp; 2012. https://www.amazon.com/Physics-Atmosphere-Climate-Murry-Salby/dp/0521767180/ref=mt_hardcover?_encoding=UTF8&me=
[18] Harde, H.: Scrutinizing the carbon cycle and CO2 residence time in the atmosphere. Global and Planetary Change. 152, 19-26; 2017. https://www.sciencedirect.com/science/article/pii/S0921818116304787. (https://edberry.com/wp-content/uploads/Climate/HardeHermann17-March6-CarbonCycle-ResidenceTime.pdf)
[19] Berry, E. X: A fatal flaw in global warming science. Basic Science of a Changing Climate. Porto University, Portugal. Sep 7; 2018. https://www.portoconference2018.org/uploads/1/1/7/3/117342822/11_edwinberryportosep7final.pdf
[20] Berry, E. X: Contradictions to IPCC’s climate change theory. Annual meeting of the American Meteorological Society, Phoenix; 2019. https://ams.confex.com/ams/2019Annual/meetingapp.cgi/Paper/349565
[21] Archer, D., Eby, M., Brovkin, V., Ridgwell, A., Cao, L., Mikolajewicz, et al.: Atmospheric Lifetime of Fossil Fuel Carbon Dioxide, Annu. Rev. Earth Planet. Sci., 37, 117–134; 2009. http://doi:10.1146/annurev.earth.031208.100206.https://www.annualreviews.org/doi/pdf/10.1146/annurev.earth.031208.100206
[22] Cawley, G.C.: On the Atmospheric residence time of anthropogenically sourced CO2. Energy Fuel 25, 5503–5513; 2011. http://dx.doi.org/10.1021/ef200914u
[23] Joos, F., R. Roth, Fuglestvedt, J. S., Peters, G. P., Enting, I. G., von Bloh, et al.: Carbon dioxide and climate impulse response functions for the computation of greenhouse gas metrics: a multi-model analysis. Atmospheric Chemistry and Physics 13(5),
[24] Kern, Z. and Leuenberger, M.: Comment on “The phase relation between atmospheric CO2 and global temperature” Humlum et al. [Glob. Planet. Change 100: 51–69.]: Isotopes ignored. Glob. Planet. Chang. 109, 1–2; 2013. https://dx.doi.org/10.1016/j.gloplacha.2013.07.002
[25] Kohler, P., Hauck, J., Volker, C., Wolf-Gladrow, D.A., Butzin, M., Halpern, J.B., et al.: Comment on “Scrutinizing the carbon cycle andCO2residence time in the atmosphere” by H. Harde, Global and Planetary Change; 2017. https://www.soest.hawaii.edu/oceanography/faculty/zeebe_files/Publications/KoehlerGPC17.pdf
[26] IPCC: Fourth Assessment Report: The Physical Science Basis, Figure 7.3; 2007. https://www.ipcc.ch/site/assets/uploads/2018/02/ar4-wg1-chapter7-1.pdf
[27] Boden, T. and Andres, B. (2017) Global CO2 emissions from fossil-fuel burning, cement manufacture, and gas flaring: 1751-2014. http://cdiac.ornl.gov/ftp/ndp030/global.1751_2014.ems.
[28] Hua, Q., Barbetti, M. and Rakowski, A. Z.: Atmospheric radiocarbon for the period 1950–2010. RADIOCARBON, Vol 55, Nr 4, 2013, p 2059–2072. Table S2c – Global Δ14C for boreal summers (May-Aug); 2013. https://doi.org/10.2458/azu_js_rc.v55i2.16177
[29] Turnbull, J. C., Mikaloff Fletcher, S. E., Ansell, I., Brailsford, G. W., Moss, R. C., Norris, et al.: Sixty years of radiocarbon dioxide measurements at Wellington, New Zealand: 1954–2014. Atmos. Chem. Phys., 17, 14771–14784; 2017. BHDCGO_MONTHLY_SMOOTH_CURVE, Output from bhd_smoothcurve.pro 2016112, D14C_trend https://doi.org/10.5194/acp-17-14771-2017
[30] Maier-Reimer, E. and Hasselmann, K.: Transport and storage of CO2 in the ocean – an inorganic ocean-circulation carbon cycle model, Climate Dynamics 2(2):63–90; 1987. DOI: 10.1007/BF01054491
[31] Siegenthaler, U. and Joos, F.: Use of a simple model for studying oceanic tracer distributions and the global carbon cycle. Tellus, 44B, 186-207; 1992. https://onlinelibrary.wiley.com/doi/10.1034/j.1600-0889.1992.t01-2-00003.x/epdf
[32] Levin, I., T. Naegler, B. Kromer, M. Diehl, R. Francey, A. Gomez-Pelaez, et al.: Observations and modelling of the global distribution and long-term trend of atmospheric 14CO2. Tellus B: Chemical and Physical Meteorology; 2010. https://www.tandfonline.com/doi/abs/10.1111/j.1600-0889.2009.00446.x
[33] RealClimate: Isotopes; 2004. http://www.realclimate.org/index.php/archives/2004/11/isotopes/
[34] RealClimate: How do we know that recent CO2 increases are due to human activities? 2004. http://www.realclimate.org/index.php/archives/2004/12/how-do-we-know-that-recent-cosub2sub-increases-are-due-to-human-activities-updated/
[35] IPCC Working Group 1: The scientific basis. Appendix 1 – Glossary; 2001.
https://www.ipcc.ch/site/assets/uploads/2018/03/TAR-APPENDICES.pdf
[36] Dwight, H. B.: Tables of Integrals and Other Mathematical Data, Item 90.1. MacMillian Company; 1955. https://www.amazon.com/Tables-Integrals-Other-Mathematical-Data/dp/0023311703
[37] Joos, F.: Parameters for tuning a simple carbon cycle model; 2002. https://unfccc.int/resource/brazil/carbon.html
Excellent! I think this presents your points clearly and even a layman like myself can drill into it to get the common sense heart of your position and the physics model.
An acquaintance attended last years AMS meeting and told me John Christie was the only presenter with a position differing from the IPCC. I couldn’t be right to disagree all of those scientists. I told here I felt in good company with John Christie.
I am especially glad to see your refutation of Kohler. That whole process that refused Harde a chance to defend his work was and remains repugnant.
Excellent article and contradictions to IPCC’s Climate Change Theory! Your article takes me a while to digest, so I must read and re-read a number of times before it becomes strikingly clear. I became interested in Climate Science once it was politicized, knowing the IPCC was typically funded by governments around the globe and these contractors would say and do anything to continue their lavish lifestyles.
Congratulations for being recognized with the AMS publishing and invitation to present! Really appreciate your expert and hard work on this. And persistence!! It may be slow to payoff, but it will. And we thank you!
You have written:
“3.2 13C data support the physics model
Let R equal the 13C/12C ratio.
RealClimate (2004b) says R for human emissions is about 98 percent of the R in natural emissions, and that R has declined about 0.15 percent since 1850. RealClimate concludes the above data prove human CO2 caused all the increase in atmospheric CO2 since 1850.
RealClimate (2004b) says R has declined about 0.15 percent since 1850 and concludes this means human CO2 caused all the increase in atmospheric CO2.” Is this last sentence redundant?
I liked your paper.
Dear Colin,
Thank you very much for catching this error. To correct it, I have deleted the last sentence that was indeed redundant.
Ed
Colin,
The problem of the origin of what resides as CO2 in the atmosphere is in the deep oceans. Vegetation and ocean surface are in fast exchange with the atmosphere and what is absorbed in one season is largely released the next season, the lag in 13C/12C (or 14C/12C) ratio change then is only a few years, which is observed in ocean surface and vegetation.
The exchange between the atmosphere and the deep oceans has a lag of about 1000 years: what goes into the deep is the isotopic composition of today, what returns the same year is the composition of ~1000 years ago, not affected by human activities.
One can calculate the residual change in 13C/12C ratio for different deep ocean – atmosphere exchanges, that gives a near constant CO2 flux between equatorial upwelling and polar sinks of about 40 GtC (20 ppmv) per year:
http://www.ferdinand-engelbeen.be/klimaat/klim_img/deep_ocean_air_zero.jpg
Independently confirmed by the faster decay rate of 14C from the bomb tests.
The discrepancy in the years before 1970 is probably from vegetation: more source than sink in that period (forest cutting?). After 1990 more sink than source: the earth is greening.
As all inorganic CO2 (oceans, volcanoes, carbonate rocks,…) is high in 13C/12C ratio and all (living and fossil) organic CO2 is (much) lower in 13C/12C ratio, there are only two main sources of low 13C CO2: vegetation and fossil fuel use. Vegetation is a proven net sink (based on O2 release), thus all reduction of the 13C/12C ratio in the atmosphere/vegetation/oceans is from the use of fossil fuels.
Based on the observed 13/12C ratio in the atmosphere, about 1/3 of all original human emissions still resides in the atmosphere, or about 10%, way above the 4% according to the physics theory.
Dear Ferdinand,
History is irrelevant to the issue because only the present state of the land and oceans sets the inflow of CO2 into the atmosphere, and the physics model properly describes how inflow sets balance levels. By “properly” I mean the physics model is the ONLY model that explains the data. Therefore, it is the only model that we can use to explain how inflow changes level.
Before 1970, the northern hemisphere had more 14C than the southern hemisphere. It took until about 1970 for the 14C to become about equal in each hemisphere.
Thereafter, the 14CO2 show it exits the atmosphere with outflow proportional to level.
My sections 3.1 and 3.2 show how only the physics model explains the present levels of 14C and 13C in the atmosphere.
I will welcome any good explanation of why my sections 3.1 or 3.2 may be wrong. So far, your challenge does not accomplish that goal.
The residence time is critical to your thesis. I think you need to emphasise that the residence time of 4 years for 12CO2 is constrained.
The Physics Theory requires that the residence time is constant (the basis being that this is what is expected in natural systems, and that expectation is confirmed by the measured behaviour of atmospheric 14CO2). The residence time selected for 12CO2 is derived from the passage where the IPCC says the initial “turnover time” is 4 years. (Is there a more sound basis for selecting 4 years? Are there experimental results? Why did the IPCC say 4 years?)
Perhaps you could consider this emphasis at the start of Section 4.2
Secondly, have you done a sensitivity analysis? How sensitive are your conclusions to the selected residence time?
Dear Colin,
Thank you for your comment. The first constraint on the residence time of 12CO2 is it must be less than the 16.5 years for 14CO2.
Equation (A.4) shows Te = Level / Inflow. So we use the known recent balance level of about 400 pm and divide by the IPCC claimed inflow of about 100 ppm/year, to get a 4-year residence time.
But more important are Eqs. (3) and (4) in section 4.2. They show the ratio of human to natural balance levels is the ratio of their inflows INDEPENDENT of residence time. So, my major conclusions are independent of residence time.
Thanks.
Figure 4 uses the 4 year residence time and it is discussed in Section 2. Your very clear statement above (“Equation (A.4) shows Te = Level / Inflow. So we use the known recent balance level of about 400 pm and divide by the IPCC claimed inflow of about 100 ppm/year, to get a 4-year residence time.”) could be used to justify the use of 4 years in Figure 4.
Colin
There is a good section on residence time analysis in Tom Segalstad’s “Carbon Cycle Modeling and Residence time of Natural and Anthropogenic CO2” where he lists about 30 tests done in the last 50 or so years using several techniques. The results varied from 2 to 20 years mostly around 4-6years.
Thank you, DMA,
Segalstad’s paper is in my references. The link to his paper is:
http://www.co2web.info/ESEF3VO2.pdf
Dr. Ed,
If your theory is right, then there should be a huge increase (30%) in natural inflow to explain the 30% increase of CO2 in the atmosphere, that means that the residence time should have remained constant over time.
If you split the table at page 13 of Segalstad’s work in half the oldest and half the newest estimates, you will see that the newer estimates (with mid-range for estimated ranges) show a slight increase in residence time over the two periods, which points to a rather stable CO2 throughput in an increasing CO2 mass of the atmosphere.
Of course, that are only estimates, but there are no indications that the carbon cycle increased near 30%.
The rest of Segalstad’s work is completely obsolete: ice core CO2 and other measurements are very reliable and atmospheric CO2 measurements are superb with very rigorous calibration procedures, of which many temperature stations can learn a lot…
I found Sections 3.1 and 3.2 hard going.
What is the Test applied in Tables 3.1 and 3.2?
Dear Colin,
I understand your feelings. I just finished making some charts that summarize the data in Tables 1 and 2. I will add these charts to sections 3.1 and 3.1. Give me about 10 minutes and then tell me if the charts help.
OK. I added charts to sections 3.1 and 3.2. Do these charts help explain the points of these sections?
The main point is the IPCC claims the 14C and 13C data support its theory. But when we insert the numbers, we find these data support the physics theory and reject the IPCC theory.
I may now move the tables to Appendices.
Thanks. Much better.
It might also be improved by eliminating the shorthand “R” and substituting the word “ratio”. EG:
“RealClimate (2004b), in support of the IPCC, says the 13C/12C CO2 ratio for human emissions is about 98 percent of that in natural emissions, and that it has declined about 0.15 percent since 1850. RealClimate concludes the above data prove human CO2 caused all the increase in atmospheric CO2 since 1850. But it is important to use numbers to find the real conclusion.
The physics model assigns 95.5 percent to natural emissions and 4.5 percent to human emissions, according to Fig. 1. The IPCC model assigns 68 percent to natural emissions and 32 percent to human emissions. The physics model concludes human emissions will have lowered the 13C ratio by 0.09. The IPCC model concludes human emissions will have lowered the 13C ratio by 0.64. The calculations are shown in Appendix E”
Just a suggestion. There is a small typo in the last “ratio” in this passage, where you have “ration”.
Physicist John Reid’s article THE EMBARRASSING BOMB-TEST-CURVE covers this topic and possible mechanisms at his blog
http://blackjay.net/?p=262
Euan Mearns has a nice background article, which shows that the 14C bomb curve can’t be used to show what happens with a 12CO2 peak:
http://euanmearns.com/whats-up-with-the-bomb-model/
Dear Ferdinand, I am presently working on an addition to my preprint that explains why Euan Mearns is wrong. Sorry, but you will have to wait until I finish that part before we can argue the details.
Physics to the rescue! Appreciate this paper so much. Brilliant use of the C14 data, who’d have known the nuclear bomb saved us again from tyranny…
Dr. Ed,
We have been there before…
As you know, I do differ in opinion as good with your theory as with the IPCC’s Bern model. Both are wrong on essential points.
1. outflow is proportional to level
That is only true for pressure driven processes. The largest CO2 fluxes are seasonal and temperature driven and e.g. the spring/summer uptake of CO2 by plants is entirely driven by temperature, where any extra CO2 pressure in the atmosphere plays a minor role. The uptake is estimated at about 30 ppmv/season with a similar release in fall/winter by vegetation decay. The influence of pressure in the same vegetation is about 1 ppmv/year with as result an increase in total biomass.
Temperature thus drives the residence time, which is about 5 years, not 16.5 years.
Any extra CO2 pressure above the temperature controlled dynamic equilibrium between ocean surface and atmosphere (per Henry’s law for the solubility of CO2 in seawater) gives you an extra uptake, as well as in vegetation as in the (deep) oceans. That is a much slower process, surprisingly linear over the past 60 years: about 50 years e-fold decay rate. An order of magnitude slower than the residence time.
2. About the introduction:
– The IPCC does assume that all CO2 increase in the atmosphere is caused by human emissions, they don’t assume that all original human CO2 still resides in the atmosphere as your graph suggests, because about 20%/year of all CO2 in the atmosphere is exchanged with CO2 from other reservoirs, especially the deep oceans which have a 14C and 13C/12C ratio of about 1,000 years ago, thus reducing the 14C and increasing the 13C/12C ratio compared to if all human CO2 should remain in the atmosphere.
– The physics model shows a maximum of about 4% human CO2 in the atmosphere, while observations show a 13/12C ratio of above 9% human CO2 in the current atmosphere. Something is wrong in the model…
The essence of the discussion lies in:
outflow equals level divided by residence time
Which is only true if all in/outflows are in the same direction at any moment of time, which is not the case.
The residence time in essence is:
residence time = level / throughput
If you have one input and one output, once in equilibrium, you can use input or output i.s.o. throughput to calculate the residence time. Or reverse, using level and residence time to calculate the outflow.
If you have many inputs and outputs, it doesn’t matter for the calculation of the residence time whatever the direction and timing is of the individual fluxes. But that has a tremendous influence on the reverse formula as used in the physics model.
In the real world the two main seasonal fluxes are opposite to each other in time:
During spring/summer some 30 ppmv is absorbed by vegetation.
In the same period, some 25 ppmv is released by the ocean surface.
Net result: -5 ppmv in the NH, near zero in the SH.
Net result over a year: -5 ppmv in spring/summer, +5 ppmv in fall/winter, about zero ppmv over a year.
With an average extra CO2 pressure of near zero in the atmosphere, there is near zero extra output caused by that pressure…
See: http://www.ferdinand-engelbeen.be/klimaat/klim_img/seasonal_CO2_MLO_trend.jpg
Conclusion: you can’t use the reverse physics formula of the residence time, if the fluxes are not all in parallel at every moment in time.
Then the 14C graph. Based on the estimated fluxes in different ways, the residence time for any CO2 molecule in the atmosphere is about 5 years. The decay rate of 14C from the bomb tests is about 16 years, while the decay rate of any extra 12CO2 is about 50 years. What gives the discrepancy?
– The residence time has no connection at all with the decay rate of any extra CO2 in the atmosphere above equilibrium.
– The decay rate of any extra 14C is much faster than for any extra 12CO2 above equilibrium, as what goes into the deep oceans is the composition of any given year, what returns is the composition of ~1000 years ago. In 1960, at the height of the bomb tests, some 97.5% of all 12CO2 mass (not the same molecules!) returned the same year, while only some 45% of 14CO2 mass returned. With as result a much faster decay rate for 14CO2 than for 12CO2…
See: http://www.ferdinand-engelbeen.be/klimaat/klim_img/14co2_distri_1960.jpg
Dear Ferdinand,
Thank you again for your comments. Here is my reply.
Indeed, temperature varies with season and the warmer growing season consumes more CO2 than the non-growing season, and seasons vary with hemisphere. However, over the year, the CO2 consumed by plants depends upon the level of CO2 in the atmosphere, just like plant growth depends on the level of CO2 in a greenhouse. So, over the year, outflow is proportional to level.
Also, instantaneously, outflow it proportional to level. Outflow is always pressure driven so long as there is a place for it to go. If there were no plants or oceans, then there would be no outflow of CO2, as well as no inflow. But that is not the situation we are trying to explain.
Regardless of the interannual cycles, the 14C data prove several things because its outflow is much greater than its inflow.
(a) Outflow = level / residence time, independent of inflow. Were this not true, the physics model would not exactly match the 14C data.
(b) The IPCC model does not match in any manner the 14C data. Therefore, the IPCC model is wrong.
(c) Because Outflow = level / residence time, even the IPCC agrees that Residence time = adjustment time.
(d) So, exchange of molecules has the same residence time as the change in level. There is no separate “e-fold” decay time. There are no slower processes that restrict the faster processes. The concept of an e-fold time that differs from residence time contradicts the 14C data. It also needlessly complicates the physics. To do good physics, we must follow Occam’s Razor: the simplest model that explains the data wins.
(e) 14CO2 has a residence time of 16.5 years. 12CO2 will have a shorter residence time, like 4 to 5 years. Rather than in its slower speed, 14CO2 follows 12CO2.
Regarding your comment about my Introduction:
(f) Nor does the physics model assume all the original human CO2 is still in the atmosphere.
(g) Arguments based upon ocean flows 1,000 years ago, or exchanges of 20 percent per year, or that original human inflow has flowed out of the atmosphere are irrelevant and serve only to confuse the physics, which is really simple:
(h) Present inflow set the present balance levels in the atmosphere. The ratio of human to natural CO2 inflows set the ratio of the human to natural CO2 balance levels in the atmosphere, independent of residence time.
(i) Similarly, the inflows of 14CO2 and 13CO2 set the balance levels 14CO2 and 13CO2, according to the physics model.
(j) Details of the processes in the oceans and land are irrelevant because only their resulting inflows affect the balance levels in the atmosphere. The physics model properly describes how inflows set the balance levels in the atmosphere.
(k) The IPCC assumes nature’s inflow has remained constant since 1750 and therefore its balance level remained constant at 280 ppm. If that assumption were true, then the level of CO2 in the atmosphere today would be nature’s contribution of 280 plus the human contribution of 18 for a total of 298 ppm.
(l) Every argument the IPCC makes to justify its claim that human CO2 added 130 ppm to the level of CO2 in the atmosphere breaks down. The only way that could be true is for the ratio of human to natural CO2 inflows to be 130/280. And that ratio contradicts the IPCC assumed data.
(m) My sections 3.1 and 3.2 show the proper calculations of how the physics model and IPCC model predictions fit the 14CO2 and 13CO2 data. Only the physics model can explain the data. The IPCC model cannot explain the data.
Regarding your other comments:
(n) The physics model is the only model that explains the 14C data.
(o) Yes, the 14CO2 has a residence time according to its data of about 16.5 years.
(p) There is no evidence that 12CO2 has or can have a longer residence time than 14CO2. There is no discrepancy in the data or in the physics model. The only discrepancy is in the incorrect IPCC model.
(q) The respective residence times measure how fast 14CO2 or 13CO2 or 12CO2 exits the atmosphere and they all exit in proportion to their levels.
(r) The approach of the level to its balance level is the same whether the level is above or below its balance level. The 14C data show the case of the level being higher than its balance level determined by natural processes.
(s) What happened 1000 years ago and what happened even last year only affects the present inflow, which sets the balance level. And the physics model properly describes how any inflow changes the level of CO2 in the atmosphere. The IPCC model cannot do this.
(t) Finally, the physics model shows the ratio of human to natural CO2 in today’s atmosphere is determined by the ratio of their inflows, independent of residence time. Nothing you have written contradicts this conclusion.
Dear Dr. Ed,
To start with:
the CO2 consumed by plants depends upon the level of CO2 in the atmosphere
Yes, but that is not more than about 1 ppmv/year, or together with the ocean sinks about 2.5 ppmv/year. That is a “residence time” of about 50 years:
http://www.ferdinand-engelbeen.be/klimaat/klim_img/dco2_em2.jpg
There is hardly any influence of the increased CO2 pressure in the atmosphere on the seasonal cycle, the amplitude (that is the difference between ocean release and plant uptake and reverse) hardly changed over the years, despite over 20% more CO2 in the past 60 years:
http://www.ferdinand-engelbeen.be/klimaat/klim_img/seasonal_CO2_MLO_trend.jpg, only the residual change doubled, but still is only half human emissions…
Still a lot of CO2 is cycling in and out the atmosphere over the seasons, which gives the 5 years residence time, but that doesn’t make any difference in removing any extra CO2 above equilibrium.
Then:
Outflow = level / residence time, independent of inflow. Were this not true, the physics model would not exactly match the 14C data.
As the definition of residence time is level/throughput, and when in balance also level/input or level/output, not reverse, I find your explanation rather questionable…
What you have proven is that the 14CO2 decay rate is linear with the extra level in the atmosphere above equilibrium, with an e-fold decay rate of about 16.5 years
But it is not because the IPCC’s Bern model is wrong, that your model is right for the right reasons…
Problem:
I don’t see how you jump from a residence time of 4 years for all CO2 to a residence time of 16.5 years to explain the 14C curve. The absorption of 14CO2 by oceans and plants is somewhat slower than for 12CO2, but that is in the % range, not a fourfold. Moreover the 14C decay rate in the ocean surface and vegetation follows the atmosphere with only a few years delay. Thus where is your 16.5 years decay rate based on and why not 4 years?
At last (gets late here):
Nothing you have written contradicts this conclusion.
That is about the 13C/12C ratio in the atmosphere.
If you take the pre-industrial ratio as base, and a constant exchange with the deep oceans, then the current atmosphere contains about 10% human CO2, way above the physics model…
BTW, Fig.7 shows the 13C/12C ratio according to the IPCC model, if all original human CO2 still resides in the atmosphere, but 2/3 of that is already replaced by deep ocean CO2 at a higher 13C/12C ratio, thus even the Bern model gives about the right answer on that point: about 0.21 decrease in ratio.
Dear Ferdinand,
“… about 2.5 ppmv/year. That is a “residence time” of about 50 years.”
There is no residence time of 50 years in the data. 50-years is a belief that contradicts the data.
The 14C data are fundamental data that all models must predict. The data prove 14CO2 has a 16.5-year residence time and the outflow is equal to level / residence time. And this proves e-fold time equals residence time. There is no reason to make the picture more complicated. Simplicity that succeeds always wins.
Assuming ocean sinks consume about 2.5 ppmv/year does not prevail over the 14C data. The 14C data prove the 2.5 ppmv/year is not good data.
“There is hardly any influence of the increased CO2 pressure in the atmosphere on the seasonal cycle. Only the residual change doubled, but still is only half human emissions…”
The physics model does not predict there would be any change. The comparison to the sum of human emissions is not valid because it assumes the IPCC model is correct.
The proper way to view the change of CO2 levels is to use the physics differential equation:
dL/dt = Inflow – Outflow.
This equation does not depend upon history. No valid model depends upon history.
“As the definition of residence time is level/throughput, and when in balance also level/input or level/output, not reverse, I find your explanation rather questionable…”
The physics model derivation in Appendix A has only assumption: Outflow = Level/Residence time. The 14C data prove this assumption is valid. All other physics model equations are deductions, not assumptions. To prove a theory is wrong, we must show that it makes a prediction that contradicts data.
“What you have proven is that the 14CO2 decay rate is linear with the extra level in the atmosphere above equilibrium, with an e-fold decay rate of about 16.5 years.”
Not true. The match of the physics model prediction to the 14C data proves the data follow the physics model that is exponential, not linear, and that e-fold time equals residence time.
“I don’t see how you jump from a residence time of 4 years for all CO2 to a residence time of 16.5 years to explain the 14C curve. The absorption of 14CO2 by oceans and plants is somewhat slower than for 12CO2, but that is in the % range, not a fourfold.”
I start with 16.5 years for 14CO2 because that matches the data. Then I use 4 years for 12CO2 because IPCC uses 4 years which it calculates by dividing 400 ppm by the inflow of about 100 ppm/year. So, ask IPCC that question.
I don’t care what the 12CO2 residence time is, so long as it is less than 16.5 years. The physics model ratios are independent of residence time, and that conclusion proves the IPCC model is wrong.
“Moreover, the 14C decay rate in the ocean surface and vegetation follows the atmosphere with only a few years delay. Thus, where is your 16.5 years decay rate based on and why not 4 years?”
My 16.5 years residence time for 14CO2 is a direct result of the 14C data. Data always prevails over theory.
“If you take the pre-industrial 13C/12C ratio as base, and a constant exchange with the deep oceans, then the current atmosphere contains about 10% human CO2, way above the physics model…”
Not true. The current atmosphere contains about 4.5 percent human CO2 because human CO2 is about 4.5 percent of the inflow and human CO2 flows out of the atmosphere just as natural CO2 flows out of the atmosphere.
The exchange rate with the deep ocean is irrelevant to the argument because the only thing that matters is the 13C/14C ratio in the ocean surface the sends CO2 to the atmosphere.
“Fig.7 shows the 13C/12C ratio according to the IPCC model, if all original human CO2 still resides in the atmosphere, but 2/3 of that is already replaced by deep ocean CO2 at a higher 13C/12C ratio, thus even the Bern model gives about the right answer on that point: about 0.21 decrease in ratio.”
The “higher CO2 ratio” from the ocean sets the natural 13C balance level. Fig. 7 shows the deviation from the natural balance level, and it includes all effects that set the balance level. The data do not reject the physics model. Therefore, the 13C data do not prove the IPCC claim that human CO2 caused all the increase in atmospheric CO2 above 280 ppm.
Thank you for your challenges.
Dear Dr. Ed,
There is no residence time of 50 years in the data.
There is:
Based on the definition of a linear decay rate of any process, the e-fold decay rate = disturbance / effect.
In this case, the disturbance is the extra CO2 pressure above the dynamic equilibrium for the current average ocean surface temperature, according to Henry’s law for the solubility of CO2 in seawater with temperature. The effect is the net sink rate, that is human emissions minus observed increase in the atmosphere.
In 1959: +25 ppmv, 0.5 ppmv/year, 50 years, half life time 34.7 years.
In 1988: +60 ppmv, 1.13 ppmv/year, 53 years, half life time 36.8 years.
In 2012: +110 ppmv / 2.15 ppmv/year = 51.2 years, half life time of 35.5 years.
Looks like a very simple, linear decay rate to me.
We can plot that effect over the past 60 years of good data:
http://www.ferdinand-engelbeen.be/klimaat/klim_img/dco2_em2B.jpg
Where the calculated increase of CO2 (human emissions minus calculated sink rate with a decay rate of ~50 years) is midst the “noise” caused by Pinatubo, El Niño,…
The 14C data prove the 2.5 ppmv/year is not good data.
Sorry? Data are data, as good or bad as the measurements are. All what the 14C data prove is that the decay rate of 14CO2 is different than for 12CO2. As said before, that is because the CO2 that returns from the deep oceans is firmly depleted in 14C.
dL/dt = Inflow – Outflow
Agreed. In this case:
dL/dt = natural inflow + human inflow – natural outflow
In all past 60 years, natural outflow was larger than natural inflow, thus the mass balance shows that the human inflow of 1 – 4.5 ppmv/year is fully responsible for most of the 0.5 – 2.5 ppmv increase over the same period…
Simple mass balance, nothing to do with the IPCC’s Bern model.
the 14C data proves the data follow the physics model that is exponential, not linear, and that e-fold time equals residence time.
The decay is exponential, but the response of the sinks is in linear ratio with the extra CO2 pressure in the atmosphere. The latter gives a “residence” time which is in fact a change rate for any disturbance to any process in dynamic equilibrium. That is not an exchange rate, which is what a residence time is by definition.
I start with 16.5 years for 14CO2 because that matches the data. Then I use 4 years for 12CO2 because IPCC uses 4 years which it calculates by dividing 400 ppm by the inflow of about 100 ppm/year. So, ask IPCC that question.
Sorry? Either use the a 16.5 years decay rate for 14CO2 and a 50 years decay rate for 12CO2 (which also matches the data for the 12CO2 decay), or use the 4 years “residence time” in both cases. The IPCC doesn’t use the 4 years residence time, as that has zero influence on the CO2 level in the atmosphere: that is exchange, not change. Which doesn’t imply that the Bern model is right. Until now, the 12CO2 decay rate is linear without any trace of saturation that the Bern model implies.
The exchange rate with the deep ocean is irrelevant
Both ocean surface and vegetation show a rapid exchange of CO2 with the atmosphere and any change in 14C/12C or 13C/12C ratio is rapidly distributed over these three reservoirs. The deep oceans exchanges are a source of 13C-rich and 14C-poor CO2, which changes the ratio in the atmosphere over longer periods, thus “dilute” the “human fingerprint”. That is very relevant.
The data do not reject the physics model.
No, but don’t reject the IPCC’s Bern model either. Your graph for the IPCC shows the effect on the 13C/12C ratio if all human CO2 (as molecules) still was in the atmosphere, while the exchange with the deep oceans has already replaced 2/3 of these molecules with CO2 from the deep oceans, thus only 1/3 of the original molecules but 100% of the increase in mass is from human origin…
Figure 5 of the paper suggests that once CO2 reaches 410 ppm, outflows will equal inflows, and balance will be achieved. Recently, atmospheric CO2 reached 420 ppm at Mauna Loa. There also is no evidence that the long-term ongoing increase has ended.
What explains the gap between modeled estimate (your “physics model”) and actual measurements?
Thanks.
Don,
Berry’s Figure 5 (above) is about the IPCC’s Bern Model which Berry says is wrong. So,
What explains the purpose of your question which has no relationship to reality?
Thanks.
“Cawley (2011) argues the ratio of human to natural CO2 in the atmosphere is a function of residence time. Equation (3) shows the ratio is independent of residence time.
Cawley’s Eqs. (3), (4), and (5) incorrectly assume that outflow depends upon its value at time zero. ”
This is factually incorrect. F_e^0 represents the outflow part steady state exchange flux between the atmosphere and the oceans and terrestrial biosphere, not it’s value at time zero. We know this steady state exchange flux exists. The most easy to understand part is the exchange flux with terrestrial plants. The plants seasonally take in CO2 for photosynthesis and subsequent primary production (e.g. growing leaves) and then emit it seasonally via decay (including soil respiration). So we know that there is a steady state exchange flux and it is that which causes residence time and adjustment time to be different. If you don’t include this in your model, then your model does not represent the actual carbon cycle as a fundamental component is missing.
“His Eqs. (7) and (8) incorrectly model human and natural CO2 differently. Therefore, all Cawley’s conclusions are wrong.”
This is factually incorrect. Both natural and anthropogenic carbon are removed according to the same constant F_e. If the physical processes taking CO2 out of the atmosphere make no distinction between anthropogenic and natural CO2, then that is essentially picking a molecule at random each time. The probability for anthropogenic carbon is then C_A/C and for natural carbon C_N/C. So in order to NOT treat anthropogenic and natural carbon differently, you need one equation for each, accounting for the difference in their atmospheric masses (mixing ratios). The only other difference is that for natural carbon there is F_i^0, which represents the influx component of the steady state exchange, which as I have already pointed out we know to exist, so if your model doesn’t include it, it doesn’t correctly represent the carbon cycle.
The basic point of my paper is that to understand the difference between residence time and adjustment time, you need to consider the effects of the steady state exchange of CO2 between the atmosphere, oceans and terrestrial biosphere. If you don’t include this steady state exchange flux, you will make exactly the same mistake that Prof. Essenhigh did.
Dear Gavin,
First, so I don’t have to repeat myself, I refer readers to my reply to your previous comment here: https://edberry.com/blog/climate-physics/agw-hypothesis/my-poster-presentation-for-the-ams-annual-meeting-jan-8-2019/#comment-51532
Second, my physics model fully explains how CO2 flows through the atmosphere. Your model does not. Your model relies on a “steady state exchange flux” which shows you do not understand the physics.
Third, you inserted your “steady state exchange flux” in the wrong place in your math. Therefore, all your conclusions are wrong.
I note that you evade the point that you misrepresented my paper. My paper does not treat anthropogenic and natural CO2 differently. You assert that the “steady state flux is inserted in the wrong place in the math, but that is just an unsupported assertion, you haven’t actually shown it. Thus you are evading the technical criticism again. I don’t think I will bother any further, but don’t say the errors haven’t been pointed out to you. They have, but you have just ignored them.
Dear Gavin,
You wrote in your previous comment above:
“This is factually incorrect. F_e^0 represents the outflow part steady state exchange flux between the atmosphere and the oceans and terrestrial biosphere, not it’s value at time zero. We know this steady state exchange flux exists.”
Yes, it exists but you don’t know why it exists.
Your Eq. (3) without the F0e agrees with the physics model because your ke = 1/Te.
You have incorrectly added the steady-state outflow F0e to your Eq. (3) because your keC is the source of that steady-state outflow. So, you have included the steady-state outflow twice. Your F0e does not exist by itself. It exists only because your C (the level of atmospheric CO2) drives it.
OK, I will revise my comment about your F0e being a flow at time zero, although it is a flow at time zero before you begin to account for the outflow caused by the level C.
Nevertheless, your Eqs. (3), (4), (5), and your equation after (5) are still wrong because they should not include your F0e.
Your whole paper is wrong because of this error. Finally, your paper does not prove in any way that human CO2 caused all the increase of atmospheric CO2 above the IPCC-claimed 280 ppm in 1750.
Dr Ed,
The following paper may be of interest to you:-
Fergusson, G.J. 1958. Reduction of Atmospheric Radiocarbon Concentration by Fossil Fuel Carbon Dioxide and the Mean Life of Carbon Dioxide in the Atmosphere. Proceedings of the Royal Society of London. Series A, Mathematical and Physical Sciences. Vol. 243, No. 1235 (Feb. 11, 1958), pp. 561-574 (14 pages).
https://www.jstor.org/stable/100372?seq=1#page_scan_tab_contents
H/T TdeF on Jonova’s Blog
http://joannenova.com.au/2018/12/midweek-unthreaded-53/#comment-2086709
Your article provide several links, also to Harde 2017a and Harde 2017b. However, both produce the Harde Reply, where the first is supposed to link to the original Harde paper? It is on your site, as Google was able to find it.
Dear Ihans, Thank you for bringing this to my attention. I believe these links are now fixed.
“There is no tolerance in Kohler’s world for a contradictory opinion”
And that was shared by the publishers as well.
“Through working with the Publisher and in co-operation with the Elsevier’s Experts in Publication Ethics, we have now inspected all relevant documents, including reviews of the initial paper by Harde (2017) and the now-published Comment by Köhler et al. (2018) and the now-rejected Reply by Harde.”
https://www.sciencedirect.com/science/article/pii/S0921818117306586
Dear Marcus, that is my point. Kohler’s world and Elsevier’s world are one and the same. What does that tell us about so-called “peer-reviewed” publications?
You are slightly correct in regards to the first part. The world that Kohler and Elsevier is in samoe aspect on and the same – it is called Science. Now, Elsevier might be questioned and as You probably know many institutions have left Elsevier.
And it tells us quite a lot regarding peer review, it will always be an integrated part of the scientific community. That is why it was so clear that the process failed when publishing Harde 2017.
Dear Marcus, As my paper explains, Harde’s paper is correct and the criticism by Kohler is incorrect. Forget who did the peer review. Just follow the science.
Liang et al., 2017
https://www.nature.com/articles/s41598-017-12774-w
“Here, we analyze Δ17O data from four places (Taipei, Taiwan; South China Sea; La Jolla, United States; Jerusalem, Israel) in the northern hemisphere (with a total of 455 measurements) and find a rather narrow range (0.326 ± 0.005‰). A conservative estimate places a lower limit of 345 ± 70 PgC year−1 on the cycling flux between the terrestrial biosphere and atmosphere and infers a residence time of CO2 of 1.9 ± 0.3 years (upper limit) in the atmosphere.”
The weakness of your paper is not in its substance, but its references.
It is unlikely that a scholarly journal will agree to publish a paper that lists blog entries (i.e., from WattsUpWithThat) as sources.
And even if a journal does accept this version as is, these citations will be the initial criticism lodged by those who would prefer to dismiss than to offer a substantive counter argument.
My suggestion would be to preemptively avoid these pitfalls and not give your opposition an easy “win”.
Dear Char, Thank you very much for your comment. I will proceed to remove such blog references. I do not need them. I only included them to show the work of others.
I’d be interested in your thoughts on this.
https://tambonthongchai.com/2018/12/19/co2responsiveness/
Basically, it seems to be saying that the human contribution to atmospheric CO2 is so little as to be undetectable, statistically.
Thanks
H/T – John Ray’s excellent “greenie watch” blog.
Dear Yonason, The paper you linked is a good paper. It shows the increase in atmospheric CO2 does not correlate with human CO2 emissions. It shows the corresponding overall increases of human emissions with CO2 level does not prove human emissions caused the increase in the level. That is why it is necessary to detrend time series data before calculating correlations.
The paper references several papers by Munshi. My paper references the most recent paper by Munshi. Munshi has done more than anyone else on these statistical correlations.
Thanks for that feedback.
I have a few questions on Te:
You calculate Te and assume it is constant at equilibrium as well as at non-equilibrium, right?
Te should be calculated and valid at the equilibrium , right? What if 400 ppm is not an equilibrium? It definitely doesn’t seem like equilibrium since the level changes by some 3 ppm per year?
Now you calculate Te at 400. What If You’d calculated Te at 280 ppm and assume that is the equilibrium You would get 275 as the natural level instead of 392?
You assume the same Te is valid for both natural and human emission, why?
Te is dependent on the partial pressure , right? shouldn’t the partial pressure of the human emission be much lower and thus the Teh be much larger?
BR,
Gunnar
Dear
Gunnar, Thank you for your comment.
My first step was to assume Te both at and not at equilibrium. The physics model successfully replicated the 14C data using Te = constant. That did not have to happen. It could have turned out that Te changed from 1970 to 2014. So, the successful replication means Te was constant over this interval, and the interval began with 14C very far from its balance level and ended with 14C close to its balance level. Therefore, my assumption was correct.
We can calculate Te = Level / Inflow = 400 ppm / 100 ppm per year = 4 years.
That is an approximation because, as you point out, the level may not be at its balance level. Also, IPCC says its inflow numbers may be off by 20 percent.
The 14C data are much more accurate. So, the Te = 16.5 years for 14CO2 is a pretty good number. This also tells us the Te for 12CO2 will be a much smaller number and be a constant since 1970.
The reality is the level is increasing at an almost constant rate, as you note. This means the balance level is also increasing and it leads the level upward. If Te = 4 years then the level will get (1 – 1/e) closer to its balance level every 4 years. So, the level lags behind the increasing balance level by about 10 years.
The physics model tells us Inflow sets balance level: Lb = Inflow * Te
The 14C data strongly suggest that Te has remained constant from well before 1970, maybe since 1750. If this is so, then the reason the balance level was about 280 in 1750 was that inflow in 1750 was less than present inflow. Which means the reason the level has increased is that inflow has increased.
Te is the same for human and natural CO2 because their CO2 molecules are identical.
Partial pressure is proportional to level. The ratio of human to natural balance levels is shown in Eq. (3) in section 3.2 to be 4.5 percent. This ratio is independent of Te.
On April 1, 2019, the AJCC sent me the following email:
Dear Dr. Edwin Berry,
On behalf of the American Journal of Climate Change (AJCC) Editorial Board, we are sorry to inform you that your manuscript is not accepted by our journal. The referees’ comments are as follows:
Paper ID: 2360718
Paper Title: There are no cumulative carbon emissions
Comments:
The conclusion of this paper is completely opposite to the consensus of the academic community.
After careful consideration, American Journal of Climate Change might not be an appropriate journal for its publication. You may submit the manuscript to other journals where you have a better opportunity to reach a more appropriate readership.
Thank you for considering American Journal of Climate Change for the publication of your research. We hope the outcome of this specific submission will not discourage you from the submission of future manuscripts.
Please feel free to ask us if you have any question.
Best regards,
Melissa Luo
Editorial Assistant of AJCC
Scientific Research Publishing
Email: ajcc@scirp.org
No discussion. No reviewers comments. No logic. No integrity?
My skeptic friends deny the existence of publishers bias in the climate change science world. They respond to my links to this site and others with “why doesn’t he just publish it if it is right and be the hero? There must be good reason if the major journals won’t publish it”
Please keep trying Dr. Ed.
How did the Ronan meeting go?
Richard Courtney reported on a public email today that he was one of the reviewers of my paper and he recommended its publication.
On that score, one will always be able to have a consensus on anything. The method is as follows: invite opinion or research on any subject on which one has a strong opinion. Shoot, or shoot down, any opinion or research which disagrees. After a few years of paying handsomely for the ‘right’ opinion and research, a formidable body of opinion and research is beginning to form a consensus. Just keep shooting down any who disagrees. Soon nobody will disagree.
“The conclusion of this paper is completely opposite to the consensus of the academic community.” -Climate Journal
“Why 100? If I were wrong, one would have been enough.” -Einstein, in response to the book produced under the 3rd Reich: “Hundred Authors Against Einstein”
This seems to be an established pattern of the climate enterprise.
Even more disgraceful was the treatment of Harde, for whom even a rebuttal
of a published criticism was muzzled. If you examine Harde’s rebuttal,
it’s pretty clear why it had to be muzzled. Were the IPCC errors which
were exposed there to become common knowledge, the climate enterprise,
which no doubt generates millions for the publication industry,
would be destroyed.
https://hhgpc0.wixsite.com/harde-2017-censored
Dr. Ed should copy the treatment of his material to Professor Happer.
If President Trump ever gets off his laurels, the corruption and obstruction
of scientific communication will have to be fixed. Otherwise, public policy
concerning climate, which is allegedly predicated on science,
will be dictated by a self-perpetuating consensus.
Since industrialisation, the level of CO2 in the atmosphere has risen from 280ppm to 412ppm: 45%. This rise, and increasing acidification of the oceans, is entirely accounted for by human activity, principally the burning of fossil fuels.
The level of CO2 in the atmosphere is measured. There can be no doubt the increase recently is real. No matter how “neat” a theory, if it conflicts with reality it is wrong. Wrong-wrong-wrong.
Dear Dennis,
First, since the annual correlation between human emissions and change in atmospheric CO2 is ZERO (as shown by Munshi) then the rise in atmospheric CO2 is not the result of human CO2 emissions.
Second, to get the right answers in science, we must follow the scientific method: If a theory makes a wrong prediction then that theory is wrong. The IPCC theory that human CO2 causes the rise in atmospheric CO2 makes many wrong predictions. So, it is wrong.
The only theory that makes correct predictions is the theory that natural CO2 emissions have increased since 1750 enough to account for all the increase in atmospheric CO2 since 1750 except for the very small addition caused by human CO2.
Why pick a time scale of one year for your “non-correlation”? Why not one day, or one second? One hundred years?
Here is the science:
https://climate.nasa.gov/vital-signs/carbon-dioxide/
The scientific method is what the global community of scientists say it is, not some “dictionary” definition. The science is endorsed by every scientific institution (like NASA and NOAA) and scientific society on the planet, including the Royal Society, National Academy of Sciences, American Association for the Advancement of Science, American Physical Society, American Chemical Society, American Statistical Association. Are you suggesting these scientists don’t understand science? Or a conspiracy?
Looks to me just like a very powerful consensus. Based on a longstanding understanding of the science, starting with Fourier in 1824, who realised Earth was warmer than its distance from the Sun would indicate, Tyndall, who showed CO2 “trapped” heat in 1859, and Arrhenius who in 1896 calculated how much the temperature would rise for a doubling of CO2: 4-6C.
Arrhenius thought it would take a long time for CO2 to double. He had no idea wealthy humans would burn so much fossil fuel in such a short time.
https://www.epa.gov/ghgemissions/global-greenhouse-gas-emissions-data
Of course your work is grasped, like a straw, by climate deniers and journals decline to print it, even the journals without the expertise to judge it.
However, I believe you are free to try your ideas at .
Dear Dennis,
May I ask what is your educational background?
Your comment sounds like you have never learned the scientific method, never studied the philosophy of science, and don’t comprehend in the slightest how true science works.
Of course, like in religion, you are free to express your opinions, but they have no meaning in science.
The idea of arguing truth based upon votes went out in Aristotle’s time. The idea that the leaders of professional societies determine the scientific method is like proposing the Pope was correct and Galileo was wrong.
So, let’s go back to your education and experience in science. Please give a summary of what assumptions you bring with you when you attempt to discuss climate science.
“The scientific method is what the global community of scientists say it is… Looks to me like a very powerful consensus.”
Consensus is the instrument of politicians, not scientists.
It’s difficult to fathom how any serious person with even superficial knowledge of scientific history, notably of how physics evolved during the last 150 years, could believe such nonsense. See, for example:
http://www.feynmanlectures.caltech.edu/I_40.html Sec. 40-6
Play the ball Ed, not the man. Answer the question.
You won’t find a correlation because you are looking at too short of a time period. The anthropogenic contribution is swamped by seasonal CO2 flux and potential ocean buffering.
Dear Simon,
Both natural and human CO2 has an annual cycle. We have data on annual human CO2 emissions. We have annual data at many places for the CO2 in the atmosphere.
If human CO2 were indeed a significant factor (100% according to the IPCC) then we should see an annual correlation between human inflow and annual increase. We don’t need 1 but we need something meaningful greater than zero.
But the correlation is ZERO! That is the scientific standard for no cause-effect.
Your hand-waving argument holds no water in science. Clearly, you are willing to toss science out the window just to maintain your “belief” that human CO2 is the major cause of the increase in atmospheric CO2.
To support your theory, you need to produce evidence of where the human CO2 hides from all the CO2 data stations around the world. Such data does not exist.
To be a scientist, you need to follow the methods of science. In the face of a zero correlation, you must take the position of no cause-effect, which is the default position.
Dear Simon,
I will expand on my comment above. The burden of proof is on those who propose a theory to produce evidence to support their theory.
If the IPCC wants to support its theory, it should begin with doing correlation calculations as Munshi did. First, they must detrend the time-series. Then, they can do correlations for more than one year, like 2, 3, or 4-year intervals. I don’t know of anyone that has done that.
Given the IPCC has unlimited money to do this stuff, it makes one wonder why they have not done this. Or maybe they have, and they found out that the correlations for these other intervals are also zero. So, they don’t want to present the data.
Meanwhile, lacking some proof of a correlation, there is only one valid scientific position: Human CO2 does not cause the rise in atmospheric CO2, which means nature is causing the rise.
“Then, they can do correlations for more than one year, like 2, 3, or 4-year intervals. I don’t know of anyone that has done that. ”
Munshi has done just that (https://tambonthongchai.com/2018/12/19/co2responsiveness/)
still no response in the atmospheric content to changes in human emissions.
The disconnect between man’s CO2 emissions and atmospheric CO2
(which Munshi shows are uncorrelated) is what Salby and Harde showed
from “net emission” – what produces the annual increase of atmospheric CO2.
Since satellites were invented, man’s emissions increased by more than 50%.
But net emission (man’s emissions plus natural emissions) didn’t increase at all.
Man’s emissions therefore cannot be a major contributor to net emission.
And, if they are not responsible for net emission,
man’s emissions cannot be the cause of increased atmospheric CO2.
https://edberry.com/blog/climate-physics/agw-hypothesis/what-is-really-behind-the-increase-in-atmospheric-co2/ at [31:00]
Dear Ed,
Your above comment that mentions me indicates that you – as all recipients of the “public email” – have a copy of the review comments which I provided for and to AJCC on 9 March and which AJCC acknowledged receipt on the same day.
I could copy those review comments to here. However, this is your blog and, therefore, it is for you to decide what does and does not appear here. Hence, I write this post to say you have my complete permission to display my review comments here if you provide them in full: excerpts could mislead by lack of context.
I hope this is helpful.
Richard
Dear Richard,
You are welcome to copy your review comments here as you wish.
Ed
Review comments from Richard S Courtney of the paper titled
“There are no cumulative carbon emissions” (Paper ID: 2360718)
which has been submitted for publication.
1. Recommendations.
The submitted paper deserves publication because it contains important and novel findings.
However, the paper’s title is misleading and the published title should be altered to be, for example, ‘Anthropogenic emissions are assessed to contribute little to observed changes in atmospheric CO2 concentration’.
2. Basic assessment.
The paper builds on the sound, adequate and accurately reported information referenced in the paper’s bibliography.
The paper provides a reasoned argument that it provides a better (i.e. empirically more accurate) model of the cause(s) of observed changes in atmospheric CO2 concentration than the Bern model used by the UN IPCC. Of itself, that finding is not surprising because Rorsch et al (2005) demonstrated that several reasons for the recent rise in atmospheric CO2 concentration can be modeled to match the empirical data with high accuracy. That paper provided six such models with three of them assuming a significant anthropogenic contribution to the cause and the other three assuming no significant anthropogenic contribution to the cause. And each of those models matches the empirical data without use of any ‘fiddle-factor’ such as the ‘5-year smoothing’ the IPCC uses to get its Bern model to agree with the empirical data. So, whichever of those models one chooses to champion then there is a 5:1 probability that the choice is wrong, and other models are probably also possible.
Courtney (2009) argues that the findings of Rorsch et al are explicable by the carbon cycle requiring decades to fully adjust to any alteration to its equilibrium state. Such changes would occur as result of, for example, global temperature change. He argues that the short term CO2 sequestration processes can sequester all CO2 to the air from each year but some processes of the carbon cycle have rate constants of years and decades so the carbon cycle system takes decades to fully adjust to any change.
Parsimony suggests that the “Simple Physics” model in the paper that is here being reviewed can be considered to be the most valid of the many possible empirical models because it makes only one assumption; viz.
“outflow of CO2 from the atmosphere is proportional to atmospheric CO2 concentration|”.
And that assumption concurs with the explanation of Courtney (2009).
But the UN IPCC persists in using its Bern Model so the paper here being reviewed includes a report of the failings of that model.
This is important because the UN IPCC persists in citing projections of its Bern Model and in 2001 the UN IPCC correctly reported in its Third Assessment Report (TAR: Chapter 2 from Working Group 3) that “no systematic analysis has published on the relationship between mitigation and baseline scenarios” for CO2.
There is still no systematic analysis of the relationship between such scenarios but the “Simple Physics” model of the paper here being reviewed is a significant step towards the possibility of such an analysis.
Paper Review Guideline
Paper ID: 2360718
Paper Title: There are no cumulative carbon emissions
Part 1: Manuscript Rating:
Criteria Score (1-10 points)
Fitness for Journal 10
Novelty 10
Creativity 9
Technical Strength 10
Language 9
Average
Part 2: Overall Recommendation (Color the choice in Yellow)
A. Published as it is but with an amended title (This was coloured yellow)
B. Accept For Publication
C. Reconsider after major revision
D. Rejected
Censorship is a great thing because it does not allow contrary information to disturb the peace of those who have their minds made up. But of course there is a downside; as someone said, censorship is the child of fear and the father of ignorance. However these days, with the internet, censorship is a ship that leaks.
” But the journal did not forward any evidence that there is an error in my paper and did not acknowledge that my paper proves the “consensus” is wrong. So, if it is unacceptable to publish a paper that contradicts the “consensus” how can there be progress in science?”
It occurred to me that there may be an effort to censor or at least postpone your paper to keep it out of consideration for the next IPCC report. They have to consider Harde 2017 but without any other supporting papers and with Kohler 2017 refuting it unopposed ( by journal censoring Harde’s reply) the IPCC can get several more years of cash and control out of their lies. No mater their motive I hope they don’t succeed and you can prevail in this effort to reveal the truth that simultaneously display their errors.
I see at WUWT that they are inviting reviewers. (https://wattsupwiththat.com/2019/05/04/register-to-be-a-reviewer-for-ipcc-sixth-assessment-climate-report-ar6/ )
I hope Drs. Berry, Harde, Salby and Courtney will sign up to comment on the attribution chapter.
To Ed Berry.
I really like your Physics Model to explain the flow of CO2 through the atmosphere and how much is derived from nature and man made. It is simple enough so that even a lay person can understand it.
It also confirms my thoughts on atmospheric methane levels derived from cows where I independently arrived at the same balance equation. Balance Level = Inflow x Te or Residence Time. Residence time is determined by the rate of oxidation of CH4 in the atmosphere, between 8 to 9 years (according to varied sources). It is not a difficult concept to arrive at.
Now I was wondering if it would be possible to construct a Simple Physics Model of the flow of energy in the Climate System. Could this model then be used to determine the effect of increasing levels of atmospheric CO2.
really late to the thread here. How do i obtain a copy of the ‘Berry’ excel workbook that Ed refers to?
Go here:
https://edberry.com/blog/climate/climate-physics/preprint3/
Then look for Excel link just below the PDF showing Preprint #3.