by Edwin X Berry, PhD, Theoretical Physics, CCM
Ed Berry LLC, Bigfork, Montana
To read key referenced papers:
- CO2 Coalition paper
- Dia Ato paper
- Bernard Robbins paper
- Eike Roth paper
Click here
Responsiveness of Atmospheric CO2 to Fossil Fuel Emissins
by Jamal Munshi
Ferdinand Engelbeen says Jamal Munshi has not proved absence of correlation.
What do you think? Add your comment below.
A Thermal Acid Calcification Cause for Seasonal Oscillations in the Increasing Keeling Curve
Download this Excel file here: https://edberry.com/Excel-File
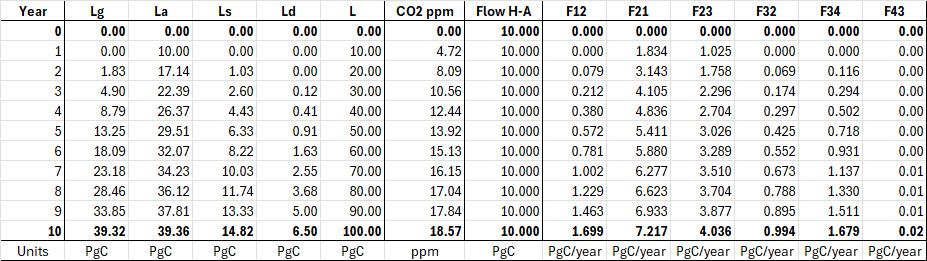
Here is table “Berry Carbon Flow Test” for discussion in our comments.
I request Ferdinand and anyone else who is contesting my calcuations to present your calculations for comparison.
We assume that the natural carbon cycle is at constant levels as shown in Figure 3.
With that information, we insert human carbon into the atmosphere at a constant rate of 10 PgC per year. Then we calculate annual time steps to see how much human carbon ends up in each reservoir each year.
This simple calculation is a way to compare our calculations because we keep human carbon inflow constant for each year.
The years run from zero to ten. All the L data are in PgC, and flow data are in PgC/Year.
Lg = land, La = atmosphere, Ls = surface ocean, Ld = deep ocean, L is the total PgC in the carbon cycle for each year. Ntice L increases by 10 PgC each year.
The CO2 ppm column simply converts the PgC in La to ppm.
Here’s how it works.
Year 0: 10 PgC is added to La, but you don’t see it until the beginning of Year 1.
Year 1: the 10 PgC in La produces outflows to Lg and Ls. We see the result in Year 2.
Year 2: the outflows from La have moved some carbon to Lg and Ls. Etc.
Notice that as La gets more PgC, its Outflow to Lg and Ls increase, etc.
While La increased by 7.14 PgC from Year 1 to Year 2, it increased by only 1.49 PgC from Year 9 to Year 10.
Also notice that as Lg and Ls get more carbon, they send carbon back to La.
Adjustment, Residence, E-time Compared
IPCC’s response times fail physics
Physics e-time has a precise definition. The IPCC times do not. In summary:
- Physics: e-time is the time for the level to move (1 – 1/e) of the distance to its balance level.
- IPCC: adjustment time is the time for the level to “substantially recover” from a perturbation.
- IPCC: residence time is the average time a CO2 molecule stays in the atmosphere.
IPCC defines “adjustment time (Ta)” as:
The time-scale characterising the decay of an instantaneous pulse input into the reservoir.
Cawley defines “adjustment time (Ta)” as:
The time taken for the atmospheric CO2 concentration to substantially recover towards its original concentration following a perturbation.
The word “substantially” is imprecise.
Cawley follows IPCC to define “residence time (Tr)” as:
The average length of time a molecule of CO2 remains in the atmosphere before being taken up by the oceans or terrestrial biosphere.
In summary, IPCC uses two different response times where it should use only e-time:
- When the level is far from its balance level (which can be zero), IPCC thinks e-time is an adjustment time because the level is moving rapidly toward its balance level.
- When the level is close to its balance level, IPCC thinks e-time is a residence time because “molecules” are flowing in and out with little change in level.
Figure A illustrates how e-time relates to IPCC’s adjustment and residence times.
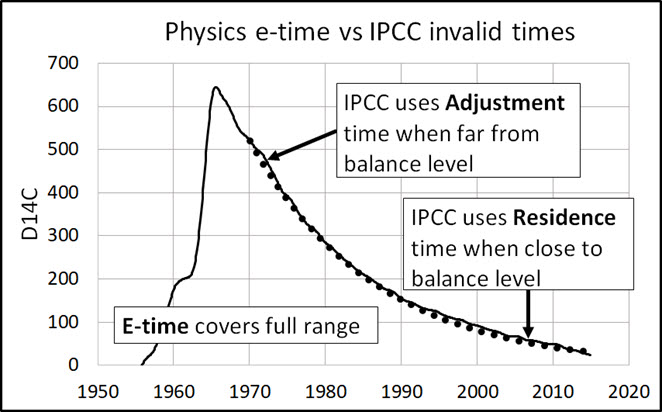
Figure A. E-time covers the full range of movement of level to a balance level. IPCC adjustment and residence times apply to only each end of the range.
IPCC, 2001: Working Group 1: The scientific basis. Appendix 1 – Glossary.
Lifetime
Lifetime is a general term used for various time-scales characterising the rate of processes affecting the concentration of trace gases. The following lifetimes may be distinguished:
Turnover time (T) is the ratio of the mass M of a reservoir (e.g., a gaseous compound in the atmosphere) and the total rate of removal S from the reservoir: T = M/S. For each removal process separate turnover times can be defined.
Adjustment time or response time (Ta) is the time-scale characterising the decay of an instantaneous pulse input into the reservoir. The term adjustment time is also used to characterise the adjustment of the mass of a reservoir following a step change in the source strength.
Half-life or decay constant is used to quantify a first-order exponential decay process.
The term lifetime is sometimes used, for simplicity, as a surrogate for adjustment time.
In simple cases, where the global removal of the compound is directly proportional to the total mass of the reservoir, the adjustment time equals the turnover time: T = Ta.
In more complicated cases, where several reservoirs are involved or where the removal is not proportional to the total mass, the equality T = Ta no longer holds.
→Carbon dioxide (CO2) is an extreme example. Its turnover time is only about 4 years because of the rapid exchange between atmosphere and the ocean and terrestrial biota.
However, a large part of that CO2 is returned to the atmosphere within a few years.
Thus, the adjustment time of CO2 in the atmosphere is actually determined by the rate of removal of carbon from the surface layer of the oceans into its deeper layers.
Although an approximate value of 100 years may be given for the adjustment time of CO2 in the atmosphere, the actual adjustment is faster initially and slower later on.
Two quick suggestions, before getting to the content at a later time:
1. Make sure the cover page is labelled as “First Draft”, so that it will be easy to distinguish from subsequent versions.
2. Include in the Introduction a URL link to the document you are countering, so your readers can compare it side-by-side with your own paper as they read your arguments.
Thanks for all your good work!
Hi Peter,
Thank you very much. You can see that this draft includes your suggestions.
Ed
Dr. Ed,
This page was linked to as a source for “Fig. 11” however, there are only 10 figures!
Also, the historic evidence is all we need to prove CO2 is NOT a climate change force!
Using the geologic evidence going back 550 million years, correlation coefficients can be computed for the relationship between CO2 and Climate (temp) and changing CO2 and changing Climate. The former calculates to 0.29 (uncorrelated). The latter to a mere 0.10 (highly uncorrelated).
No correlation means causation is impossible. Q.E.D.
I could care less about sinks. The measurement of C14 is absolute. If the 50% increase in CO2 was man made, the C14 concentration should be 33% lower today than it was in 1800. Sinks do not matter.
https://royalsocietypublishing.org/doi/10.1098/rspa.1958.0021
Has not been proven wrong. Pre hydrogen bomb the total CO2 emitted was 14% and it was measured at 2.03%+/-0.15%
Since then the atmopspheric testing of hydrogen bombs in 1965 doubled (atmospheric) C14. With a half life of 5740 years this has all gone in 2025. So all the CO2 from 1965 and before 1965 has gone.
And a perfect e-kt curve proves the Bern model is wrong . C14 cannot hide in 60 years, so there is only once place, the ocean. Dilution 50x.
As confirmation the current C14 level is now -2.03%+1/50 =0.0%.
https://i0.wp.com/eos.org/wp-content/uploads/2022/09/bomb-pulse-carbon-curve.png?w=1200&ssl=1
This is open and shut direct measurement. No models required.
(Not argument from coincidence from firn results in ice cores as used by Prof Happer)
The entire history of C14 from 1800 to 2025 is plain. And the horizontal asymptote at 0.0% dilution was expected.
As for C13, the dilution of -8 from the standard of -6 is only explained by ocean CO2 at -12 and not by fossil fuel CO2 at -24. I don’t like these indirect methods. Absolute measurement by radio(active) carbon dating is open and shut.
And the interesting result from Ferguson in 1958 is the question of whether the -2.03% was the static value has been settled. It is still -2.0% in 2025.
Another confirmation is the average age of sea water at -600years, debunking the attempt to argue a surface ocean. 600 years is very close to 50x the e-kt half life of 10 years as agreed in the 36 papers in table 1 of this recent document
https://www.mdpi.com/1099-4300/25/2/384#:~:text=The%20residence%20time%20in%20the,dioxide%20mass%20of%203403%20Gt.
In which he concludes
(1) The adjustment time is never larger than the residence time and is less than 5 years.
(2) The idea of the atmosphere being stable at 280 ppm in pre-industrial times is untenable.
(3) Nearly 90% of all anthropogenic carbon dioxide has already been removed from the atmosphere.
but I would correct (3) to 98%. Only this explains and perfectly explains the fact that C14 levels today are exactly what they were in 1800.
Matthew,
You are not distinguishing between atmospheric C14 measured as a ratio to C12 (“delta C14”), and atmospheric C14 concentration. The former has returned to near pre-bomb test values; the latter most certainly has not. See https://www.cambridge.org/core/services/aop-cambridge-core/content/view/193CDF1F705B269BC975AF178CEF1AC3/S0033822224000274a.pdf/discussion-presentation-of-atmospheric-14co2-data.pdf. You will be able to understand the detailed behavior of the two measures in Figure 1 (before bomb tests) and Figure 2 (after), only if you appreciate that when an isotopic gradient exists between two reservoirs that are exchanging carbon, the mixing tends to reduce the gradient and leads to a net transfer of C14 towards the reservoir with the lower delta C14 value. Nature is subtle. Even before the bomb tests, C14 free CO2 added to the atmosphere by fossil fuel burning ended up INCREASING the C14 concentration in the atmosphere by this mechanism! Of course, at the same time it lowered the delta C14 value.
Because of this mixing, the present composition of the atmosphere is an unreliable indicator of the source of the CO2 increase.
This is an attempt to explain TOTAL C14 something which is very different and nothing to do with the basic concept of radio(active) CO2 dating. The very concept of the equilibrium in which the ratio of C14/C12 is a constant is being attacked as wrong even prior to 1965! That’s the end of radio carbon dating then.
What was true prior to 1965 is still true. C14/C12 in 1958 proved the fossil fuel CO2 level was 2.03% +/-0.15%. At that point the growth in total atmospheric CO2 was 14%. If the source of the CO2 was fossil fuel without C14, the dilution MUST have been 14%. It was not.
The WHOLE POINT of radio carbon dating is that you measure the RATIO so that it is independent of fluctuations in total atmospheric CO2. It is only the ratio which matters. Total C14 in the atmosphere can go up and down as CO2 goes up and down. It’s irrelevant. With a half life of 5740 years, it is total C14 in the system which is constant. All sinks are relatively short term. CO2 in the atmosphere could double and C14 the atmosphere would double but the equilibrium ratio would remain unchanged.
Again I read your comments correctly, you are saying that Ferguson was wrong and fossil fuel CO2 was increasing the amount of C14 in the atmosphere ‘through this mechanism’. That’s rubbish.
The idea of an ‘isotopic gradient’ is rubbish. C14O2 is only one atom in a trillion. It cannot move independently of the C12O2 in which it is embedded. The difference in absorption of C14O2 and C12O2 is under 1% and it is accommodated in the calculation of delta.
It also does not explain the perfect e-kt behaviour in C14/C12 nor the horizontal asymptote of 0.0% in 2025. If you project these theories to 2025 they are incorrect.
C14O2 in the atmosphere was doubled in 1965. Ten half lives later 98% of all 1965 CO2 is now in the water and 98% of the extra C14O2 is in the ocean. The total then is -2.03%+1/50th = 0.03% in the ratio. It all fits perfectly.
These new theories of the independent behaviour of TOTAL C14 after the bomb blast need examination. I have seen a few now try to reproduce the C14/C12 bomb curve and the failure if you project past 2020.
I am amazed that such a simple concept is so hard for people.
I agree CO2 in and out Sets a balance that varies over the years however for me the argument is CO2 has a diminishing effect on heat as concentration increases. The only method of transferring energy through space is radiation and this decreases on a log base after the first 20ppm. It’s written up by the university of Pensylvania that over 340ppm no measurable heat was found, ergo more CO2 has an insignificant effect on temperature. That being so net zero will have no appreciable effect CO2 is not a problem. I understood from Prof Happer that CO2 has little effect as concentration increases. Perhaps his point is that even if man converts oils or coal any increase is without importance on Global temperatures?
I met Will Happer in Melbourne and made these arguments. He did not counter them, except to refer to ice cores. When pressed he said his view that the CO2 increase was man made was ‘personal’.
I thought it was political, a debate technique of concession and onto this area of expertise, proving the increase was inconsequential, limited and entirely beneficial. All well made and true points.
So I was surprised when he supported an attempt to prove the CO2 was man made. This was rubbish. And a negative on his overall wonderful contribution with the CO2 coalition to argue the massive benefits of CO2.
Another point he misses is the NASA greening. That firstly the CO2 14% increase between 1988 and 2014 was not only related to tree coverage, it exactly matched it. What this means is that the entire cash grab based on legislated carbon credits is nonsense. More CO2 means more trees.
But it was a big effort to make his world tour promoting his excellent work. I was just disappointed that the conceded the idea that CO2 was man made when that is so easily proven untrue in an open and shut C14 measurement. I can only conclude that even good physicists do not understand radio carbon dating. Or they are too anxious to show off their own fields of expertise.
I met with him too at his Melbourne talk. I concur.
2 typos–Pg 4 1st paragraph, Pg16 2nd to last paragraph.
Thanks for continuing to defend and explain your work. Until others point out logic or math flaws in your work it has to be reckoned with. I think your explanation of equations A,B,C,D could stand some work. I think CO2C correctly state that change in atmospheric CO2 equals inflow(N)+Inflow(H) – outflow(total) but uses N instead of total because there are no human sinks. Their error is thinking of them as sources and sinks and not flows . There are 2 sources (N) and (H) but there is no sink (H) so they leave it out and get it wrong.
Dear DMA,
Thank you for your point that I must improve my explanation of ABCD, etc. I will do that in my next draft.
Meanwhile, please help me find the two typos you found. (My addition of the Table of Contents inserted about one new page, so page numbers changed.)
Ed
Sorry I can’t spot them again. You probably got them in your review.
All this is very interesting however;
I am an Applied Physicist not a Theoretical one, I suggest that a much simpler approach is needed to convince the non-science population.
To disprove that CO2 caused warming all you need to do is look at the Ice core data and ask one very simple question.
If CO2 causes warming why on all cycles prior to the present; does temperature drop when CO2 is at its highest at the top of each curve?
The answer is also very simple; temperature rise causes CO2 rise by the heating of the oceans, where most of the world’s CO2 is dissolved. If that is true then manmade CO2 emissions are irrelevant.
When the oceans heat they also give off water vapour which increases cloud cover and that causes the cooling cycle. As the cooling progresses cloud cover decreases and eventually that causes another heating cycle.
Also CO2 contributes an insignificant amount to the Green House effect as the mechanism of absorption of radiation is via Atomic absorption (not thermal) this energy is re radiated by the CO2 atom again in a random direction, unless there is water vapour present the scattered radiation is not absorbed as thermal energy.
“To disprove that CO2 caused warming all you need to do is look at the”- many papers documenting a reduction in clouds during the modern warm period. Three of those papers concluded that all of modern warming can be explained by the increase in solar energy reaching the surface and heating the oceans to depth. All sky down welling IR has trended down also. Some negative feedback is preventing the clear sky increase in CO2’s 15 micron band from producing an enhanced greenhouse effect.
The ice core record is clear proof that CO2 doesn’t correlate to temperature other than as lagging indicator. That it is always at peak values when global cooling begins is proof it doesn’t have enough juice to overcome natural variability.
You asked for input.
1. Don’t spend so much time on Einstein etc. Those who will ever believe that a negative disproves the theory don’t need this.
2. Make your point about the source of CO2 but a. it grows food b. warmth is good for humans c. we’re coming out of an ice age and d. adapting and preparing is more effective than trying to change the whole climate. Don’t give up on these points in your preamble. Otherwise, to use your track team analogy, it’s like a horse race team giving up a jockey because they thinkbthey have a winning horse.
Didn’t Einstein’s Relativity prove that only natural causes and effects influence reality? The German romantics and their successors are attempting to impose the dialectic on empirical science. Locke et al disproved magic as an influence on reality and virtue signalling has no basis in fact. Einstein’s physics is the basis of the peer review process but computer modelling has lowered the standard of proof drastically.
Sorry to sound Luddite but observational physics doesn’t depend on an audience or a consensus.
Abstract
Some folks at a group called the CO2 Coalition (2024) say that the extra carbon dioxide (CO2) in the air comes mostly from human activities, like burning fuel. They call this idea Hypothesis 1, or H(1), and claim they have proof it’s true. But their argument doesn’t hold up because they messed up their math on how carbon moves around in nature, ignored studies that show their idea is wrong, and didn’t follow the basic rules of science. They also used shaky evidence.
A lot of people, including the UN’s climate group and many scientists, agree with the CO2 Coalition that humans are the main cause of rising CO2. They’ve got data and big names backing them up. But science isn’t about who’s loudest or has the most support—it’s about testing ideas to see if they’re wrong. And there’s evidence out there that shows H(1) isn’t correct.
This matters because a group called Our Children’s Trust is fighting in court to challenge President Trump’s climate decisions. They’re using the idea that humans cause most CO2 to push their case. If you support Trump’s climate policies, it’s good to know why this human-caused CO2 idea might not be right, so everyone can be on the same page defending his choices.
Dear Dr Berry,
Thank you for the opportunity to read your draft paper “CO₂ Coalition’s Not-So-Golden Science.” Your rigorous derivation and challenge to Hypothesis H1 present a valuable and much-needed correction to prevailing carbon cycle narratives. In the spirit of strengthening your already compelling argument, I would like to offer the following suggestions for improvement:
1. Clarify Derivations: Some of the core equations could benefit from step-by-step explanatory text or diagrams showing how the terms correspond to physical flows. A flowchart of reservoir dynamics would enhance accessibility for technically literate readers less familiar with differential models.
2. Include Empirical Comparisons: Integrating graphs that compare your model’s output to empirical records (such as the Mauna Loa CO₂ series) would help validate the model visually and reinforce the conclusion that human contributions are minor.
3. Address Isotopic Counterarguments: Given the frequent citation of δ¹³C and ¹⁴C evidence to support anthropogenic dominance, a short, direct rebuttal to these points within the main paper would anticipate criticism and strengthen the self-contained nature of the argument.
4. Neutral Language Tone: While the core message is strong, softening the tone of phrases such as “not-so-golden science” and “fatal error” in select areas could broaden your reach to readers who are open to your analysis but wary of rhetorical framing.
5. Define Key Terms Early: Introducing technical terms such as e-time, Hypothesis H1/H2, and inflow-outflow dynamics upfront would improve flow and prevent confusion as the argument progresses.
6. Strengthen Policy Relevance: The legal and regulatory implications, especially regarding the EPA’s findings and the Lighthizer case, are of high importance. Expanding this section to clearly show how disproving H1 undermines regulatory authority could add significant weight to your conclusions.
7. Offer Reproducibility Tools: Including a supplementary Python or Excel simulation would allow others to run the model themselves, increasing transparency and academic reach.
These suggestions are offered in support of your work and its contribution to restoring correct physical principles in climate-related modelling. I hope they are helpful as you refine and publish this important piece.
Kind regards,
Jack Miller
Hi Jack,
Thank you. I am now going through your suggestions, and I will update this draft accordingly.
Ed
CO2 did not remain at 280ppm until the early 1900s. CO2 rose to 450ppm and 500ppm on many occasions during the Holocene.
We concur with every scientific point made here by Dr Ed Berry, In addition we show from delta 13C measured data that the vast majority of CO2 emissions into the atmosphere have an ocean origin.
Additionally the Pinatubo experiment conducted by Bromley & Tamarkin published in their paper Bromley & Tamarkin 2022 demonstrated quite categorically that human emissions of CO2 are miniscule.
In separate papers Bromley also shows that it is Henry’s Law that controls atmospheric CO2 concentrations and that it is impossible for humans to control atmospheric CO2 concentrations.
All of this along with the 37 pages of references can be obtained in our recently published book:
Climate Truths
Dr Robert Ian Holmes and Brendan Godwin
http://www.climate-truths.com
We cite all of this good work of Dr Ed Berry in this book.
you should get a debate going on this on Whats up with That.
Hi Don,
Thanks, but I am not interested.
A year or so ago, the CO2 Coalition started such a “debate” on WUWT. The discussion became so crowded with nutcase comments that it was impossible to have a rational debate.
The only way to have a focused debate is here.
Ed,
1. I understand your intent with your equations (A) and (B), but your notation is poor. There are two different L (level) functions of time which you label through their arguments. It would be clearer to use different names for the functions, perhaps utilizing subscripts instead of inappropriately giving what is apparently the same function two different arguments. Clearer notation might have prevented your further confusion discussed below.
2. There are no errors in the CO2C’s bookkeeping or in that of mainstream climate science. They track total carbon levels, not “human” and “natural” carbon separately as you do, and they do so accurately. They do not say or imply that “human carbon” gets stuck in the atmosphere. The science is dead simple: when we put 100 units of carbon into the atmosphere it gains about 45 units and the rest flows into land/sea reservoirs. That is shown by the uncontroversial empirical fact that human emissions exceed the atmospheric accumulation rate.
3. Neither I nor any reputable scientist contests your conclusion that only a small fraction of the carbon atoms in the current atmosphere were once part of fossil fuel. But so what? The large two-way exchanges between the atmosphere and land/sea reservoirs mix the inventories in about a decade. Therefore you can’t tell the cause of the atmospheric carbon increase from its current composition. You can tell the cause by noting that land/sea carbon inventories have increased as well. The inventories that have decreased are the fossil fuel reserves.
Dear David,
Thank you for your comment.
1. I certainly agree that I must improve my explanation of CO2C’s carbon cycle error. I am working on that.
2. Indeed, CO2C, you, and others track the total carbon level. I am sure we agree that the total carbon level does not measure the individual human and natural carbon levels.
But we disagree on your claim,
“when we put 100 units of carbon into the atmosphere it gains about 45 units and the rest flows into land/sea reservoirs. That is shown by the uncontroversial empirical fact that human emissions exceed the atmospheric accumulation rate.”
That is where this debate must focus. I will revise my draft to address this issue I raise in 1.7 immediately thereafter 1.7.
3. The reason I mentioned the difference between IPCC’s fast and slow carbon cycles is because CO2C seem to have a difficult time trying to explain this difference.
3a. You bring up a second point in your claim “can’t tell the cause of the atmospheric carbon increase from its current composition.” I assume you are referring to my use of Delta14C to derive the relative amounts of human carbon in the atmosphere.
This is a point worth discussing, because I claim today’s Delta14C level is a result of the continuing inflow (and resulting outflow) of human and natural carbon, and these inflows set the balance levels of each component.
I see you raised the same issue with Matthew.
Ed
“The science is dead simple: when we put 100 units of carbon into the atmosphere it gains about 45 units and the rest flows into land/sea reservoirs. That is shown by the uncontroversial empirical fact that human emissions exceed the atmospheric accumulation rate.”
Emissions from many sources (termites, tropical ocean) exceed the annual accumulation. Your statement sits on an assumption that all natural emissions are constant and sinks are growing at a rate less than human emissions. That assumption is false. CO2 flow through the atmosphere is independent of its source. The quantity of CO2 in the atmosphere is controlled by natural forces, largely temperature, and the standard gas laws. Curtailing or increasing one minor source will induce an offset reaction in other sources. It is reasonable to treat any source by itself with flow characteristics the same as the total. Dr.Ed has done just that and his work shows that human emissions are only a small part of the rising CO2. The causes of the increase in atmospheric CO2 are changes in nature that allow the atmosphere to hold more.
DMA,
The sum of all natural CO2 emissions (including termites, tropical oceans, volcanoes, freshwater ponds, decaying vegetation…) is not well known. The sum of all natural CO2 absorption (vegetation growth, dissolution into seawater as dictated by Henry’s Law, ..) is also poorly known. Nevertheless we can rigorously and accurately compute the DIFFERENCE between all natural absorptions and all natural emissions, a quantity called “Net global uptake” in the literature. By carbon conservation, that difference must equal the quantity of “missing carbon”, the carbon that didn’t stay in the atmosphere after we put it there by burning fossil fuels. That carbon had to have gone somewhere, into one of the natural sinks. See for example Ballantyne, A. P. Alden, C.B., Miller, J.B., Tans, P.P. ,2012: Increase in observed net carbon dioxide uptake by land and oceans during the past 50 years, Nature, vol 488 pp 70-72. doi:10.1038/nature11299. They find that between 1960 and 2010:
Human emissions totaled 350 +or – Pg of carbon
Atmospheric accumulation was 158 + or – 2 PgC
Therefore by subtraction, ocean and terrestrial sinks took in 192 + or – 29 Pg of carbon.
(1 Pg = 1 billion metric tonnes. Note that the analysis applies to the carbon in CO2, not CO2 itself, because it is carbon that is conserved, not CO2.)
Ballantyne et al divide the data into decades and find that, like human emissions, net global uptake increased during those 50 years. You are correct that “increasing one minor source will induce an offset reaction in other sources.” You are also correct that natural forces have an effect. Net global uptake, while definitely positive in the 1990’s, was a bit lower than in neighboring decades. Ballantyne et al attribute that to the cooling effects of the Pinatubo eruption.
There is no assumption in this analysis that emissions are constant. There is no assumption that carbon from one source behaves differently than carbon from another. The only asymmetry in the analysis is that “human absorption” is taken as 0. That would change if Direct Air Capture technology was deployed on a large scale. For Ed’s sake let me emphasize that “human absorption” by Direct Air Capture has nothing to do with what he calls “human carbon”.
You argue “It is reasonable to treat any source by itself with flow characteristics the same as the total.” I think you are saying, as Demetris Koutsoyiannis has, why not pin the blame for the growth on decaying vegetation, whose emissions are growing as the stock of vegetation grows? But the growth in vegetation that the CO2 Coalition praises implies that there is more carbon in vegetation in 2010 than there was in 1960. Similarly the ph decrease of the oceans tells us that there is more carbon in the oceans in 2010 than in 1960. Where is there LESS carbon? There is less carbon in the fossil fuel reserves. Doesn’t that tell you that removing carbon from those reserves is the cause of the increases elsewhere?
Hi David,
I just finished updating my point about CO2C’s carbon mass balance error, now in 3.1.
In my view, “Net global uptake” is just plain bad physics. The “Net global uptake” boys have no carbon cycle model to support their conclusions. They assume H(1) is true before they make their calculations.
They don’t get it that there are independent human and natural carbon cycles.
The idea that there is “missing carbon” that they can measure, and the “carbon that didn’t stay in the atmosphere” assumes H(1) is true.
Ed,
As Dave Andrews correctly points out, it’s an empirical fact that human CO2 emissions are greater than the amount of CO2 accumulating in the atmosphere. You don’t need a carbon cycle model to compute the global mass balance of CO2.
The annual increase in atmospheric CO2, which is known with a high degree of certainty, is less than the global annual emissions from fossil fuel burning and cement production alone. The latter two things are more likely than not underestimates because they depend on countries accurately reporting their consumption of fossil fuels.
The difference between CO2 rise and CO2 emissions from fossil burning and cement production is referred to as the so-called “missing CO2”. The scale of engineered CO2 removal from the atmosphere by humans is too small to account for the “missing CO2”. Thus, common sense should tell you that if there is no significant human CO2 sink and the annual increase in atmospheric CO2 is less than that emitted by human activities alone, nature – the oceans and land — must be a net global sink of atmospheric CO2, not a source. I don’t see how it’s plausible to infer anything different.
The mass balance result is partly the basis for IPCC’s conclusion that the rise in atmospheric CO2 is largely due to human emissions rather than from natural sources. There is a substantial body of other evidence that shows both the oceans and land are net sinks of atmospheric CO2.
Your statement that Delta 14C is decreasing because it is returning to
its balance level.” Is a tautology. You are essentially saying Delta 14C is decreasing because it’s decreasing.
You seem not to fully understand the causes of the post-bomb decline in Delta 14C of atmospheric CO2. This is reflected in your incorrect statement that “If human CO2 caused all the CO2 increase, it would have reduced the Delta 14C balance level by 33 percent.”
And you also state that “Berry’s accurate curve fit shows no measurable effect of human CO2 emissions or of a “Suess effect dilution”.” If so, then are you suggesting that net uptake of 14CO2 alone accounts for the post-bomb decline of Delta 14CO2? Your curve fit is to the post-bomb decline of Delta 14C of atmospheric CO2. But it doesn’t account for the isotopic dilution effect on atmospheric Delta 14CO2. It’s simply a curve fit.
And your 33 percent calculation firstly assumes that all of the 14C produced from atmospheric testing of nuclear weapons remains in the atmosphere and becomes isotopically diluted by 14C-free CO2 emissions from fossil fuel burning. This is a false assumption. Moreover, your assumption is at odds with your claim that isotopic dilution was not the cause of post-bomb decline of atmospheric Delta 14CO2.
You overlook the fact that both 12CO2 and 14CO2 are cycled and exchanged between the atmosphere and ocean and land. The magnitude of this CO2 cycling and exchange, which you appear to accept and use in one of your other arguments, is clearly shown in your Figure 3 – IPCC’s natural and human global carbon cycle figure. This carbon cycling and exchange between reservoirs has the effect of lowering the Delta 14C of atmospheric CO2 and increasing the Delta 14C of CO2 in the ocean and of exchangeable/recyclable CO2 in soil and plants in the terrestrial biosphere.
Empirical data clearly show the Delta 14C of CO2 in ocean surface water and in recycled soil and plant carbon in the terrestrial biosphere increased during the post-bomb period as the Delta 14C of atmospheric CO2 declined. I can provide a figure showing this if you would like to see it.
The exchanges of CO2 between the atmosphere and the ocean and terrestrial biosphere that has a lower Delta 14C than the atmosphere partially contributed to the decline of Delta 14C of atmospheric CO2 before isotopic equilibrium was reached between the atmosphere and the ocean and land. The net effect of this recycled CO2 on the isotopic dilution of atmospheric 14CO2 is less than what would have occurred if all of the bomb 14C had remained in the atmosphere. It is the reason why the Delta 14C of atmospheric CO2 has not declined to 33 percent below the pre-bomb level. But the post-bomb decline of atmospheric Delta 14CO2 is still largely due to isotopic dilution. Net uptake of CO2 would not be expected to have a major effect on the Delta 14C of CO2 remaining in the atmosphere because there is only a small isotope effect on uptake of the two isotopes – 12C and 14C.
Because of isotopic dilution, the Delta 14C of atmospheric CO2 is now less than that of ocean surface water. The resulting isotopic disequilibrium of 14C between the atmosphere and ocean surface water is the reason why the concentration of 14CO2 in the atmosphere is now increasing. This was predicted to occur. Dave Andrews has provided empirical data in one his published papers, showing this has happened. Thus, the oceans are now a net global source of atmospheric 14CO2 and a net global sink of atmospheric 12CO2.
The CO2 in ocean surface water and the atmosphere reached isotopic equilibrium in the early 90s, but the Delta 14C of atmospheric CO2 has continued to decline to slightly below its pre-bomb level, most likely due to continued isotopic dilution from emissions of 14C-free CO2 from fossil fuel burning. There is every reason to expect it will continue to decline with continued emissions of 14C-free CO2 from fossil fuel burning.
Dear Jerry,
(Below, I repeat your comments and indent my comments.)
It’s an empirical fact that human CO2 emissions are greater than the amount of CO2 accumulating in the atmosphere.
You don’t need a carbon cycle model to compute the global mass balance of CO2.
The difference between CO2 rise and CO2 emissions from fossil burning and cement production is referred to as the so-called “missing CO2”.
Thus, common sense should tell you that if there is no significant human CO2 sink and the annual increase in atmospheric CO2 is less than that emitted by human activities alone, nature – the oceans and land — must be a net global sink of atmospheric CO2, not a source.
The mass balance result is partly the basis for IPCC’s conclusion that the rise in atmospheric CO2 is largely due to human emissions rather than from natural sources.
There is a substantial body of other evidence that shows both the oceans and land are net sinks of atmospheric CO2.
Your statement that Delta 14C is decreasing because it is returning to
its balance level.” Is a tautology. You are essentially saying Delta 14C is decreasing because it’s decreasing.
You seem not to fully understand the causes of the post-bomb decline in Delta 14C of atmospheric CO2. This is reflected in your incorrect statement that “If human CO2 caused all the CO2 increase, it would have reduced the Delta 14C balance level by 33 percent.”
And you also state that “Berry’s accurate curve fit shows no measurable effect of human CO2 emissions or of a “Suess effect dilution”.”
If so, then are you suggesting that net uptake of 14CO2 alone accounts for the post-bomb decline of Delta 14CO2? Your curve fit is to the post-bomb decline of Delta 14C of atmospheric CO2. But it doesn’t account for the isotopic dilution effect on atmospheric Delta 14CO2. It’s simply a curve fit.
And your 33 percent calculation firstly assumes that all of the 14C produced from atmospheric testing of nuclear weapons remains in the atmosphere and becomes isotopically diluted by 14C-free CO2 emissions from fossil fuel burning.
This is a false assumption. Moreover, your assumption is at odds with your claim that isotopic dilution was not the cause of post-bomb decline of atmospheric Delta 14CO2.
You overlook the fact that both 12CO2 and 14CO2 are cycled and exchanged between the atmosphere and ocean and land. The magnitude of this CO2 cycling and exchange, which you appear to accept and use in one of your other arguments, is clearly shown in your Figure 3 – IPCC’s natural and human global carbon cycle figure. This carbon cycling and exchange between reservoirs has the effect of lowering the Delta 14C of atmospheric CO2 and increasing the Delta 14C of CO2 in the ocean and of exchangeable/recyclable CO2 in soil and plants in the terrestrial biosphere.
Empirical data clearly show the Delta 14C of CO2 in ocean surface water and in recycled soil and plant carbon in the terrestrial biosphere increased during the post-bomb period as the Delta 14C of atmospheric CO2 declined. I can provide a figure showing this if you would like to see it.
The exchanges of CO2 between the atmosphere and the ocean and terrestrial biosphere that has a lower Delta 14C than the atmosphere partially contributed to the decline of Delta 14C of atmospheric CO2 before isotopic equilibrium was reached between the atmosphere and the ocean and land.
The net effect of this recycled CO2 on the isotopic dilution of atmospheric 14CO2 is less than what would have occurred if all of the bomb 14C had remained in the atmosphere.
It is the reason why the Delta 14C of atmospheric CO2 has not declined to 33 percent below the pre-bomb level. But the post-bomb decline of atmospheric Delta 14CO2 is still largely due to isotopic dilution. Net uptake of CO2 would not be expected to have a major effect on the Delta 14C of CO2 remaining in the atmosphere because there is only a small isotope effect on uptake of the two isotopes – 12C and 14C.
Because of isotopic dilution, the Delta 14C of atmospheric CO2 is now less than that of ocean surface water. The resulting isotopic disequilibrium of 14C between the atmosphere and ocean surface water is the reason why the concentration of 14CO2 in the atmosphere is now increasing. This was predicted to occur.
Dave Andrews has provided empirical data in one his published papers, showing this has happened. Thus, the oceans are now a net global source of atmospheric 14CO2 and a net global sink of atmospheric 12CO2.
The CO2 in ocean surface water and the atmosphere reached isotopic equilibrium in the early 90s, but the Delta 14C of atmospheric CO2 has continued to decline to slightly below its pre-bomb level, most likely due to continued isotopic dilution from emissions of 14C-free CO2 from fossil fuel burning. There is every reason to expect it will continue to decline with continued emissions of 14C-free CO2 from fossil fuel burning.
Thanks for your excellent workings, Ed.
Additional thought: we have been given a very robust self-repairing planet.
IPCC tell us there are 39,000GT of CO2 in the oceans.
There are also 1,386,000,000 cu kms of water = 1386 x 10 to the 15 cu m
Sea water weighs 1024kg/cu m
Total weight of oceans is 1419 x 1 with 18 zeros
Divide the CO2, 39,000 GT, or 39 with 15 zeros, by the size of the oceans and you get 27ppm
Humans produce 38GT p.a. so 100 years of it would increase the CO2 by 2.6ppm.
I was working in the 1970’s when the National Geographic was prophesying the next ice age was about to begin, but CO2 had increased for the previous 30 years! Folks are gullible. God has given us a great planet! (which of course we must not pollute with plastic)
Ed,
It’s time to give it up. You know as well as I do that our positive net global uptake is a consequence of applying dL/dt = Inflow – Outflow to total carbon. There are no mistakes, circular reasoning, or extraneous unwarranted assumptions involved. It can also be deduced from common sense.
Years ago you posted that a bad argument is better than none at all. But the CO2 Coalition, who make plenty of bad arguments themselves, thought otherwise. They knew that between you, Harde and Salby, and Koutsoyiannis, climate skepticism was weakened by obviously bad arguments. Last winter you tried to get bad science into Montana law. Now you want bad science to influence federal science policy. There is enough chaos in Washington DC without your help.
Find another hobby, Ed
Hi David,
You wrote, “our positive net global uptake is a consequence of applying dL/dt = Inflow – Outflow to total carbon.”
But you have never proved your claim in any of your publications. All you do is handwaving. I have proved that your statement is wrong, but you just don’t get it.
So, let me ask you something simpler. Do you understand my argument about a weight on a string? Many PhD’s in physics still argue that the weight speeds up. They just don’t get it.
The argument you make about “positive net global uptake” is a similar physics error.
Ed,
dL/dt = Inflow – Outflow, integrated and applied to total atmospheric carbon, means that the amount the total atmospheric carbon level changes in some time period “Cchange” equals the difference between the amount that went into the atmosphere and the amount that left during that period. Are you with me so far?
The amount that went into the atmosphere in that period can be divided into two parts: human emissions from fossil fuel burning “Eh” and natural emissions “En”. The only significant outflow is natural “An”. Putting this all together
Cchange = Eh+En-An. Rearranging
Eh-Cchange = An – En
which is sensibly called “net global uptake”, the amount by which human emissions exceeded the carbon level change, or the net amount of carbon REMOVED from the atmosphere by natural processes. Measurements show that this quantity has been positive during the Industrial era. You had graphs showing this in your earlier papers, but apparently decided to remove it from your current scribblings.
You disrespect your readers, Ed, by thinking that they don’t understand this and pretending that you do not either. If you have further questions you can ask DMA.
David,
You get the wrong answer because you combine human and natural flows and omit an important term.
You claim the only significant outflow is natural “An”. Then you omit “Ah.” You flunk physics.
The rule of physics is never, never, never omit a term in your equations. But you do, and you thereby get the wrong answer. You must include this term and then put in data to prove it is negligible. You have not done this.
I prove this term is very important. In fact, the term you omitted makes all the difference.
We have been over this before in our published papers. You should have learned.
My primary mentor, Winterberg, was the best student of Heisenberg. He wrote years later that I was his best student. (I would have flunked his courses if I made an error like you keep making.)
Dave A, that’s all very obviously correct, but who is “DMA”?
(Never mind; I see that “DMA” is the handle of one of the participants here.)
Dave A, I’m very interested in hearing about what you think are the “bad arguments” made by the CO2 Coalition (of which I’m a member). You have my email address.
Warmest regards,
Dave B
Dave B,
I do not know who DMA is; just somebody who follows Ed. My middel initial is E.
The CO2 Coalition’s cavalier attitude towards the rest of climate science bothers me. Celebrating atmospheric CO2 as plant food and ignoring its warming effects bothers me. I do not think that our present atmosphere is necessarily “optimal” for humans, but change can be very costly even if we are not facing an “existential” threat. I am more conversant on the carbon cycle issues than on radiative forcing, etc., but I see flaws in Happer’s saturation argument. “Extreme weather” problems, especially involving the increased water content of tropical storms, seem to me very likely real and linked to CO2. The poor quality of the denier arguments that I have focussed on, ever since stumbling on the Berry/Harde/Salby confusion between deltaC14 and concentration, makes me very skeptical of other skeptics and inclined to believe the consensus. After all, predictions made 25 years ago turned out to be quite accurate. (Predictions were on the high side for awhile, with the warming perhaps masked by sulphur aerosols, but not any longer.)
Dave A wrote, “The poor quality of the denier arguments that I have focussed on, ever since stumbling on the Berry/Harde/Salby confusion between deltaC14 and concentration, makes me very skeptical of other skeptics and inclined to believe the consensus.”
I quite understand, and you didn’t even mention Principia Scientific‘s crackpottery. But why doesn’t the abundant nonsense from climate alarmists also make you very skeptical of alarmists and their claims?
For instance, you say that “‘Extreme weather’ problems, especially involving the increased water content of tropical storms, seem to me very likely real and linked to CO2.” But, as I trust you know, those problems are merely predicted, and there’s been no detectable increase in extreme weather, thus far.
Hurricanes & tropical cyclones have not worsened:
Graph: https://sealevel.info/global_major_freq_hurricanes_2022-02-28_ryanmaue_1941x1017_annot1.png
References: https://sealevel.info/learnmore.html?0=hurricanes#hurricanes
Nor have tornadoes:
Graph: https://sealevel.info/tornadoes-1955-2024.png
References: https://sealevel.info/learnmore.html?0=tornadoes#tornadoes
Nor have nor’easters, droughts or floods, or any other class of extreme weather:
Graph: https://www.ncdc.noaa.gov/temp-and-precip/uspa/wet-dry/0
References: https://sealevel.info/learnmore.html?0=droughts#droughts
Do you know where the prediction of worsening “extreme weather,” and, in particular, worsening tropical storms, came from? It was from this book:
https://www.amazon.com/Storms-My-Grandchildren-Catastrophe-Humanity/dp/1608195023
Storms of My Grandchildren: The Truth about the Coming Climate Catastrophe and Our Last Chance to Save Humanity, by Dr. James Hansen, “the world’s leading climatologist.”
In 2011 Dr. Hansen did a publicity tour to promote his book, and on the Dave Letterman show he explained why global warming will cause worsening storms. He said that AGW would warm the tropics more than high latitudes, and the resulting “increasing temperature gradient” [between high & low latitudes] would “drive stronger storms.” Listen to it here:
https://www.youtube.com/watch?v=SOKBOFLhgqM#t=7m25s
I trust you know that the “increasing temperature gradient” between high & low latitudes is nonsense. The temperature gradient is decreasing, not increasing. (Aside: “Arctic amplification” is the happy fact that “global warming” isn’t really very global, because it disproportionately warms chilly high latitudes, especially in winter. The tropics and summers are affected less—which is nice, because they’re warm enough already.)
That’s just as Arrhenius predicted over a century ago.
Hansen’s mistake was not minor, it was the basis of his book! Yet, as far as I know, not a single prominent climate activist or alarmist institution criticized Hansen’s error, or suggested that the decreasing temperature gradient between high & low latitudes could drive weaker storms. Not even one.
THAT is the most striking difference between climate alarmists and skeptics of climate alarmism. As you’ve seen, prominent skeptics and lukewarmers devote considerable time and effort to debunking things like the Berry/Harde/Salby confusion about CO2. But nobody on the alarmist side of the debate bothers to debunk nonsense like Hansen’s confusion about storms.
That’s because the driving motivation of the leading scientists who’re skeptical of climate alarmism is that, like you, we are passionate about scientific integrity, and that generally isn’t the case on the other side.
If you doubt it, then explain why people like Hansen and even Guy McPherson generally get a free pass from other climate alarmists? Why doesn’t anyone in the alarmist community put as much effort into debunking Hansen’s errors as the CO2 Coalition puts into debunking the Berry/Harde/Salby confusion about CO2?
This has gotten long, so I’m going to defer discussion of “saturation,” the inaccuracy of alarmists’ predictions several decades ago, and the supposed “consensus,” to another day.
New and interesting information which may add to your paper ?
The text below i a copy from a recent article by Charles Rotter in WUWT with following title and introduction ;
Settled Science Springs a Leak: Rivers Reveal the Carbon Cycle’s Dirty Secret.
The recent Nature study titled “Old carbon routed from land to the atmosphere by global river systems” is not only a rigorous piece of scientific work—it’s also a spectacular indictment of the so-called “settled science” of climate change. This 2025 paper is a flaming arrow into the heart of carbon cycle certainty, unearthing yet another inconvenient truth: over half of the CO2 emitted from rivers comes from carbon sources that are hundreds to thousands of years old—not from recent fossil fuel emissions or current biological activity.
Ove,
The Nature paper cited by Rotter is quite interesting. It is open-access, and you should read it. It will not change the measurement of net global uptake by natural processes at all. The models of exchange rates between various reservoirs based on C14 data will need to be adjusted. It is hardly a “flaming arrow into the heart of carbon cycle certainty.” It is a typical small step forward in understanding nature.
Ed,
It is easy to find data showing that an “Ah” term is negligible. This would measure human processes removing carbon from the atmosphere and has nothing to do with what you call “human carbon”. (You sometimes seem unclear on that or perhaps purposely want to muddy the waters.)
See the following International Energy Agency report on global carbon sequestration projects. https://www.iea.org/data-and-statistics/data-tools/ccus-projects-explorer The 2025 global CAPACITY is for the removal of 50.9 MEGA-tonnes of CO2/yr. (They don’t say how much of that capacity will be used.) On the other hand, human emissions in 2024 were 41.4 GIGA-tonnes, and net global uptake by natural processes was around 19 GIGA-tonnes. GIGA is 1000x larger than MEGA. So you can correct net global uptake downward by the factor of .997 if you like, though the real correction using UTILIZED capacity would be smaller. Note that while IEA projects a 6-fold increase in sequestration capacity over the coming decade, that will still not be sufficient to make a big impact, though every bit helps.
You like to feign confusion and attack the rock-solid carbon balance calculation but never address the other major criticism of your work. You estimate/calculate that only a small portion of the carbon in the present atmosphere was once part of a fossil fuel. NO ONE DISAGREES WITH YOU! What you get wrong is your inference that the CAUSE of the increase is therefore natural. NO! Mixing between your “human carbon” and much larger stocks of “natural carbon” have fooled you.
Dear David,
You write, “It is easy to find data showing that an “Ah” term is negligible.” There are no such data!
All the “data” you reference ASSUMES in its processing that Ah is zero, making your argument circular. The IEA “data” are junk data.
The burden of proof is on you. You cannot simply list references. You must show your total argument if you wish to make your point.
Do you claim IPCC’s natural carbon cycle data are wrong? If so, then show the corrections you wish to make to IPCC’s natural carbon cycle data.
You cannot legitimately claim that human carbon caused all (or almost all) of the CO2 increase and at the same time agree that IPCC’s natural carbon data are valid.
My papers prove these two positions are not compatible. I used simple deductive reasoning. Therefore, you cannot use data to prove my deductive reasoning is wrong. You must find an error in my deductive reasoning to prove my argument is wrong. You have not done this.
You estimate/calculate that only a small portion of the carbon in the present atmosphere was once part of a fossil fuel. NO ONE DISAGREES WITH YOU! What you get wrong is your inference that the CAUSE of the increase is therefore natural. NO! Mixing between your “human carbon” and much larger stocks of “natural carbon” have fooled you.
David,
You are not debating physics. You are only debating your emotions. I can’t debate your emotions.
My formulation of IPCC’s natural carbon cycle allows deductive proof that the impact of human carbon emissions has negligible effect on the CO2 level.
Nothing you have argued has any effect on my proof, which still stands.
David A wrote, “It is easy to find data showing that an ‘Ah’ term is negligible. This would measure human processes removing carbon from the atmosphere…”
Ed replied, “There are no such data!”
David A. is right. I included the data in a comment, here:
https://edberry.com/co2coalition/#comment-112419
Ed, your “Ah,” i.e., the anthropogenic processes which deplete the CO2 from the air, are negligible. More precisely, they are much smaller than the error bars on anthropogenic emissions, so they can be ignored in “mass balance” arithmetic. Even if you count cement carbonation, anthropogenic CO2 removals are still only about 2% of anthropogenic CO2 emissions.
Ed wrote to David A, “You are not debating physics. You are only debating your emotions.”
That’s untrue. The only part of what David A. wrote which is not rock-solid science is his expressed belief that removing CO2 “helps.” That’s a value judgement with which I disagree, but it is not our topic here.
David,
Your net global uptake argument is a confirmation biased fake argument. You said:
““net global uptake”, the amount by which human emissions exceeded the carbon level change, or the net amount of carbon REMOVED from the atmosphere by natural processes. Measurements show that this quantity has been positive during the Industrial era.”
What measurements? Just words. No citation. There are no such measurements. If you are referring to the Global Carbon Budgets. These papers are the biggest waste of tax payers money in the history of science. They are based on assumptions, guesses, estimates and models based on false assumptions. No one has ever measured ocean emissions. That would require thousands of measurement stations over the oceans globally. Emissions are different in every location around the world.
The Pinatubo experiment conducted by Bromley & Tamarkin 2022 demonstrated that human emissions of CO2 are miniscule and almost too small to measure. The oceans are the dominant source and sink for CO2.
“They examined data following the explosive volcanic eruption of Pinatubo on the island of Luzon in the Philippines in June 1991. This eruption emitted large amounts of aerosols into the atmosphere blocking sunlight and reducing SSTs and surface temperatures. This altered the Henry’s Law ratio causing a reduction in oceanic emissions lowering the atmospheric concentrations. There was a large natural movement down in atmospheric concentrations of CO2 post the eruption, followed after that by an even larger natural movement back up.
The large movement down in CO2 concentrations post the eruption occurred despite the fact that during this same period, human emissions of CO2 continued unabated. Natural emissions also continued from, e.g. biosphere decay & ocean emissions. During 1991-1992 there was an El Nino event which caused increased emissions from a warmer Pacific Ocean. On top of that, the volcano itself added large amounts of CO2 gas to the atmosphere. In spite of all these emissions, overall SSTs dropped post the eruption causing a large drop in atmospheric CO2 concentrations.”
Bromley & Tamarkin 2022; Correcting Misinformation on Atmospheric Carbon Dioxide; https://budbromley.blog/2022/05/20/correcting-misinformation-on-atmospheric-carbon-dioxide/ Accessed 28-8-2023
Additionally Bromley showed that it is impossible for humans to control atmospheric CO2 concentrations. This is controlled by Henry’s Law and Henry’s equilibrium ratio which is in turn controlled by sea surface temperatures.
Bromley, Bud 2021; Henry’s Law controls CO2 concentration, not humans; Posted on August 18, 2021; Accessed 25/8/2023; https://budbromley.blog/2021/08/18/henrys-law-controls-co2-concentration-not-humans/
Bromley, Bud 2023 EPA Submission Document; Comment submitted by Clare Livingston “Bud” Bromley III; Posted by the Environmental Protection Agency on Aug 10, 2023; https://www.regulations.gov/comment/EPA-HQ-OAR-2023-0072-0504; Attachment 3 Comment by Bud Bromley on the proposed rule by the Environmental Protection Agency; New Source Performance Standards for Greenhouse Gas Emissions from New, Modified, and Reconstructed Fossil Fuel-Fired Electric Generating Units: Emission Guidelines for Greenhouse Gas Emissions from Existing Fossil Fuel-Fired Electric Generating Units; and Repeal of the Affordable Clean Energy Rule
https://www.regulations.gov/document/EPA-HQ-OAR-2023-0072-0001
Further isotopes clearly demonstrate that the vast majority of CO2 emissions has an ocean origin.
Increase in CO2 Concentrations is coming from the Oceans
Brendan Godwin ; March 2021
DOI: 10.13140/RG.2.2.35445.29923
https://www.researchgate.net/publication/350162788_Increase_in_CO_2_Concentrations_is_coming_from_the_Oceans
The δ13C for the oceans is -10‰ as measured by NOAA, See also the extensive work on isotopes conducted by Philip Mulholland.
Carbon Isotope Ratio Formula 17Jun25
June 2025
DOI: 10.13140/RG.2.2.36123.37920/1
Lab: Philip Mulholland’s Lab
Philip MulhollandPhilip Mulholland
https://www.researchgate.net/publication/392822758_Carbon_Isotope_Ratio_Formula_17Jun25
For more information see http://www.climate-truths.com.
Brendan.
From my earlier post to DMA:
“See for example Ballantyne, A. P. Alden, C.B., Miller, J.B., Tans, P.P. ,2012: Increase in observed net carbon dioxide uptake by land and oceans during the past 50 years, Nature, vol 488 pp 70-72. doi:10.1038/nature11299. They find that between 1960 and 2010:
Human emissions totaled 350 +or – Pg of carbon
Atmospheric accumulation was 158 + or – 2 PgC
Therefore by subtraction, ocean and terrestrial sinks took in 192 + or – 29 Pg of carbon.
(1 Pg = 1 billion metric tonnes. Note that the analysis applies to the carbon in CO2, not CO2 itself, because it is carbon that is conserved, not CO2.)
Ballantyne et al divide the data into decades and find that, like human emissions, net global uptake increased during those 50 years. [DMA is] correct that “increasing one minor source will induce an offset reaction in other sources.” [DMA is] also correct that natural forces have an effect. Net global uptake, while definitely positive in the 1990’s, was a bit lower than in neighboring decades. Ballantyne et al attribute that to the cooling effects of the Pinatubo eruption.”
By the way, while the Henry’s Law coefficient is indeed temperature dependent, the main Henry’s Law effect is that if you stuff extra carbon into the atmosphere, a new balance will push some into the oceans. That is what has happened.
Ed,
I am not emotional about carbon conservation. I am emotional about integrity. The only explanation for “the best student of Winterberg” not being able to figure out and acknowledge the obvious is that you are dishonest, and that you think so little of your followers that you take the chance that they can’t figure it out either. It’s not rocket science, but perhaps you know your followers better than I do.
I was going to point out all your errors with C14, but I see that Jerry Elwood has already done a good job of that, and you have responded with your usual gibberish, so there is not much else to say. I will leave you alone until the next time you try to influence Montana law. There is a good reason you are toxic among the Montana Republicans.
David,
Well done. Your Ballantyne et al 2012 is hidden behind a paywall. But the abstract doesn’t help your cause at all. Look at the first line.
“One of the greatest sources of uncertainty for future climate predictions is the response of the global carbon cycle to climate change”
The whole paper is based on this confirmation bias. Climate change is a non existent problem. As usual for these confirmation biased papers. it is assumed that the climate change is human induced. HICC has never been validated in any scientific real world experiment. There are zero scientific papers in the empirical literature that can show, from observations based on experiment, that human emissions of CO2 cause any change to global temperatures of the climate. No one has ever measured the temperature of the Earth warm and been able to attribute that warming to CO2 molecules in any real world experiment. That means HICC is not a theory and hasn’t even risen to the scientific level of a hypothesis. It is just an idea and one that fails experiment. As Richard Feynman says, if it fails experiment it is wrong. So your paper is based on this line which is a fallacy.
The paper used mathematical illusions (sorry – models), not measurements. It is related to the global carbon budget which is all fake.
In any event, whatever is written in the bowels of this paper is falsified by Bromley & Tamarkin 2022 which is based on only measurements.
DMA is wrong.
David, your comments are toxic, riddled with ad hominem, lacking in any science and provide no value to this discussion. You ignore all inconvenient truths and keep pumping your confirmation biased propaganda.
David,
You said:
“Henry’s Law coefficient is indeed temperature dependent, the main Henry’s Law effect is that if you stuff extra carbon into the atmosphere, a new balance will push some into the oceans”
You called it the “main” effect. That demonstrates your confirmation bias. That is correct but you are talking about only a miniscule amount.
However you are ignoring the inconvenient opposite truth. If humans remove CO2 from the atmosphere, such as burring it underground, the oceans will replace all of that remove CO2 back into the atmosphere.
As proven by Bud Bromley, it is impossible for humans to control atmospheric CO2 concentrations.
Brendan, average sea surface temperatures (SST) are believed to have risen only about 0.5 °C over the 2/3 century since 1958 (when precise CO2 measurements began). Yet over that same 2/3 century period atmospheric CO2 levels rose by 35% (110 ppmv):
https://sealevel.info/co2.html
Now, consider the relative effect of a 0.5 °C SST increase (since 1958) and a 35% atmospheric CO2 level increase (since 1958) on the CO2 fluxes between ocean and air. We know from the temperature dependence of Henry’s Law that a 0.5°C water temperature increase will reduce CO2 solubility in water by about 2%:
https://sealevel.info/CO2_solubility_in_water_vs_temperature_showing_effect_of_1C_warming5.png
But a 35% increase in CO2’s partial pressure in the atmosphere will increase CO2 dissolution into the ocean by 35%. Since 35% > 2%, it is correct to call the “35%” the “main effect.” That’s not confirmation bias, it’s just what the numbers show. It means that the net effect of the two changes (temperature and atmospheric CO2 level) must be an acceleration in ocean uptake of CO2.
Also, note that global temperatures and presumably sea surface temperatures (SSTs) declined in the 1950s, 1960s, and early 1970s. Yet CO2 levels nevertheless kept on rising. Obviously rising water temperatures didn’t contribute to rising CO2 levels when water temperatures were falling.
https://sealevel.info/newsweek_old.htm
Dear Ed,
It is difficult to react on a lot of allegations on one’s work, if nobody did warn the authors that these allegations even existed…
My co-worker, David Burton, and I have commented in the past on the “model” that you used to describe the carbon cycle. To no result, as you still use the “classic” model that assumes that the CO2 level in the atmosphere is caused by the sum of all CO2 inputs and that the level in the atmosphere causes the height of the outputs. We call that the “lake” model. Every flow is one-way from river inputs to lake outputs.
The real CO2 world is quite different: 95% of all CO2 fluxes are just cycling in and out, completely independent of the CO2 level/pressure in the atmosphere. Only 5% is directly pressure difference (with the ocean surface and plant alveoles) dependent, not even depends on the absolute pressure of CO2 in the atmosphere…
Take what happens in spring/summer: a lot of new leaves are formed and together with increased sunshine and temperature, lots of CO2 are sucked out of the atmosphere, even so much that the atmospheric CO2 levels get lower! Despite that at the same time the warming oceans are releasing lots of CO2 from their surface.
That means that hardly any extra CO2 is absorbed, due to the CO2 pressure in the atmosphere. In reality: 2.5 PgC/year extra absorbed in vegetation by the extra CO2 pressure, while fossil emissions are about 10 PgC/year.
That are the largest carbon cycles within a year, completely reversing in other seasons.
That is what we call the “fountain” model: lots of water are cycling over the fountain, but if some worker opens the small valve of the water supply, only then the level in the water basin will increase, completely independent of how much water circulates over the fountain.
Which model then is right? In your “classic” model, the ratio of “markers” in the lake (atmosphere) never can exceed the marker ratio in the total inputs. In the “fountain” model, a marker (like a green color at St. Patrick”s day in Chicago) can asymptotically go up to 100% of the fountain water…
A good marker is the ratio between 13C/12C which is a lot lower in fossil fuels. While vegetation has a similar ratio, the O2 balance and the greening of the earth shows that vegetation is a net absorber of CO2, thus enriching the remaining atmosphere in 13C/12C ratio. Ocean releases also are slightly higher in 13C/12C ratio than in the current atmosphere.
While the human input in the years 1958-2024 increased from about 1.5 to 5% of all inputs, the observed drop in 13C/12C ratio shows that already over 10% of the current atmosphere (and 6% in the ocean surface) is from fossil fuels.
Thus your “classic” model is completely refuted by the observations…
That includes that your equation (2) is already good for the waste bin and all the other allegations against our work are not based on real world observations…
Best regards,
Ferdinand Engelbeen, lead author of the CO2 Coalition’s work on the origin of the CO2 increase in the atmosphere.
Dear Ferdinand,
Thank you for commenting here to support your CO2 Coalition paper.
You addressed more than one point in your comment. I will reply in separate comments to avoid confusion. And you are welcome to add other points later.
Regarding your 13C/12C ratio, let’s call it R.
RealClimate says R for human CO2 is about 98 percent of the ratio in natural CO2, and R has declined about 0.15 percent since 1850 as of about 2004.
To calculate the effect of human CO2 let L13 = the level of R. We calculate L13 by combining the natural R with the human R by multiplying their levels by their R’s:
…… L13 = Ln Rn + Lh Rh …………………………… (1)
where:
…… Ln = the natural R level = 1.000
…… Lh = the human R level = 0.980
…… Rn = the natural CO2 fraction = 0.92 for 8% human and 0.68 for 32% human
…… Rh = the human CO2 fraction = 0.08 for 8% human and 0.32 for 32% human
The IPCC says human CO2 is 32%, meaning H(1) is true.
Inserting this into (1) gives:
L13 = 0.680 + (0.980) (0.320) = 0.9936 = 1 – 0.0064 …………………………… (2)
The Berry Model says human CO2 is 8%, meaning H(1) is false. This gives:
…… L13 = 0.920 + (0.980) (0.080) = 0.9984 = 1 – 0.0016 …………………………… (3)
RealClimate says the human-caused R is:
…… L13 = 1 – 0.0015 …………………………… (4)
Therefore, the R data (4) support the Berry model (3) and contradict the IPCC model (2).
Even with slightly different data, it is clear that the Berry model is consistent with the R data, and your model is not.
Your paper mentions that the R data are not very good and should not be the final decision on H(1). So, you have a basis for considering other data like the 14C/12C ratio.
Dear Ferdinand,
Let’s talk about models.
My model is fully described by mathematical equations and physical assumptions. That’s the way physics and engineering work.
Your model has no equations or stated assumptions. Yet, you make conclusions without being able to calculate anything from your model.
Your argument for your fountain model is simply imaginary. Such models are a dime a dozen and they prove nothing.
A model is a simplified description of a physical problem that explains the overall problem and allows calculation that make predictions.
So, your fountain model is not really a model. It is your personal feeling about how nature works.
My equation (2) that says Outflow = Level / Te
It is a description of how the overall carbon cycle works. It does not attempt to describe every carbon atom.
My model replicates IPCC’s natural carbon cycle and shows how nature could have remained constant at a level of 280 ppm.
Your model can’t explain how nature might have stayed constant.
If your model can’t explain a constant carbon level, your model can’t explain anything. It is purely a product of your imagination.
My model follows Dalton’s Law of Partial Pressures. Yours does not.
My equation (2) applies to the carbon cycle but it does not apply, for example, to how fast water flows out of a spout at the bottom of a bottle. There is a different equation that describes that.
Similarly, my model does not apply to how fast water flows over a dam. Another equation describes that.
My lake analogy is merely to help people understand how a higher level produces a higher outflow.
My model also follows standard systems engineering models, where levels define outflows and outflows change levels.
This is a very important issue. The validity of my model is supported by how my model also works for electric circuits.
Without this formulation, you have no model. Your model is vaporware.
Your criticisms of my model are hand waving after you reject what is already known in physic and engineering.
When you reject my equation (2) which is IPCC’s equation, you have nothing. You have no substitute for (2).
Your personal feelings about nature that you cannot describe with a model are not a valid criticism of my model.
Dear Ferdinand,
You wrote:
“You still use the “classic” model that assumes that the CO2 level in the atmosphere is caused by the sum of all CO2 inputs and that the level in the atmosphere causes the height of the outputs. We call that the “lake” model. Every flow is one-way from river inputs to lake outputs.”
Your description does not match my model. See my Figure 3, page 10. It shows IPCC’s data for its natural and human carbon cycles.
Carbon flows in both directions, not one. The level in the atmosphere is NOT “caused by the sum of all inputs.”
The rate of change in a level equals the Inflow minus the Outflow. This is my equation (1) which is the standard continuity equation.
The natural carbon level in the atmosphere sets the natural carbon outflow to land and surface ocean. Similarly for human carbon.
When the outflows equal the inflows, the level remains constant as the flows continue.
From your description, you do not understand my carbon cycle model at all. Which means you don’t understand my simple equations based on (1) and (2). No wonder you have no math in your model. You don’t understand simple math.
Your “Lake model” criticisms do not apply to my carbon cycle model because your Lake model is not my carbon cycle model.
Sorry, but that is not what Figure 3 shows. Figure 3 shows all fluxes in one direction: from ins to container to outs.
Neither is the calculation of the real adjustment time based on Figure 3, but on the net removal of CO2 out of the atmosphere, which is around 50 years. The residence time of about 4 years is based on the sum of all outflows together, not the net outflow…
Congratulations, real science wins!
Cees.
I guess I can’t see the difference between the fountain and the lake. Both have inputs and outflows but the fountain recycles some of the out as in. The amount flowing out of the fountain is still set by the inflow.
The difference: the out that is recycled has zero influence on the water level in the lake.
The water that that gets the overflow of the basin is removed out of the lake, thus influences the water level…
Dr. Ed, congratulations on your win! Your next assignment, if you choose to accept it, is to apply your reasoning to the revenue flow budget problem congress doesn’t seem to know how to cope with.
I started reading comments today and made note of some points people make that indicate they may not fully understand your essential argument, one that is shared by many others that you have referenced. I believe the argument in simple terms is that amount of human-sourced CO2 remaining in the atmosphere is far less than your detractors claim, because the annual addition of human CO2 is mixed with as much as twenty times more CO2 from so-called natural sources. Absorption of CO2 does not discriminate whence it came, therefore the amount of human-sourced CO2 remaining in the atmosphere is closer to 5% rather than the 33% claimed by your detractors.
One commenter implied that removing carbon from fossil fuel reserves is the cause of carbon increases elsewhere. Well, it is “a” cause, of course, but it’s the magnitude of both fossil fuel and natural sources and their contributions to the sinks that is being contested. As that same commenter noted, we don’t know the magnitude of all the natural carbon sources.
Another commenter writes, “nature – the oceans and land — must be a net global sink of atmospheric CO2, not a source.” Maybe, but this obscures the fact that natural sources annually contribute about twenty times more carbon to the atmosphere than do human sources. One has to do a rigorous analysis such as yours to estimate how much more of a sink nature is, if in fact it is. Now that I understand how “net global uptake” has been defined, I think global uptake (sinks – sources) could easily be negative with respect to natural carbon flows. I have a spreadsheet model based on math similar to yours that indicates human-sourced carbon would have to be less than 2% of the atmosphere for natural sinks to outweigh sources.
I was stunned to read that David Andrews agrees with you that “only a small portion of the carbon in the present atmosphere was once part of a fossil fuel.” How could he perceive “Ah” to be negligible in that circumstance?
Are you still inviting criticism of your article above? Having read some of your previous papers, I skipped down to the comments assuming you were done editing.
Dear Jim,
Thanks for your great summary. Yes, anyone can still add their comments.
Jim,
You would not have been stunned at my “only a small portion of the carbon in the present atmosphere was once part of a fossil fuel” if you had read and understood either Jerry Elwood’s comments or Ferdinand Engelbeen’s comments on the mixing between the atmosphere and the other reservoirs. You need to understand what is technically called a “disequilibrium isoflux”, which tends to balance the isotopic composition of reservoirs even when no net carbon is exchanged. Ed’s “human carbon” is like an isotope, one depleted in C14. Perhaps it would help if you just imagine our emissions are adding total carbon to the fast cycle ocean and land reservoirs as well the atmosphere, carbon which has been removed from slow cycle fossil fuel reserves. We have added a lot to the fast cycle. We haven’t put much carbon back into the empty coal mines.
Ed has been told about this for years, but feigns ignorance.
I don’t understand why you think this has anything to do with the amount of carbon humans remove from the atmosphere, the negligible “Ah”.
As explained before, it is an empirical fact, not a model, that net global uptake is positive in the current era. How else do you explain that atmospheric accumulation rates are but half of emission rates? It was sometimes negative in the geological past.
Dear Ed,
Sorry for the late reply. My browser (Firefox) didn’t show your replies, neither did my comment show up for several other users… Now I use the Microsoft browser and everything looks normal.
So let’s start with the main difference: the use of the about 4 years residence time, which according to you is the only time of importance.
The 4 years residence time is the time that any CO2 molecule in average stays (“resides”) in the atmosphere. Whatever its origin. There we do agree. Even the IPCC agrees with us.
No problem at all there…
Then we have the continuity equation for the conservation of carbon mass:
Formula (1) shows that:
dL/dt = Inflow – Outflow (1)
Again, I don’t think that anybody disagrees with that, not even the IPCC.
The problems start with Formula (2):
Outflow = L / Te (2)
You insist that the outflow is proportional to the absolute height/pressure of CO2 in the atmosphere and you insist that Te is equal to the about 4 years residence time as defined by the IPCC. So be it. That is your choice.
The real world formula for the CO2 outflow into the oceans is:
F = k•s•ΔpCO2
Where:
k is the velocity coefficient (wind speed mixing)
s = the solubility coefficient (composition)
and ΔpCO2 the CO2 pressure difference between atmosphere and ocean surface.
See: https://www.pmel.noaa.gov/pubs/outstand/feel2331/maps.shtml
Thus the outflow is directly proportional to the CO2 pressure difference with the ocean surface (and similar in plant alveoles water), not the absolute pressure of CO2 in the atmosphere in your formula (2).
Thus in reality:
Outflow = [pCO2(atm) – pCO2(ocean)] / Tau
Where Tau is the exponential decay rate to reduce a disturbance (like the addition of extra CO2 from whatever source) to 1/e of the initial disturbance.
For any linear process (where the outflow is directly proportional to the height of the disturbance) that is a quite simple formula:
Tau = disturbance / result
Which is independent of the length of the period over which Tau is calculated.
With the above formula, one can calculate Tau for the oceans, because the “disturbance” is known: that is the pCO2 of the atmosphere minus the equilibrium pCO2 of the oceans for the average sea surface temperature. Which is currently around 295 μatm (μatm is similar to ppmv, the latter is in dry atmosphere the former in the atmosphere “as is”). That gives following results in graph form:
https://www.ferdinand-engelbeen.be/klimaat/klim_img/acc_decay.jpg
Which gives a calculated real world Tau of around 50 years.
The influence of temperature on the pCO2 of the sea surface is calculated with the formula of Takahashi, based on near one million seawater samples:
∂ln pCO2/∂T=0.0423/K
See: http://www.sciencedirect.com/science/article/pii/S0967064502000036
Then your use of the residence time as “base” for the reverse formula (2):
The mostly used formula of the residence time is:
Te = L / Outflow
Which is true when Inflow = Throughput = Outflow, although Te = L / Throughput is more accurate if there is a disequilibrium between inflows and outflows.
One may reverse that formula if and only (!) if all fluxes are unidirectional from input(s) via the atmosphere to output(s). Thus with the “classic” model of a container where the inputs dictate the liquid height/pressure in the container and that dictates the outflow.
When cycles are involved, one never, ever, may reverse the formula of the residence time, as that gives false results.
Take the outflow into vegetation: in spring/summer some 120 PgC as CO2 gets absorbed by plants, when temperatures and sunshine go up, largely independent of the current CO2 levels in the atmosphere. To the contrary, the amount of CO2 sucked out of the atmosphere is so large that the CO2 levels in the atmosphere drop with strongly increasing uptake, despite a huge supply of CO2 out of the warming oceans.
The observed influence of the extra CO2 pressure in the atmosphere is only 2.5 PgC/year, based on the oxygen balance. Thus only some 2% of the outflow is caused by the extra CO2 pressure in the atmosphere above the internal CO2 pressure of the plants. 98% of the CO2 outflow into vegetation is completely independent of the CO2 level in the atmosphere…
That implies that formula (2) is completely at odds with reality.
BTW, no need to show lots of formula’s to “define” the real world. If the result of all these formula’s is at odds with simple math like the carbon mass balance, then the simple math wins the contest…
That is part 1…
Dear Ed,
Here follows part 2, about the 13C/12C levels, expressed as δ13C…
No problems at all with your calculations of what remains as low-13C fossil fuels in the atmosphere.
The problem again is with your interpretation of the results of the calculations.
The IPCC indeed says that the full increase of 32% (meanwhile near 50%) of the CO2 as mass in the atmosphere is caused by the human input of fossil CO2.
They don’t say that all the fossil fuel CO2 molecules still reside in the atmosphere. That is your interpretation of what the IPCC says.
What you forgot is that about 25% of all CO2 in the atmosphere is exchanged each year with CO2 from other reservoirs. That is the 4 years residence time. That doesn’t remove one gram of CO2 out of the atmosphere, only replaces fossil fuel low-13C CO2 with 13C richer CO2 from other reservoirs.
How much is exchanged? While both the ocean surface and the biosphere have a rather limited amount of fast-exchanging CO2, the crux of the matter is in the much slower exchange rate, but much larger reservoir of the deep oceans. The point there is that what goes into the deep oceans (especially via the THC near the poles) is the isotopic composition of today, but what comes out near the equator is the composition of some 1,000 years ago.
BTW the IPCC’s Bern model assumes that not such direct exchanges between atmosphere and deep oceans exist.
If all fossil emissions remained in the atmosphere, the current drop in δ13C would be three times deeper than observed. With the calculation of different exchange fluxes between atmosphere and deep oceans, one estimate the real exchange rate of CO2 between atmosphere and deep oceans:
https://www.ferdinand-engelbeen.be/klimaat/klim_img/deep_ocean_air_zero.jpg
The graph can be better (is already some 20 years old) and needs a recent update, but that is not important for now.
What is important is, while only some 10% of the current CO2 in the atmosphere is originally from fossil fuels, the rest of the near 50% increase of CO2 mass in the atmosphere is fully caused by the release of fossil fuel CO2 at near twice that increase, but about 2/3 of the original fossil CO2 molecules now reside in the (deep) oceans and vegetation.
Moreover, with your Figure 4 and Equation 4, you definitely show that the model you used is the classic “lake/bathtube” model, where inputs define the level and the level defines the outflow, without any recycling.
That model implies that the level of a “marker” in the reservoir never can exceed the ratio of that marker in the inputs.
For the fossil fuel content in the atmosphere (and ocean surface), that rule is completely overblown by the facts: over 10% in the atmosphere, over 6% in the ocean surface, with an input between 1.5% and 5% from 1958 to today…
Ferdinand
Dear Ferdinand,
Welcome back and thank you for your detailed comments.
Sorry for your browser problems. I have found Microsoft’s Edge to be by far the best browser out there, and I have tried them all. Edge lets me save over 1000 tabs distributed among five workspaces, all quickly accessible, with no problems, and it saves all these tabs when it reboots Edge.
I will reply to your comments soon.
Ed
A small teasing in between the discussions:
Question: if there was very little inputs of CO2 at all, where will the level of CO2 in the atmosphere end?
Answers:
– According to Equation (2) at near zero CO2 in the atmosphere.
– According to Henry’s law (calculated with Takahashi) at 295 ppmv for the current average SST.
Dear Ferdinand,
Thank you for your comments. My reply below shows your relevant comments as quotations.
You write:
No, I state (2) as a hypothesis. That means it is OK for you to challenge this hypothesis.
No, I derive Te for the atmosphere from IPCC’s own data. The result is Te = 3.5 years.
It is safe to say that the 2007 IPCC carbon cycle data has considered this 2001 noaa data in its published data for the average flow of carbon from the surface ocean to the atmosphere.
Your discussion of wind and solubility details does refute my formulation of IPCC’s carbon cycles. My formulation can easily accommodate these effects by changing the e-times.
However, you have made a critical error in your formulation for carbon flows for use in a systems model of the carbon cycle.
You formulate your flows as a difference of flows in each direction between reservoirs. That is not valid for a systems model and it gets the wrong answers.
In systems models, we must calculate the flows in opposite directions independently.
Each flow is a function of the level of carbon in its reservoir divided by its e-time. It is an error to combine the flows (or pressures) in opposite directions to get a formula for net outflow.
To integrate a systems model over time, we must first use the carbon levels in each reservoir to calculate outflow from each of the six nodes (in the four-reservoir model).
Then, we calculate how these six flows change the four levels.
You write,
No. That is the net outflow. Now try to calculate how your “net outflows” change the six levels. Good luck.
The only way to calculate the change in a level is to use my continuity equation (1) for each reservoir independently – for any selected time step.
You write,
Your graph shows only the delta pressure. This is not sufficient information to correctly calculate the flows in a systems model.
No, it does not. Not only is your calculation faulty but your definition of Tau does not apply to the six Te’s in my carbon cycle model.
In addition, you changed your definition of Tau from Te to something else.
The only time constants that matter in a systems model are the individual time constants for each node in the model. With that information, we can calculate how the system responds, which I do correctly in my published papers.
Temperature can change Te in my formulation.
You have said nothing that disputes my carbon cycle formulation. But I have shown errors in your formulation.
Dear Ferdinand, you are making a big error.
Outflow in (2) is NOT Throughput. Outflow is the flow in only one direction. To get Throughput, you need to add the flows in opposite directions, and these flows do not have the same Te.
I can reverse (2) because it does not depend on other flows, as you incorrectly assume.
The only correct way to calculate the evolution of a systems model is to first calculate each flow from each reservoir. Flows are rates.
Then we use (1) for each reservoir to calculate the rate of change of each level.
Then we integrate the level changes over a chosen time step.
This gives the information to calculate any existing cycles.
Your method is simply wrong mathematically.
My model can use one-month time-steps to simulate flow changes due to vegetation changes.
By the way, CO2 is not “sucked out of the atmosphere.”
My carbon cycle formulation shows all the changes in flows and levels that result from proper physics. My formulation solves all of your problems.
You have not shown there is any error in my formulation. But you have shown that you do not understand my formulation. My formulation follows the standard for systems models, and your formulation does not.
Can you reduce your formulation to an electric circuit?
Dear Ferdinand,
You do not understand my model, even though I explained it.
I show what happens when we combine my (1) with my (2).
The result is Inflow sets a balance level. If inflow is constant, the level moves to the balance level. At the balance level, the outflow equals the inflow, so there is no longer any change in the level.
I did not “forget that about 25% of the carbon in the atmosphere is exchanged each year.” Rather, I fully accounted for that change in my formulas.
Human carbon inflow, if constant, sets a constant human carbon balance level. Natural carbon inflow, if constant, sets a constant natural carbon balance level.
Forget about all your “exchange” arguments because they are wrong. So long as the human and natural inflow remain in the same proportion, their balance levels remain in the same proportion. Thus, I calculated the effect of 13C correctly.
Your problem is that you do not understand my carbon cycle mode.
IPCC’s carbon cycle data that I refence fully accounts for your claims. The outflow of human or natural carbon from the deep ocean equals the level of human or natural carbon in the deep ocean divided by an e-time that is the same for human and natural carbon.
IPCC has properly accounted for all this within the limited accuracy of the available data.
The Bern model is flawed because is assumes H(1) is true.
Well, they don’t remain in the atmosphere. They flow through the atmosphere, setting a balance level equal to their Inflow * Te (4).
Your calculations are in error because you are not using a correct carbon cycle model.
Your statement that I bolded is not supported by any data or model, and it violates IPCC’s natural carbon cycle data.
You misunderstand my figures.
Figure 4 is simply my way to illustrate how inflow sets a balance level and level sets outflow. It should be obvious that I did not intend Figure 4 to illustrate my formulation of IPCC’s carbon cycle model.
For an illustration of IPCC’s carbon cycle, see Figure 3. It shows IPCC’s data for levels and outflows found in Figure 2.
Figure 6 shows the e-times I calculated for IPCC’s natural carbon cycle at equilibrium. Notice the flows in opposite direction are equal, so the net flows between the reservoirs are zero, which is the definition of equilibrium.
An important part of our discussion is to notice that my formulation exactly reproduces IPCC’s natural carbon cycle at equilibrium. That shows it is a basis to calculate IPCC’s carbon cycle out of equilibrium.
Neither you, nor anyone else, has a carbon cycle model that can replicate IPCC’s data at equilibrium. Therefore, neither you nor anyone else has a model that can calculate IPCC’s carbon cycle out of equilibrium.
In other words, my formulation of IPCC’s carbon cycle model, so far, is the only game in town.
Look at Figure 6. This shows IPCC’s natural carbon cycle at equilibrium.
Now look at Figure 7. This shows the percent of natural carbon in IPCC’s natural carbon cycle at equilibrium. 1.4% is in the atmosphere and 2.2% is in the surface ocean. 90.3% is in the deep ocean.
Your data is simply wrong according to IPCC’s own data.
Answer to your question:
If all carbon inflow into the atmosphere stopped, and outflow continued, the carbon level would go to zero.
But that is impossible because we cannot stop the carbon inflows into the atmosphere from land and surface ocean.
Takahashi’s calculation assumes there is an inflow of carbon into the atmosphere that sets the balance level at 295 ppmv.
In summary, your arguments are wrong because:
• You violate required systems model math and structure.
• You misunderstand my formulation of IPCC’s carbon cycle.
• You misunderstand how inflows produce balance levels.
Thank you very much for your input and arguments.
Sincerely,
Ed
Dr. Berry,
While working on suggestions for your article, I thought these comments might be applicable to your ongoing debate with Mr. Engelbeen.
Flux is a general term for transfer processes that are very specifically defined in the fields of electricity, heat transfer, chemical diffusion and reaction kinetics. In the latter, for example, chemical reactions are classified as, zero order, first order, second order, etc. depending on how many reactants affect the rate of reaction. One AI source puts it this way, “Essentially, with first-order, more reactant means a faster reaction, while with zero-order, the reaction proceeds at the same pace regardless of how much reactant is present.” In the context of the atmosphere, this means that natural CO2 “flows” in and out of the atmosphere in direct proportion to the concentration of CO2 in the various reservoirs. This is completely opposite to characterization of CO2 “fluxes” as “completely independent of the CO2 level/pressure.” On the other hand, fossil fuel emissions are essentially zero order, independent of the concentration of CO2 in any reservoir.
At the risk of belaboring the point, flow is also subject to possible misconceptions. Flow through a pipe has units of volume/time, whereas flow of a molecule from one reservoir to another has units of amount/time. Chemical diffusion flux is more specifically defined as amount/(area x time). It may be helpful in these discussions to use language that appropriately discriminates between the specific type of mass transfer being described. I think it useful to replace flux or flow with a more specific term when referring to mass transfer from one reservoir to another with undefined surface areas.
The way Mr. Engelbeen refers to pressure in his June 24 comment makes me wonder if he is conflating atmospheric or PV=nRT pressure with a Henry’s-Law-type concentration difference between reservoirs. He writes, “95% of all CO2 fluxes are just cycling in and out, completely independent of the CO2 level/pressure in the atmosphere. Only 5% is directly pressure difference (with the ocean surface and plant alveoles) dependent, not even depends on the absolute pressure of CO2 in the atmosphere…” That is a grossly false characterization of CO2 fluxes in the atmosphere, which are mostly, if not completely, concentration dependent.
Ferdinand Engelbeen, 6/27/2025, “BTW, no need to show lots of formulas to “define” the real world. If the result of all these formula’s is at odds with simple math like the carbon mass balance, then the simple math wins the contest…” Dr Berry’s formulas are not at odds with simple math if the result of simple math is ambiguous. The simple math assumes no growth in non-fossil fuel CO2 and, as pointed out earlier by others, contains no significant human absorption term. Engelbeen’s argument comprises handwaving assertions devoid of a rigorous proof. It reflects his view of the world, not necessarily the real world. I will gladly invite correction if my view conflicts with the real world.
Once again, “You insist that the outflow is proportional to the absolute height/pressure of CO2 in the atmosphere….” Neither height or pressure have appropriate units to describe mass transfer of amount/time such as Pg C/year or ppm CO2/year between reservoirs. I recommend Mr Engelbeen confirm whether or not the height/pressure he refers to is akin to the “disturbance” of two reservoirs whose concentrations are out of equilibrium.
Jim,
You write “The simple math assumes no growth in non-fossil fuel CO2 and, as pointed out earlier by others, contains no significant human absorption term.”
1. If I say net global uptake in some defined period equls Human Emissions – Atmospheric Accumulation, and that quantity is measured to be positive, where have I assumed no growth in non-fossil fuel CO2?
2. Describe what you mean by the “human absorption term” and give a significant example. [If you start talking about Ed’s “human carbon” you haven’t understood the carbon conservation (mass balance) argument.]
Jim, the net mass transfer of CO2 between the atmosphere and the ocean surface is defined as:
F = k•s•ΔpCO2
Where:
k = the transfer coefficient, which mainly depends of wind speed, which is far more important for the mass transfer between air and water or reverse than any chemical reaction or diffusion speed for in average some 100 meter of ocean surface.
s = the solubility parameter, which depends of the concentrations (of different chemicals) in the seawater.
If both are more or less constant for a certain area of the oceans, then the mass transfer only depends of the local pCO2 difference between the atmosphere and the ocean surface.
See: https://www.pmel.noaa.gov/pubs/outstand/feel2331/exchange.shtml and following sections, very interesting and clear reading…
Their global overview is at:
https://www.pmel.noaa.gov/pubs/outstand/feel2331/mean.shtml
And shows the CO2 transfer as moles/m2/year.
The partial pressure of any gas in the atmosphere is directly proportional to its concentration, at least for an ideal gas, but even for non-ideal gases like CO2 quite similar, as long as the concentrations are low.
Thus for e.g. 420 ppmv CO2 in the atmosphere and 1 bar atmospheric pressure, that gives 420 μatm partial pressure of CO2 in the atmosphere. Parts per million by volume are constant for any gas for their molecular weight, so for a constant molar mass, the volumes of a gas and its partial pressure are equal.
Not exact, as one need to take into account that ppmv is expressed in dry air and μatm is “all in”, thus including water vapor. The sea surface CO2 exchanges by Feely and many others, of course did include water vapor in their calculations.
For the ocean surface the pCO2 is measured from samples by getting the sample in equilibrium with the atmosphere and measuring the resulting pCO2 of the atmosphere. Even continuous (on commercial sea ships): spraying seawater in air and measuring the pCO2 of the air, or bubbling air through the water…
That all means that Berry’s formula (2) can’t be true, as that implies that the outflow is directly proportional to the absolute CO2 pressure in the atmosphere (pressure directly proportional to “level”/concentration), while it is only proportional to the CO2 pressure difference between atmosphere and ocean surface.
To show the difference between the ocean surface – atmosphere CO2 cycle and the influence of pressure:
The IPCC estimates the seasonal CO2 exchange between ocean surface and atmosphere at about 50 PgC/year. That is based on the same measurements and calculations as for the above CO2 transfers.
That is caused by temperature: the ocean surface warms in spring/summer and cools in fall/winter, where the pCO2 of the ocean surface follows the temperature, independent of the CO2 pressure in the atmosphere.
The influence of the increased pCO2 in the atmosphere, is measured (!) as 0.5 PgC/year in the ocean surface. That is 1% caused by the extra (!) CO2 pressure in the atmosphere, 99% caused by the sea surface temperature. Thus the influence of the CO2 level/amount/pressure in the atmosphere on the CO2 output is very modest and stops when atmosphere and ocean surface are in equilibrium, according to Henry’s law, which is at about 295 ppmv for the current average SST.
The upper 100 meter or so of the oceans are called the “mixed layer”, which is in close contact with the atmosphere. The CO2 exchanges between atmosphere and mixed layer are very rapid (half life less than a year) and the carbon mass is not much more than in the atmosphere: around 1,000 PgC, in the current atmosphere some 900 PgC at present.
Another important point is that the ocean surface buffer capacity to absorb CO2 from the atmosphere is limited to about 10% of the changes in the atmosphere. That is called the Revelle/buffer factor.
Why that? According to Henry’s law, a 100% increase of CO2 in the atmosphere should give a 100% increase of dissolved CO2 in the ocean surface. That indeed is the case, but… Pure, dissolved CO2 is only 1% of all inorganic carbon species in the ocean surface. Thus a CO2 doubling in the atmosphere gives an increase of pure CO2 in seawater from 1% to 2%… Of course, there it doesn’t stop, and the following chemical reactions make bicarbonates and carbonates from that CO2, but at the same time H+, making seawater less alkaline. The net result is that a 100% increase of CO2 in the atmosphere is followed by some 10% increase in the sea surface:
See: https://tos.org/oceanography/assets/docs/27-1_bates.pdf Table 2 for the increase of nDIC (DIC = CO2 + bicarbonates + carbonates) and compare that to the increase of CO2 in the atmosphere.
Despite these restrictions, seawater contains orders of magnitude more CO2 than fresh water…
Dear Ferdinand,
We should dispense with a part of your claim that is mathematically wrong. You wrote
“That all means that Berry’s formula (2) can’t be true, as that implies that the outflow is directly proportional to the absolute CO2 pressure in the atmosphere (pressure directly proportional to “level”/concentration), while it is only proportional to the CO2 pressure difference between atmosphere and ocean surface.”
Let’s just do some basic math.
My formulat (2) indeed says outflow is directly proportional to level.
Your formula merely combines two of my outflows to get a net flow.
For example, in my terminology:
F12 = flow from Land to Atmosphere
F21 = flow from Atmosphere to Land
Therefore:
F21 – F12 = NET flow from Atmophere to Land.
Please stop claiming my (2) is wrong because you are looking for net flows. As I already described this in my last comment. My formulation easily calculates net flows.
Ferdinand,
Thank you for the discourse on mass transfer of CO2 between the atmosphere and the ocean surface. I assume you are responding to my objections to your use of height/pressure terminology and my concerns that you don’t appreciate the concentration differences that I allege govern transport processes involving mass transfer to and from the atmosphere and its sinks and sources. I see now that our disagreement will not likely be over terminology in that you seem quite familiar with the processes involved.
The equation, F = k•s•ΔpCO2, can be expressed in another form, dC/dt = ks*(Cs – Ca/K). The latter equation better reflects bidirectional transport and that the ratio of the concentrations at equilibrium equals K. Note that equilibrium does not mean transfer between the reservoirs stops, only that no net transfer occurs. CO2 continues to exchange between the reservoirs in proportion to its respective concentrations in the reservoirs. One of the misstatements you make in this regard is “[Net mass transfer of CO2 between the atmosphere and the ocean surface] means that Berry’s formula (2) can’t be true, as that implies that the outflow is directly proportional to the absolute CO2 pressure in the atmosphere (pressure directly proportional to “level”/concentration), while it is only proportional to the CO2 pressure difference between atmosphere and ocean surface.” That is wrong. Outflow from the atmosphere IS proportional to its CO2 concentration and, likewise, outflow from the ocean (inflow to the atmosphere) is proportional to the ocean CO2 concentration.
Another misleading statement follows soon after, “[seasonal CO2 exchange between ocean surface and atmosphere] is caused by temperature: the ocean surface warms in spring/summer and cools in fall/winter, where the pCO2 of the ocean surface follows the temperature, independent of the CO2 pressure in the atmosphere.” Of course, temperature initiates mass transfer, because Henry’s Law constant K is affected by temperature and disequilibrium results when the equilibrium temperature changes. But it is wrong to claim the resulting mass transfer is independent of CO2 concentration. Mass transfer will proceed in proportion to concentration. This is readily seen by imagining how much faster transfer will occur if the density of molecules near the air/reservoir interfaces is concentrated compared to being relatively dilute.
IPCC estimates at least 80 PgC/year exchanges between oceans and the atmosphere. I would like to know how an “influence” of 0.5 PgC/year is measured and how that relates to the current model Dr Berry presented. As I explained earlier, net transfer will stop at equilibrium, but the gross transfer continues. While CO2 is readily being absorbed in areas turned cold, outgassing abounds in the warming areas elsewhere. In both cases, mass transfer occurs in proportion to concentration differences. I don’t think it’s unreasonable to say that equilibrium is the exception, not the rule, year-round.
I looked into the effect of the Revelle factor some years ago. I think it varies widely from warm to cold waters and is based on carbonate equilibria. I don’t think it translates directly into transfer rates. It’s worth revisiting, however, thank you.
Sorry for the delay… Have been working hard on the Excel flow sheets for the “Berry Challenge” and missed this in between comment.
Let us start with your first equation:
“dC/dt = ks*(Cs – Ca/K). The latter equation better reflects bidirectional transport and that the ratio of the concentrations at equilibrium equals K.”
Yes, but that reflects to concentration and thus pressure of CO2 in the atmosphere and only CO2 concentrations in water, not bicarbonates and carbonates, per Henry’s law. Pure, dissolved CO2 in seawater is only 1% of all inorganic carbon species…
The other 99% of the inorganic carbon species also play a role in the equilibria and not exactly linear. But the pCO2(aq) dependence of temperature can be calculated with the formula of Takahashi: some 4.3%/°C up or down, no matter the initial conditions of temperature or concentration.
Of course, I should have said that the formula of Feely was for the net transfer, no matter the direction, but that formula does not depend of the height of the absolute CO2 pressure in the atmosphere, only of the pressure difference with the ocean surface.
The exchange rate between atmosphere and ocean surface is so fast that the average sea surface pCO2 follows the increase in the atmosphere with only 7 μatm difference…
Dr. Ed made it clear that he calculated the absolute transfers in both directions, resulting in the net transfer between the different reservoirs. The only error left then is the use of Te of 4 years, which is completely at odds with the calculated Tau of 50 years, based on real life measurements.
That difference is caused by the fact that the main (seasonal) fluxes are not one-way from input to output, but simply reverse from output to input half the year, moreover, near completely independent of the CO2 level in the atmosphere, as ocean surface and vegetation simply switch position as source/sink.
See it as a lake where two pumped hydro power stations are at work: each pumping water up to a higher lake at the same time that the other power station uses its own higher lake water to make power. And then reversing the flows. That is hardly influenced by the water level in the lake, and the simultaneous in/outflows hardly influence the water level in the lake… Even so, the residence time, Te, is much shorter than for a lake without power stations as the outflows to the upper lakes is also brought into the equation.
Te, the residence time, is completely independent of the direction of the CO2 flows. Every outflow is counted for.
Tau, the adjustment time, highly depends on the direction of the fluxes, as only the sum of all inputs and outputs is what is of interest for the result: the net change in overall flows, caused by some disturbance in the dynamic system.
Two quite different definitions and calculations, which may give the same result, if and only if, all fluxes are unidirectional, what they absolutely not are in the real world…
The outflow of 0.5 PgC/year into the ocean surface is measured in the ocean waters as DIC, the sum of all inorganic species in the sea surface.
See: https://tos.org/oceanography/assets/docs/27-1_bates.pdf Figure 3 and Table 2 for the increase in DIC over time and compare that to the increase of CO2 in the atmosphere. DIC increases with about 10% of the increase in the atmosphere. With the about 5 PgC/yr increase in the atmosphere, DIC increases with about 0.5 PgC/year as the current atmosphere and ocean surface have near equal carbon content…
About 2.5 PgC/year is absorbed by vegetation, based on the oxygen balance.
5 PgC/year remains (temporarily) in the atmosphere and the remainder (~2 PgC/year) goes into the deep oceans. The latter is near impossible to measure directly, but tracers like CFC’s, bomb spike 14C do support these figure.
With near
Ferdindand,
Thanks for your reply. This discussion is reviving science I haven’t used for a while and it’s enjoyable to discuss with someone looking at things from a different point of view.
With regard to the DIC being 99% of carbon in seawater, their reactions are essentially instantaneous compared to the pCO2 [CO2]aq exchange. I don’t see how that obviates the applicability of my “expanded” Feely equation. Also, I not comfortable with your statement, “[Feely’s] formula does not depend of the height of the absolute CO2 pressure in the atmosphere, only of the pressure difference with the ocean surface.” From my PChem days, I recall partial CO2 pressure as proportional to mol fraction. Gemini says “Partial Pressure of CO2 (pCO2) = (CO2 concentration in ppm / 1,000,000) * Total Atmospheric Pressure (P_total). Feely’s net flux or mass transfer rate is proportional to ΔpCO2 which equals pCO2/Kh – [CO2]aq. As I wrote previously, mass transfer does not stop at equilibrium, only the net transfer. Therefore, mass transfer continues across the interface in proportion to the respective concentrations on both sides.
I’ll pass on commenting about Tau vs a four-year Te for now. The latter seems obvious given the recycling of about 100 ppm/year in the 420 ppm atmosphere. That’s 4.2 years. It follows logically from Dr. Ed’s model. I will continue to investigate why you and others are entertaining a 50-year Tau.
Neither I nor Dr. Ed, I presume, assume that exchanges between the reservoirs are one way. That should be obvious from his model and from my description of the air-sea transport process earlier and how it is physically similar to Feely’s equation. You seem to be stuck on the idea that this process is “near completely independent of the CO2 level in the atmosphere.” On the contrary, what drives mass transfer if not concentration gradients? Seasonal fluxes occur simultaneously on opposite hemispheres. While a warming North Atlantic is outgasing, the Southern Pacific is absorbing and vice-versa.
The lake model seems completely inappropriate to me, especially in the case of the oceans, because the “pump” is nearly totally concentration dependent. The land processes are not so clearly first-order, but surely you can appreciate the CO2 Coalition’s pictures showing the growth rate amplification due to the increasing concentration of CO2. Rather than lakes and fountains, I recommend you envision the basic diffusion model between two volumes separated by a porous membrane. With initially a greater concentration on one side, molecules diffuse across to the less concentrated side. Even before the concentrations are equal, some molecules will diffuse “up stream.” Eventually, at equilibrium, the same number of molecules on each side continue to cross the membrane. Dr. Ed’s four-reservoir model is simply an extension of this situation using the appropriate rate constants between reservoirs to account for the various interfacial barriers and material composition of the reservoirs. The only well-mixed reservoir is the atmosphere, which makes possible estimation of the average yearly inflows and outflows made available by the IPCC, which in turn allows calculation of an e-time of about four years agreed upon by just about everyone.
Your summary of the net mass transfers seems generally consistent with results of Dr. Ed’s model, based on IPCC data, with the exception of the 0.5 PgC/year outflow to the surface ocean. Does the modest 0.5 PgC/year DIC increase allow for the possibility that the majority of the 2 PgC/year going to the deep ocean came from being passed through the surface ocean?
Jim, indeed it is a matter of model…
I was looking at Ed’s model in figure 3 and that is the “classic” model of a container where all fluxes go one-way into the container, increase the level in the container and the level in the container determines the outflow. When outputs equal inputs the level remains the same.
That is the classic “lake/bath tube” model.
The most used formula for the residence time is:
Te = mass / output
For the current atmosphere:
Te = 890 PgC / 215 PgC/year = 4.1 years.
Everybody (including the IPCC) agrees on a Te of around 4 years.
The formula for the adjustment time is:
Tau = disturbance / effect
Where Tau is the time needed to reduce the disturbance to 1/e (~37%) of the initial disturbance.
That formula only is true, independent of the time period over which is measured, if the effect is directly proportional to the disturbance. That is the case for both the net uptake in oceans and vegetation.
Where the disturbance can be a one shot extra CO2 or a continuous increasing source of extra CO2, that doesn’t matter. Tau only depends of the distance of a process to the (dynamic) equilibrium of that process without disturbance.
For the “classic” one-way model, Tau is equal to Te and never can exceed Te. That is what Dr. Ed used.
If there is a cycle at work, which recycles CO2 from the outputs back to the inputs, completely independent of the level in the container, the situation is completely different.
That is the “fountain” model, where lots of water are cycling over the fountain, completely independent to the level in the basin and opening a small supply valve determines the water level in the basin.
The real world is far more like the fountain than the lake: 95% of all CO2 is just cycling in and out, largely independent of the CO2 level in the atmosphere. Only 5% is directly affected by the CO2 pressure difference between atmosphere and ocean surface waters or plant alveoles water.
How much is cycling is only of interest for the residence time Te, but doesn’t affect Tau at all, as that only depends of the net outflow into the other reservoirs and the difference in pCO2 between the reservoirs.
In the case of the “fountain” model, Tau and Te are completely independent of each other…
My colleagues and I are working on a clear overview of the differences between Te and Tau and the results for the different fluxes, including on isotopic decays and the IPCC’s Bern model.
Meanwhile, you can download the sheets that I have made for a similar discussion at a Clintel workshop in Athens last September, where things were worked out already:
https://www.ferdinand-engelbeen.be/klimaat/klim_img/on_the_co2_residence_time.ppsx
——-
Then a few short reactions:
– One can split the Feely equation, but the difference is that the net transfer between atmosphere and oceans can be calculated from observations, while the individual in- and outfluxes are rather estimates with large error margins.
– The same for the transfer between atmosphere and vegetation: individual CO2 fluxes are very hard to obtain, but the overall net transfer is easily calculated from the O2 mass balance.
– The difference between uptake by the ocean surface and the deep oceans…
That is where the IPCC goes wrong: the Bern model assumes an uniform ocean surface at average 7 μatm below the pCO2 of the atmosphere, following the atmospheric increase very rapidly (half time less than a year).
That is true for 95% of the ocean surface, except at the main sink places near the poles, where the cold surface waters are at ~ 150 μatm and the atmosphere currently at ~425 μatm. The opposite happens at the upwelling places near the equator: ~750 μatm for water, ~425 μatm in the atmosphere. That is what drives far more CO2 into the deep oceans than in the ocean surface.
Because of the small average difference in pCO2, the large ocean pCO2 changes due to SST changes over the seasons give near the same CO2 fluxes in and out for the ocean surface, mainly in the mid-latitudes.
Further, watch the absolute CO2 transfer calculations that will follow at the end of this discussion…
Ferdinand,
Dr. Ed uses that simple model to illustrate what pharmaceutical scientists call a one-compartment model with intravenous infusion, dC/dt = Io/V – keC . Io is constant infusion into a constant volume V. The constant, ke, represents the “elimination” rate constant. The sign is negative, because at equilibrium, Io/V = keC representing the situation where inflow equals outflow at the constant level C. Obviously, it doesn’t apply to the multiple compartment Earth, but it illustrates the physical first-order process that governs most mass transport processes occurring in nature. Rearranging Io/V = keC gives 1/ke = CV/Io which is analogous to Te = mass/Io = mass/inflow = mass/outflow. So far so good.
Here is where you lose me. I understand disturbance can be a one-time injection or a continuous input that may or may not be constant. Tau is defined as time to reduce the disturbance to 1/e. What is e? Also, what is the “effect” that is required to be proportional to the disturbance? Finally, what are the equations that show how Tau only depends on the “distance of a process to the (dynamic) equilibrium of that process without disturbance.” I don’t understand what distance means. I interpret dynamic equilibrium as the same situation I described in my two-reservoir diffusion model where the flux is equal, but not zero, on both sides.
Dr. Ed’s simple model uses the equivalent of ke = 1/Te for explaining the concepts involved (at least I presume he does). But the full blown Berry Model uses around six rate constants to demonstrate why, using IPCC’s own estimates, H1 is false.
Using lake or fountain analogies is fine for people to get a feel for what you’re doing, I need more. What are the underlying equations? I completely reject the 95% cycling fountain model, simply because raising the water level should affect the rate of circulation. That doesn’t happen with the fountain model unless you install a feedback mechanism that adjusts the circulation to maintain the level. That is what nature is doing automatically by increasing mass transfer rates in response to the increase in concentration gradients (disturbance).
I wish you well on your progress toward a clear overview of the differences between Te and Tau.
My responses to your short reactions in same order: 1) Of course. 2) Yes, but using Berry-type models, one can draw conclusion about the individual fluxes. 3) You should be rewarded, if not applauded, for working on surface and deep ocean interactions.
Meanwhile, I will review Tau model literature.
David,
In response to your first post addressed to me earlier, JUNE 27, 2025 AT 4:37 PM, I am not familiar with “disequilibrium isoflux” and, frankly, not good at interpreting isotopic carbon data. But I don’t think that necessary to see a deficiency with your simple math compared to Dr Ed’s rigorous model. I did some modelling myself and found results in line with those he presents. His physical model is consistent with my understanding of the first order processes I based my calculations on.
You wrote, “it is an empirical fact, not a model, that net global uptake is positive in the current era. How else do you explain that atmospheric accumulation rates are but half of emission rates? It was sometimes negative in the geological past.” In cooling periods, I can understand negative global uptake. We are in a warming period now. Questioning the relative contribution of human emissions versus natural emissions seems reasonable to me. I don’t think simple math resolves the problem. Perhaps my answers to your later post will help explain.
In response to 2., the human absorption term is the “Ah” that evolved from your comment on JUNE 21, 2025 AT 4:54 PM. You wrote the simple math formula, Cchange = Eh+En-An. Dr Ed pointed out it should be Cchange = Eh+En-An-Ah. Based on your other comments, I inferred that you view Ah as an insignificant quantity attributable to sequestration or other methods of human efforts to remove CO2 from the atmosphere. Correct me if that is wrong. No, what I mean by human absorption is that quantity of fossil fuel carbon that is removed by the same processes that remove any carbon from the atmosphere according to Dr Ed’s Climate Equivalence Principle (2.1). I think this may be Ed’s “human carbon” that you are accusing me of talking about. Quite frankly, I don’t see why you seem to think that me thinking huge amounts of fossil-fuel-sourced CO2 can be removed from the atmosphere by natural processes implies I misunderstand your simple-math mass-balance argument. In simple terms, fossil fuels have gone into the atmosphere, with some remaining there, but most having been removed by natural processes, the land, surface and deep ocean reservoirs. Did it occur to you that, if we stopped burning fossil fuels, most of that carbon would eventually end up on the bottom of the ocean floor never to be heard from again?
In response to 1., suppose nature had emitted blue-labeled CO2 molecules at the same rate as, but instead of, fossil fuels burned by humans. Would you then conclude that blue carbon caused all the positive “net global uptake?”
David,
An additional thought on the “Ah” term. Whereas emissions from nature and fossil fuels can easily be distinguished as En and Eh, “An” might be mistakenly perceived as a conflation of both natural-sourced and human-sourced carbon absorbed only by the available natural processes. To be clear, I consider “Ah” as that fraction of atmospheric carbon removed naturally that was originally a fossil fuel. So if At is the total amount removed in a given time interval, At = An + Ah, where An is the non-fossil fuel carbon removed by natural processes.
Jim,
Progress! What you call “At” has always been “An” to me (and to Ballantyne, et al. and many others), the removal rate of carbon FROM ANY SOURCE from the atmosphere by natural processes. Go through my earlier argument again, with that understanding in mind. Now you should agree that natural processes are on balance removing carbon from the atmosphere, not adding it, because emissions are 2x accumulation rates. Now you should see that mainstream science never treated “human” and “natural carbon” differently, as some allege. (Only Ed tracks them separately, and that caused him to miss the carbon conservation insight.) Now you should see that no assumptions about the constancy of natural emissions are necessary to determine the sign of net global uptake. All you need is good data, which is in hand. And the data says that despite the warming which you think should make net global uptake negative, it is without doubt positive.
The question of the rate at which carbon in the atmosphere and surface ocean equilibrates with carbon in the deep ocean is an interesting and important one. Some analyses claim it takes “centuries”. I am influenced by a recent paper by Schwartz to think it is closer to one century. I agree we should have a more definitive answer on this, to know the consequences of “net zero”.
I don’t understand the point of your blue carbon question.
Let me take another stab at explaining “disequilibrium isofluxes” with a little model:
• Suppose annual human emissions represent 1 unit of carbon.
• Suppose annual atmospheric accumulation is .45 units
o Then net global uptake would be .55 units
• Suppose natural emissions are 20x bigger than human emissions, or 20 units
o Then An (your At) is 20.55 units.
With these numbers, which are reasonable, natural processes could be described as transferring .55 units out of the atmosphere PLUS EXCHANGING 20 UNITS IN EACH DIRECTION. While the balanced exchange does not move any net carbon, it certainly can change the isotopic compositions if one reservoir starts with an excess of an isotope (or of “human carbon”) compared to the other. The flow out of, say, the high C14 reservoir would contain more C14 than the flow into it, and its C14 content would drop even while its carbon content did not change. Note that using C14 as a “tracer” doesn’t work here. The exchange effectively erases differences. This is why I say, “so what?” when Ed points out the present atmosphere does not have much “human carbon” in it. That by no means says that human emissions are not the cause of the rise. We know they are from the mass balance argument.
David,
I never thought net global uptake negative and I am not questioning that net global uptake has been positive since the beginning of the industrial era. I was only interpreting your statement, “It was sometimes negative in the geological past.” I am questioning the relative contribution of human emissions versus natural emissions. You are arguing a black and white, all or none scenario, where any increase in atmospheric carbon must be blamed totally on fossil fuel emissions. I will try to explain how a potential growth in natural emissions competes with that of fossil fuel emissions. I challenge you to provide the data, not a mass balance assertion, to support a counter-argument.
Let me demonstrate how simple math can be used to disguise the facts and mislead. Your math balance equations do not constrain the magnitude of the natural emissions and absorptions, because they don’t take into account additional equations that do. You started going there by including the fact that natural emissions are 20 times human emissions. I will address this alternatively using the additional known annual estimates of total CO2 absorbed. Based on your 2024 numbers quoted [June 22, 2025 at 11:15 am] for human emissions (41.4 GtCO2 = 5.30 ppm) and net global uptake (19 GtCO2 = 2.43 ppm), the simple math, Cchange = Eh – (net global uptake), becomes Cchange = 5.30 – 2.43 = 2.87 ppm. In 2024, I estimate CO2 in the atmosphere was 430 ppm. If about a fourth of that was absorbed that year, based on an e-time of 4 years and the corresponding rate constant of 0.25, that equals a gross uptake (An) of 107.5 ppm. With net global uptake = An – En, then En = 107.5 – 2.43 = 105 ppm. If the atmosphere contained 5% of human-sourced carbon in 2024, then the amount of human-sourced carbon would have been about 5.4 ppm, slightly more than was emitted. In the same year, the non-human-sourced carbon absorbed could be estimated to be 102 ppm (95% of An), which is even less than the natural emissions that year. Your normalized human emissions = 1 scenario gives virtually the same results, i.e., terrestrial sinks remove annually slightly more human-sourced carbon from an atmosphere which contains about 5% of human-sourced carbon than is emitted into that atmosphere. Likewise, slightly less “natural” carbon is removed annually compared to the source emissions. Natural emissions exceeding what is absorbed annually contributes to the accumulation of CO2 in the atmosphere.
As I admitted, I’m not equipped to judge isotopic arguments. However, I’m not at all moved to take you seriously with statements like “the exchange effectively erases differences” and “We know [human emissions are the cause of the rise] from the mass balance argument.”
Jim
Along with mass balance, the isotope arguments are an essential part of the analyses. You will not understand atmospheric carbon, and the flaws in Ed’s work, without understanding them.
Think of the disequilibrium isofluxes as simply mixing the carbon in two reservoirs. By analogy, if one reservoir started with 20 proof whiskey and the other with 30 proof, balanced exchanges between them would tend to erase the difference. Ed has also struggled to understand this, and a couple of years ago a flawed Health Physics paper by Skrable also overlooked the process. That paper correctly pointed out that the present atmosphere’s C14 content was way too high for the CO2 increase from pre-industrial levels to all be C14-devoid human emissions. If you like, it was an experimental confirmation of Ed’s calculations. But the continuous mixing means that the present composition is not a definitive quantity. The Seuss effect (look it up) is much smaller than naively inferred without considering disequilibrium isofluxes.
Dear Jim,
Thank you for your comments that show you understand the human carbon cycle much better than David
Andrews does.
My post above properly describes how to interpret the flow of carbon-14 isotopes. David does not get it. So, don’t let him confuse you.
Ed
David Andrews,
I am studying the isotopic issues applicable to the current discussions. I started reading a Skrable paper: https://cdn-links.lww.com/permalink/hp/a/hp_2022_05_31_skrable_22-00080_sdc1.pdf
In the first paragraph under “Derivation of equations for Pathway 1,” I read “The sign of DCNF(t) can be positive or negative depending on whether or not there is a net change in the activity per unit volume of the atmosphere in any year since 1750, which is proportional to the product C(t)
.”Does this make sense to you?
Jim,
I am home after several days of travel and can focus and be more responsive to the first and second paragraph of your June 28 post. (As it happens, I was in Calgary, Alberta at the NW American Physical Society meeting, and my trip home yesterday took me through Big Fork, MT, Ed’s home. I considered looking him up to see if any birthday cake remained but didn’t.)
I agree there are issues in attributing the “full cause” of atmospheric CO2 rise to human emissions. I usually just describe the mass-balance argument as showing that natural processes are removing more carbon from the atmosphere than they are adding. My example of some ambiguity comes from the Ballantyne paper that I have referred to previously. This paper plots net global uptake from 1960 to 2010. There is a clear increasing trend, roughly proportional to human emissions, that is not surprising. The more CO2 we put into the atmosphere, the more nature redistributes elsewhere. But there are deviations from the trend. The largest appears to be associated with the 1991 eruption of Mt Pinatubo when a temporarily cooler world showed an increase in net global uptake. We cannot say how much natural emissions went down (because of less hot water), or absorption went up (because of more cold water). Presumably both changed. In this case, a natural event reduced the rate of increase. I would submit, however, that perturbations like this should not change our conclusion about the cause of the dominant trend, even if other factors are at work on the details.
I do not dispute your numerical calculations which show a large fraction of “human carbon” being removed from the atmosphere and net “natural carbon” being put into the atmosphere by natural processes. In fact, these calculations are a good illustration of what I have been trying to explain to you. Your mistake is in the sentence “Natural emissions exceeding what is absorbed annually contributes to the accumulation of CO2 in the atmosphere.” Perhaps surprisingly, no they do not. You will notice that “human carbon” is leaving the atmosphere, where its concentration was no doubt higher than in land/sea reservoirs. You will notice that “natural carbon” is also going from a higher concentration reservoir to a lower concentration one, i.e. towards the atmosphere. This should remind you of disequilibrium isofluxes, which can change the type of carbon in a reservoir without changing the amount. The total carbon level changes are determined by the net global uptake. The balanced exchanges only modify the composition.
Jim,
Here is a link to my comments on the Skrable paper. Their derivations of specific activity dilution formulae were fine. But like Ed, they don’t appreciate the effects of balanced exchanges between reservoirs which can change isotopic composition without changing levels.
https://pubmed.ncbi.nlm.nih.gov/36719939/
David,
You wrote, “I usually just describe the mass-balance argument as showing that natural processes are removing more carbon from the atmosphere than they are adding.”
I think this is the crux of the whole problem. What data actually nails that down? In any given year, about 20 times more natural carbon goes into the atmosphere and a similar amount (+/-) natural mixed with a little industrial carbon comes out. I use the term industrial carbon, because I found it defined in a “old” Keeling paper and it sounds better to me than fossil fuel or human-sourced carbon, but it’s meant to mean basically the same thing. Getting back to the relative amounts transferred question, how do you know the natural source is sometimes, or even often, more than the natural amount removed when corrected for the “industrial” share removed?
You addressed this with the Mt Pinatubo example and then you concluded, “I would submit, however, that perturbations like this should not change our conclusion about the cause of the dominant trend, even if other factors are at work on the details.” The problem is that statement is conjecture and devoid of proof that in almost every year since 1750, natural emissions have not been increasing above the previous year.
In the next paragraph, you denied that natural emissions exceeding natural carbon removed would cause any accumulation and asserted that, “The total carbon level changes are determined by the net global uptake.” Before industrial carbon began being introduced, the nominal CO2 concentration was about 280 ppm. Supposing natural carbon began exceeding the previous years emissions. Wouldn’t you agree that net global uptake in those years was negative and natural carbon was causing an accumulation?
Due to the lateness of the hour, I will review your Skrable comments and reply tomorrow.
David,
In your letter to Health Physics, commenting on Skrable’s Table 2a, you correctly note (in 1.) that cumulative industrial emissions exceed the atmospheric increase in CO2, but incorrectly infer 1) that ocean and land reservoirs could not partially have contributed to the rise in CO2 and 2) that industrial emissions are the total source of the rise. In fact, your admission, that ocean acidification (etc.) are consequences of overflow of anthropogenic carbon out of the atmosphere, explains why the industrial emissions do not accumulate to the degree you imagine. According to your Table 1, the amount of industrial carbon sinked (1,590-322) was 1,268 GTons CO2.
In the following paragraph (note 2.), You wrote, “The dilution from earlier decades’ emissions has largely been erased by mixing.” But the specific activity shown in 2000 on Skrable’s Table 2a, 12.80, is significantly less than the original 14.00 in 1750. That’s a far cry from largely being erased, no? Equating Skrable’s present day “fossil component” with only the most recent industrial emissions swaps the dilution which occurred in the years prior to 2009 with a relatively minor amount of dilution that has occurred since. Your handwaving argument seems like sleight-of-hand.
“What happens in the atmosphere does not stay in the atmosphere.” That seems more descriptive of the Skrable and Berry accounting than the scenario you promote.
Jim,
Explain to me how net sinks can have “partially contributed to the rise in CO2”. In your earlier numerical exercise, you showed that natural processes could raise the quantity of “natural carbon” in the atmosphere, but only when a larger quantity of “human carbon” left the atmosphere. The only amount of carbon that matters is the total carbon. I hope you are beginning to understand that analyzing these two quantities of carbon separately is a fool’s errand. When the equivalent of disequilibrium isofluxes exchange human carbon for natural carbon without changing the levels, who cares? If the level of “human carbon” in the atmosphere today is small (and it is) that tells us very little.
You have referred vaguely to an increase in ocean outgassing with temperature, while ignoring the rising influx of carbon to the ocean simply from higher CO2 partial pressures. We agree, I think, that like the atmosphere, the surface ocean has more carbon in it now than 75 years ago. We haven’t discussed biomass, but the literature says it has grown, and there is more carbon in terrestrial biomass than 75 years ago. A recent Science article tabulated other caches of carbon : in landfills, behind river dams, etc. Where is there LESS carbon now than 75 years ago? Obviously in depleted fossil fuel reserves. Tell me if you have another hypothesis on where all the carbon is coming from.
David,
Ocean and land reservoirs are both sources and sinks to some degree. Depending on the magnitude in any given time period, they may be net one or the other. An obvious example is that of outgassing during a particularly hot summer in the southern Pacific Ocean. Gradually warming oceans likely mean greater outgassing year to year. Deforestation and other plant decomposition are two sources that could contribute to a rise in CO2 in any given year that the corresponding sinks are less in magnitude. But I will never convince you by these anecdotal arguments. The only way you will see how nature is contributing to the growth in CO2 is to investigate a mathematical model, input the known emissions and rate constants, and try to match the observed Mauna Loa data. I could only get a good correlation by including a growth in natural emissions or a declining sink rate. There is no physical reason to expect the latter. The former is easily explained by a warmer world and an exponentially increasing population.
You ask, “Where is there LESS carbon now than 75 years ago?”
There isn’t, at least not than can be measured quantitatively. Apparently, we both agree that the industrial carbon is not largely left in the atmosphere. Your terrestrial biomass growth is one sink. The oceans are an obvious second. The deep ocean is basically an infinite sink. We also agree on where the extra carbon is coming from. The only disagreement is on how much of the observed increase in atmospheric CO2 is caused by industrial carbon or an additional natural component.
Jim,
With all respect, I think a program to add up all the natural emissions AND THE NATURAL ABSORPTIONS OF ALL CARBON TYPES is hopeless. The indirect measurement of absorption – emissions, deduced from industrial emissions – atmospheric accumulation and appropriately called “net global uptake”, is the best that we can hope to do. The data on that is solid; see the previously referenced Ballantyne et al. Nature article and the tight constraints on this quantity, especially when integrated over 50 years.
I am puzzled by your statement “We also agree on where the extra carbon is coming from [ fossil fuel reserves]. The only disagreement is on how much of the observed increase in atmospheric CO2 is caused by industrial carbon or an additional natural component.” If we agree that moving carbon previously sequestered in oil/gas/coal reserves into the atmosphere, and from there into ocean and biomass stocks, (i.e. into the fast cycle), aren’t we done? Apparently, you think that the industrial carbon content of the present atmosphere is relevant, even though you understand that equilibrium isofluxes (essentially mixing) erases past differences without effecting carbon levels. Yes, I am puzzled.
David,
People have been working on mathematically accounting for all the carbon for a long time. Skrable and Berry are not the first. Simple math is not “the best that we can hope to do.” As I wrote before, simple math is ambiguous.
Here are a couple papers in my “file” on carbon dioxide models. “A box diffusion model to study the carbon dioxide exchange in nature,” H Oeschger et al., 1974. Even earlier, “Changes in the Carbon Dioxide Content of the Atmosphere and Sea due to Fossil Fuel Combustion,” Bolin and Eriksson, 1959.
“…aren’t we done?” We can quit anytime as long as you admit defeat! (Just kidding). Communication is a miracle, one of my mentors used to say.
This whole discussion is about how much of the increase in CO2 since the beginning of the industrial era has been CAUSED by industrial emissions. Some, like you I gather, think all 33% was caused by them. Dr. Ed is claiming only 8% percent. I have tried to explain how the growth in natural emissions since 1750 may account for the other 25% of the rise by increases in ocean out gassing and extra decomposing vegetation due to population growth. In other words, in 1750, I estimate natural emission recycling was on the order of 136 PgC/year. Today it could be 204. Let me know if you are still puzzled.
Jim,
The simple math shows unambiguously that natural processes remove more carbon from the atmosphere than they add. Your calculation showed that in the process of LOWERING total carbon in the atmosphere, natural process can add “natural carbon” at the expense of “industrial carbon”. So what? Both are greenhouse gases.
Now you say “extra decomposing vegetation” is a source of atmospheric carbon growth. You must be a disciple of that crazy Greek hydrologist, Demetris Koutsoyiannis, who says the same thing. Do you think trees make carbon? No, they do not. They remove it from the atmosphere when they are growing and return it to the atmosphere when they die and decay. The little formula defining “net global uptake” incorporates carbon conservation. You need to ask yourself in all the instances where you identify possible emitters, what the source of the carbon they emitted was. That too enforces carbon conservation. If you discipline yourself to do that you will be a step ahead of Ed and Demetris.
David,
“So what, both are greenhouse gases” is not the topic of this discussion, which is H1. Whether or not increasing CO2 causes global warming would be H2.
I haven’t seen the work of Koutsoyiannis, but I’m going to add him to my todo list, because I need to be able to document reality to support my speculations. Thank you for that. Compared to 1750, today there are 8 times more people in the world cutting down trees and plowing fields, which may prematurely release CO2 into the air. Thus adding more CO2 than would otherwise be if nothing had changed since 1750.
Asking myself what the source of the carbon was from all of the emitters is the discipline of carbon cycle modelers. I’m way behind Ed and others and trying to catch up. I encourage you to get in the game. It’s hard, but fun.
Jim,
Please read some peer-reviewed science too. I am sorry I put you on to Kousoyiannis.
Ed,
(Below, I repeat your responses that warrant a comment to my comments followed by my responses to yours.) Your responses are indicated by “Ed-” at the beginning of each.
Ed – Yes, but that is completely irrelevant, as my equations show.
Me – I find your response that its completely irrelevant startling. You simply refuse to acknowledge that it tells you nature isn’t a net global source of atmospheric CO2. You have a cognitive bias against accepting that reality.
Well, you have not computed global mass balance. In fact, you have no equations or math at all and you have not identified any errors in my math. Your equations and math don’t match reality.
First you say I have no equations or math, and then you say my equations and math don’t match reality. Here’s the reality.
As Cawley (2011) and others since then have demonstrated with empirical data, the rate of change in the mass of carbon in the atmosphere, dC/dt, equals the sum of global human emissions and global natural emissions of carbon from the oceans and land combined minus global environmental uptake into the oceans and land. As I mentioned in my previous comments, the human sink of atmospheric CO2 is not large, so it’s not a significant factor in the global uptake of carbon.
This relationship between the changes in the mass of atmospheric carbon and the flows of carbon in and out of the atmosphere is an approximation of the global atmospheric carbon mass balance budget. The net global environmental flux of carbon, which is the difference between the mass of carbon emitted globally from the oceans and land combined and the mass of carbon taken up globally by the oceans and land combined, is simply calculated from the difference between the rate of change in the mass of carbon in the atmosphere and human emissions of carbon, both of which are known with a high degree of certainty. And contrary to what you believe and others have contended, this calculation does not require knowing the uncertain estimates of the natural emissions and uptake of carbon to and from the atmosphere. The mass balance analysis using long-term data on global human carbon emissions and changes in the mass of carbon in the atmosphere unambiguously shows that nature has acted as a net global sink of atmospheric carbon over the past 60+ years, not a source. If you don’t accept this reality, then it isn’t because the mass balance of carbon doesn’t show it to be real. That your model conflicts with this reality demonstrates your model is wrong. Natural carbon emissions are not the cause of the increase in atmospheric CO2.
Ed – That’s because the IPCC scientists forgot to account for the outflow of human CO2. I accounted for that outflow using IPCC’s own data and thereby proved there is no “missing CO2.”
Me – It’s unfortunate that you persist in misrepresenting what IPCC reports say. The scientists who wrote the carbon cycle portion of IPCC reports didn’t forget to account for the outflow of human CO2 from the atmosphere. They didn’t account for it because, as you well know, it’s impossible to distinguish between naturally-sourced and human-sourced CO2. For this reason, the outflow of CO2 is reported by the IPCC without regard to the emission source or sources. You have repeatedly reminded readers in your posts that it’s impossible to distinguish between natural- and human-sourced CO2. But you still ignore and instead, pursue your misguided effort to separately model the cycling of human-sourced and naturally-sourced carbon. You have to model the total carbon in the cycle, regardless of its source. Once CO2 is emitted, it’s impossible to know and track its source.
Ed – As I have shown, human CO2 flows out of the atmosphere following the same rules that determine how natural CO2 flows out of the atmosphere. IPCC’s own data show how natural CO2 flows out of the atmosphere. If natural CO2 did not flow out of the atmosphere, then natural CO2 could not have stayed at 280 ppm as IPCC assumes.
Me – You misrepresent what IPCC’s data show and misunderstand my point and what I mean by “human CO2 sink”. The only part of the human carbon cycle shown by the IPCC is the human-sourced CO2 emitted from fossil fuel combustion, cement production and land use and land cover changes. It doesn’t show any human-sourced carbon outflow from the atmosphere for the very reason stated above. What the IPCC has done is show the contribution of the equivalent of human-sourced CO2 emissions on the natural carbon cycle, which is the cycling of both natural and human-sourced CO2. Secondly, “human CO2 sink” doesn’t mean atmospheric CO2 that originated from human activities, such as fossil fuel combustion. It refers to the direct removal of CO2 from the atmosphere by engineered means, e.g., CO2 scrubbers. The global magnitude of direct carbon removal by humans is not large enough to account for a significant fraction of the missing CO2.
Also, I wasn’t suggesting or implying that CO2 from human sources flows out of the atmosphere at a different rate than CO2 from natural sources. I agree that naturally-sourced and human-sourced CO2 are identical and flow in and out of the atmosphere following what you call the same rules. But you still haven’t explained how nature can be a net global source of atmospheric CO2 when the rise in it is less than what is being emitted into it globally from human activities. And I never questioned whether carbon emitted from natural sources flows out of the atmosphere. Your comment seems to suggest that I have claimed it doesn’t. It flows out at the same rate as human-sourced carbon. The fact that the pre-industrial level of atmospheric CO2 was around 280 ppm and had remained relatively constant simply shows the global emissions and uptake of atmospheric CO2 were roughly in balance. But that is no longer the case.
Ed- That so-called “IPCC’s conclusion” is a result of IPCC’s assumption of this conclusion, therefore circular reasoning.
Me – IPCC’s conclusion is based on a vast body of independent lines of scientific evidence, including the mass balance of carbon in CO2. And there is consilience of the multiple lines of independent evidence that has come from unrelated sources. That evidence has held up over time and has only grown stronger. For example, the estimated change in the inventory of CO2 stored in the world’s oceans over the period from 1994 to 2007 by Gruber et al. (2019, published in Science ) shows a net increase of almost 124 Gt CO2. It is equivalent to an average net uptake rate of 9.5 Gt CO2 per year going into the oceans globally from the atmosphere. The estimate of the net ocean uptake of CO2 globally over this 13-year period represents 34% of the global CO2 emissions from human activities over the same period. These results, which are based on direct measurements of changes in the inventory of CO2 in the world’s oceans, are further evidence that the oceans are a net global sink of atmospheric CO2, not a source.
Ed- That so-called “evidence” is a result of assuming H(1) is true. Circular reasoning.
Me – If you bother to look at the evidence, you will find it isn’t based on that assumption. It’s based on published and peer reviewed results of research intended to develop a quantitative and predictive understanding of the cause of rising atmospheric CO2, including where all of the CO2 emitted globally is going and how much human emission sources are contributing to the global increase.
Ed – Delta14C has decreased since 1970 and has approached its original balance level of zero (that I call 100 percent for public understanding). But you miss the key point, which is that the curve of Delta14C shows its original balance level has remained the same (as least within a few percent). And that shows the amount of human CO2 in the atmosphere is between zero and a few percent.
Me – I don’t understand your insistence on calling the pre-bomb ∆14C levels of atmospheric CO2 a balance level. The pre-bomb ∆14C values were declining, not constant, which means ∆14C wasn’t in balance before nuclear weapons testing began in the 40’s.
You have previously claimed that nature maintains a balance level of ∆14CO2 at or near zero. But you offer no theory or explanation of how nature maintains such a balance level. The natural production of 14C is independent of the cycling and natural emissions of carbon. Moreover, published paleo records of ∆14CO2 show that it has varied widely before humans were around and has seldom been at or near zero over the past 500,000 years. If nature maintains a balance level of ∆14C at or near zero, then please explain why has it varied so widely in the past when nature was doing its’ things? The only plausible way for a balance level of ∆14C to exist is to have extended periods when the natural production of 14C happens to coincide with a constant level of CO2 in the atmosphere. But that would only occur under coincident circumstances, not because of natural processes that maintain a constant level.
Thirdly, It is impossible to understand the basis for your claim that the because the ∆14C has remained near its “balance level of zero” proves that the human balance level of CO2 in the atmosphere is less than 2 percent of total CO2 in the atmosphere. The ∆14C of atmospheric CO2 is still declining in the northern hemisphere, not remaining near what you call “its balance level of zero”. Data in a figure in a 2023 paper by Graven et al.(Radioisotope Dating: Going Back in Time) published in Nature shows this. If you can’t access the paper online, you can find the figure on the Scripps CO2 Program Isotope Data Gallery website.
The fact that ∆14C has still declining in the atmosphere and declining to less than zero in the northern hemisphere doesn’t tell you the fraction of CO2 in the atmosphere that originated from human sources. And given that it’s impossible to know that fraction at any point in time, your claim to have proved what it is, based on the ∆14C data or on any empirical data or model for that matter, is simply not credible.
By “human balance level”, I assume you mean the fraction of CO2 in the atmosphere resulting from human emissions at any point in time, which, of course, is impossible to know.
Lastly, that the ∆14C of atmosphere CO2 in the southern hemisphere has not yet declined to levels observed in the northern hemisphere is likely a result of the lag in inter-interhemispheric mixing of CO2. Most of the human-sourced global CO2 emissions occur in the northern hemisphere, and it is well established that the CO2 concentration in the southern hemisphere in the same year is consistently less than in the northern hemisphere due to this lag in inter-hemispheric mixing of atmospheric CO2.
Ed- You may not fully understand this because you are not thinking in term of balance levels, which I define in my equations.
Me – Your fixation on balance levels is nonsense. Neither CO2 or ∆14C are in balance or have been for a long time.
Ed- Inflows set balance levels and levels approach their balance levels. The human CO2 inflow sets a balance level that would be 33 % of the CO2 in the atmosphere if H(1) were true. Meanwhile natural CO2 inflow sets its own balance level and Delta14C tracks this natural inflow. This simple reasoning about two independent inflows includes isotropic dilution, which is simply the ratio of the human CO2 balance level to the total of natural and human balance levels.
Me – Again, your argument is senseless for several reasons which I have addressed above. Also, please explain your statement that “∆14C tracks this natural inflow”. Are you assuming this or asserting that natural CO2 inflow alone accounts for or explains the observed changes in ∆14C? Below, you assume, albeit incorrectly, that the decline in ∆14C is due to both wash out of 14C from the atmosphere and isotopic dilution from inflow of CO2 that has a “natural ∆14C” level. Your claim and the assumption below are inconsistent and both are false.
Ed – I assume only that the high Delta14C caused by the bomb tests flows out as natural Delta14C CO2 flows in. This, in time, washes out the high Dela14C and lowers the Delta14C level to the balance level set by the new inflow. This assumption is independent of any human CO2 inflow with its Delta1C of -1000 (that I refer to as zero percent for public communications).
Me – But Ed, the outflow of 14C (which is also outflow of ∆14C) from the atmosphere has no impact on the ∆14C of CO2 remaining in the atmosphere. It only reduces the 14C concentration in the atmosphere. You forget that ∆14C is the ratio of 14C to total C. So, your assumption that ∆14C flows out of the atmosphere, washes out the high ∆14C, and lowers it to a balance level set by a new inflow is nonsense. The ∆14C of CO2 in the atmosphere is affected by the ∆14C of CO2 flowing into the atmosphere from natural and human sources, not by the outflow of 14C from the atmosphere. That you can curve-fit an exponential function to the post-bomb decline in ∆14 is not evidence that your model explains the cause of the decline.
Ed – I explained my only assumption above, that new natural CO2 inflow gradually replaces the high Delta14C caused by bomb testing. My carbon cycle equations explain how this happens. If there is a claim that isotopic dilution follows different rules, then such rules are wrong.
Me – As I stated above, isotopic dilution is the only explanation for the decline. Natural CO2 inflow contributes to the isotopic dilution, but it alone doesn’t fully account for the decline. It isn’t necessary to assume a “new natural CO2 inflow” to explain the decline. And if not by isotopic dilution, then please explain what you mean by “new natural CO2 inflow gradually replaces the high ∆14C”. Isotopic dilution reduces the 14C:total C ratio of atmospheric CO2 by increasing the amount of CO2 with a lower ∆14C. It doesn’t replace anything. .You simply make things up to explain things and make untestable assumptions to fit your narrative. By the way, what is the source of this “new natural CO2 inflow” and what is its’ ∆14C?
Ed- It sounds to me that you agree with my carbon cycle model. I think what you are saying is what I describe with my equations.
Me- But you are assuming a “new natural CO2 inflow” and rejecting human CO2 inflow as a contributor to the isotopic dilution of ∆14C. You are having trouble keeping your story straight.
Ed- I agree that this would happen because the high Delta14C natural carbon would flow into all carbon reservoirs. This does not conflict with any of my descriptions.
Me – I don’t know what you mean by “high Delta natural carbon. The high delta carbon is certainly not natural. It was produced from nuclear weapons tests. And, as I previously stated, the flow of high ∆14C out of the atmosphere has no impact on the ∆14C of CO2 that remains in the atmosphere. Don’t you understand this. You’ re misinterpreting data to fit your narrative. I don’t believe you really understand what you’re writing about.
Ed – My equations describe how the carbon flow between the reservoirs. My description is simpler (and more accurate) than yours because I treat the human and natural carbon cycles independently and let them follow the same rules.
Me – Being simple doesn’t make it either correct or accurate. Your equations don’t reflect the actual reasons for the observed post-bomb decline of ∆14C. As to your claim of your description being “more accurate”, it amazes me that you would assert this when, with the exception of the gross emissions of human-sourced carbon, it’s not possible to distinguish between carbon flows from natural and human sources.
Ed – I disagree with your conclusion and David Andrews’ conclusion on this. My explanation is much simpler. The reason 14CO2 has increased is simply because the inflow of natural CO2 has increased while it Delta14C has remained at or near its zero value (that I call 100%). The reason Delta14C is a useful measure of carbon age is because Delta14C has remained almost constant as the CO2 level has changed. If the CO2 increase since 1850 is indeed almost all natural, we would expect the Dela14C to remain near zero, causing 14CO2 to increase in the same proportion as 12CO2. This is exactly what has happened. My explanation wins by Occam’s Razor.
Me – Wow! You have to resort to Occam’s Razor as the decider? But your explanation simply doesn’t hold water because it’s not a credible explanation of the source of the increased 14CO2 in the atmosphere. The source is bomb 14C that is being reemitted from ocean surface water and terrestrial systems to the atmosphere caused by a change in sign of isotopic disequilibria of 14C between the atmosphere and both ocean surface water and the terrestrial biosphere.
There is a significant effect of isotopic disequilibria of 14CO2 on isotope exchange between the atmosphere and ocean by influencing not only the rate and extent of exchange, but also its direction. When the ∆14C disequilibrium between ocean surface water and the overlying atmosphere is large, such as during the peak testing of nuclear weapons, the isotope uptake and exchange is rapid. As the ocean and atmosphere approach isotopic equilibrium, the exchange slows and will eventually stop when equilibrium is reached. It can even be reversed if ∆14C of atmospheric CO2 is driven below that of CO2 in the atmosphere. A paper by Levin, et al. 2021. (Radiocarbon in Global Tropospheric Carbon Dioxide. Radiocarbon, Vol. 64 (3): 781-791) shows the annual rate of change in ∆14CO2 in the global troposphere during and after the period of nuclear weapons tests in the 50s and early 60s. The annual rate of decline is greatest immediately after the peak. It then varies as it approaches, but never reaches zero, indicating that, according to the last data points, isotopic equilibrium had not yet occurred between the two global carbon sinks (ocean and land) and the troposphere. As I previously indicated, more recent data show the ocean and atmosphere have reached isotopic equilibrium. This is shown in a 1996 paper by Nydal and Gislefoss (Further Applications of Bomb 14C As a Tracer in the Atmosphere and Ocean. Radiocarbon, Vol. 38 (3): 389-406.).
But this has since changed. The ocean and atmosphere and are now back in isotopic disequilibrium of ∆14C as a result of isotopic dilution of atmospheric CO2 from emissions of 14C-free CO2. It has pushed atmospheric ∆14C below that of ocean surface water, causing the ocean to now become a net source of atmospheric 14CO2, rather than a sink. It is why the concentration of 14C in the atmosphere is increasing rather than decreasing.
Me – Your story lacks both explanation and an empirical basis; mine does not. And when Occam’s Razor doesn’t apply, you have to accept Hickam’s Dictum.
Ed – As I explain, I don’t buy David’s explanation because my explanation is better.
Me – Better because it fits your belief, not because it’s supported with empirical data, logic, and sound inductive and deductive reasoning.
Ed – That is a nice bed-time story, but it does not fit the data.
Me – Sorry Ed; it’s fully consistent with empirical data.
By the way, a belated Happy 90th Birthday! They say wisdom comes with age; sometimes age shows up all by itself.
Dear Dr. Ed,
To start with, late congratulations with your 90th birthday!
Then about your formula (2):
Outflow = L / Te
where Te = 4 years.
As already said, the largest CO2 (seasonal) flux is the absorption of lots of CO2 by vegetation in spring/summer. That is about 120 PgC/year of the total 210 PgC/year carbon that cycles in and out the atmosphere, as estimated by the IPCC.
Thus in spring/summer, over half the total output is removed by one process, near completely independent of the amount of CO2 that at that moment resides in the atmosphere. Only dependent of sunlight and temperature. Half of equation (2) already refuted by reality.
I don’t see any reason to calculate CO2 fluxes in both directions between the different reservoirs, when the net difference between these two fluxes is quite exactly known. The height of the fluxes is of zero interest, even if these double or halve over time, only the difference between them affects the levels in a reservoir…
Moreover, both the net increase of carbon (derivatives) in the ocean surface and vegetation are either measured (ocean surface DIC) or calculated (vegetation, via de O2 balance). So, no need to calculate any individual CO2 flux in or out between the atmosphere and the two main reservoirs.
The essence of this debate seems to be the kind of “model” that you have in mind of the real world.
In every part of your work, it Is clear that you use the “classic” one-way container with unidirectional inputs going into the container and outputs out of the container, where the inputs set the balance level within the container. That is the “lake” or “bath tube” model.
In that case, and only in that case, the residence time (Te) of about 4 years and the adjustment time (Tau) are equal and only then one may reverse the formula for the residence time in equation (2) as you have done. Your classic model is reflected in your Figure 4.
I have a similar view on this classic process, as that is quite common in chemical engineering, here made clear in the “lake model”, I used for a similar discussion last September in Athens:
https://www.ferdinand-engelbeen.be/klimaat/klim_img/classic_view.png
In reality, large parts of the carbon cycle are just cycling in and out of the atmosphere, largely independent of the CO2 level in the atmosphere. In that case, the residence time Te and the adjustment time Tau are completely independent of each other, as also can be calculated from the observations.
Te for CO2 in the atmosphere still is about 4 years, Tau gets about 50 years.
The around 50 years adjustment time was already calculated by Peter Dietze in 1997 in a discussion with Fortunat Joos, the inventor of the Bern model which the IPCC uses:
https://www.ferdinand-engelbeen.be/klimaat/klim_img/Dietze_1997.png
And repeated by several skeptics like Lindzen, Spencer and myself over the years.
That is what happens in the real world and largely is reflected in the “fountain model”:
https://www.ferdinand-engelbeen.be/klimaat/klim_img/real_view.png
The opening of a small supply of a few liters per minute determines the height in the basin and that determines the overflow.
The input to the fountain of the cycle at 1000 liter/minute has zero influence on the overflow and doubling the circulation by adding a second cycle pump only halves the residence time without affecting the overflow.
In the real world, the calculated residence time Te of 4 years and the calculated adjustment time of 50 years, both based on real world observations, are completely independent of each other.
That is the essence of our differences.
Further, besides the cycles which move lots of CO2 back and forth between atmosphere and oceans/vegetation, independent of the CO2 pressure in the atmosphere, there is zero extra inflow or outflow caused by the CO2 pressure in the atmosphere when that is equal to the CO2 pressure in the oceans or vegetation.
If the partial CO2 pressure (pCO2) in the atmosphere is higher than of the oceans, then there will be an extra outflow beyond the cycling flows. If the pCO2(atm) is lower than in the ocean surface, then the extra CO2 flow will be reverse.
Your formula (2) should be adjusted to the CO2 pressure difference between atmosphere and ocean surface and to the pCO2 difference between atmosphere and plant alveolars water, not the absolute CO2 pressure in the atmosphere.
“Large parts of the carbon cycle are just cycling in and out of the atmosphere, largely independent of the CO2 level in the atmosphere.”
This is the Bern Model. This makes no sense. The carbon cycle is CO2. Nature cannot differentiate CO2 molecules. As Dr. Berry described in his first paper, it violates the Equivalence Principle. Te is “e folding time.” Tau is “Bern Time” for a sink that doesn’t exist.
Stephen,
The Bern model is as bad as Ed’s model, both are completely at odds with reality.
Ed’s model assumes that all CO2 inputs together cause the level in the atmosphere and the level in the atmosphere causes the outputs. That is the “classic” lake/bath tube/container model, where all inputs are unidirectional through the container to the outputs.
Te then is the time that any molecule of CO2 resides in the atmosphere, before being removed out of the atmosphere.
Te = mass / output
Te = ~4 years
In the real atmosphere 95% of all CO2 flows are just cycling between oceans – atmosphere – vegetation in spring/summer and back in fall/winter. These move large amounts of CO2, but remove zero CO2 mass out of the atmosphere, as long as the fluxes from oceans to vegetation and back are equal.
That is the “fountain” model: huge masses of water cycles over the fountain, but the level in the basin only changes when the small supply valve is opened by the maintenance man.
These are not equal anymore: humans add increasing amounts of CO2 directly into the atmosphere, one-way, without appreciable human induced sinks. That adds to the overall level of the atmosphere. The increase in CO2 level pushes more CO2 into oceans and vegetation and reduces the ocean output to the atmosphere.
These amounts are much smaller than what the temperature and sunlight do for the natural fluxes: that is the difference between all huge natural influxes + human influx – (natural + human) outflux. Where one can fight over what the “human outflux” is, but that is completely unimportant.
What is important, is that the net total outflux is smaller than the total influx. The increase in the atmosphere is smaller than the human input, thus the mass balance (and any bookkeeper worth his money) shows that the small increase in the atmosphere is from the human input.
That difference between inputs, outputs and what remains as mass in the atmosphere forms the “adjustment” time, that is the time to bring any extra CO2 (of whatever source) in the atmosphere above the “old” equilibrium (for the current average SST around 295 ppmv) back to 1/e (~37%) of the original extra CO2.
The formula for adjustment time (Tau) for a linear process is:
Tau = disturbance / effect
Where the disturbance = the distance to the equilibrium and effect = the net removal rate of CO2
And is currently around 50 years.
See: https://www.ferdinand-engelbeen.be/klimaat/klim_img/acc_decay.png
The Bern model assumes different Tau’s for different reservoirs, which combined gives the right answer at the start, but then assumes saturation of all reservoirs at different levels, which is only true for the ocean surface, not until over 1,000 ppmv for vegetation and non-existing for the deep oceans. That makes that the alarmists speak about “hundreds to thousands of years” to remove any extra CO2 above equilibrium.
Dear Ferdinand and everyone,
At the top of these posts, I put my test calculation for the effect of human carbon emissions on atmospheric CO2.
I made the calculation simple by setting the human carbon inflow to 10 PgC per year for ten years.
Now, I request Ferdinand, and anyone else who wishes, to put your calculations in the same Excel format. Make an image of your boxes like mine, and send it to me by email. I will post it below my calculations.
This is the only way to resolve these discussions. Anyone who is a player, who is serious, who knows how to do calculations can particpate. This is easy to do in Excel.
This is where the “rubber meets the road” as they say. If you cannot show your calculations for this simple test, then you are not a player in this game.
Dear Ferdinand, I expect to see your calculations for the same assumed data. Only then, can we compare our calculations and methods.
Ed
The fact that adding CO2 to the atmosphere (by humans) increases the amount of CO2 in the atmosphere should not be confusing.
tl;dr:
It’s really very simple:
● Mankind is adding CO2 to the air, mostly by burning fossil fuels.
● Nature (the net sum of all natural sources and sinks) is removing CO2 from the air.
● The amount of CO2 in the air is increasing because mankind is adding CO2 faster than nature is removing it.
The fact that some skeptics of climate alarmism are confused about such a simple concept surely encourages many other people to dismiss all skeptics of climate alarmism as unserious. That is unfortunate.
Here are the requested calcuations (tl;dr + numbers):
● Mankind is currently adding CO2 faster than nature is removing it, so the amount of CO2 in the air increasing. Measurements show that it is increasing by about 2.5 ±0.1 ppmv/year. (1 ppmv CO2 = 7.8024 Gt CO2 = 2.12940 PgC.)
● Mankind is adding 4.7 ± 0.5 ppmv/year of fossil CO2 to the atmosphere, plus 0.5 ±0.3 ppmv/year CO2 from “land use changes” (clearing forests and draining swamps). That increases the amount of CO2 in the air by 4.4 to 6.0 ppmv/year. (The fossil CO2 figures are calculated from economic data: the amount of coal, oil & natural gas produced and burned.)
● The difference between those two numbers is the rate at which nature is removing CO2 from the atmosphere: (5.2 ±0.8 ppmv/year) – (2.5 ±0.1 ppmv/year) = 2.7±0.9 ppmv/year.
Note #1: there are three different units in which atmospheric CO2 is commonly specified: ppmv (ppm), Gt CO2, and PgC (Gt carbon). 1 ppmv CO2 = 7.8024 Gt CO2 = 2.1294 PgC.
Note #2: I’ve conservatively chosen to add uncertainties linearly, since it is unclear whether we would be justified in adding them in quadrature
Note #3: other than the models used to roughly estimate the minor contribution from “land use change emissions” (from clearing forests and draining swamps), there’re no models used or needed for these calculations.
Note #4: Calculations of human CO2 emissions start with economic data on production/use of coal, oil & natural gas. CO2 is (12.0107/44.0095) = 27.29115% carbon by weight, so, for example, if you fully burn 1 tonne of 94% carbon anthracite coal, 0.94×44.0095/12.0107 = 3.444 tonnes of CO2 are emitted.
Note #5: The justification for using annually averaged Mauna Loa measurements of CO2 is that they’re quite close to the global average, and what we’re interested in is the total amount of CO2 in the atmosphere, which can be calculated from the global average CO2 concentration. The fact that annually averaged Mauna Loa CO2 measurements track very closely with measurements from other locations means that, except near sources and sinks, CO2 is a “well-mixed gas.” The average CO2 level at Mauna Loa (northern hemisphere) in 2024 was 424.61 ppmv. At Cape Grim (southern hemisphere) it was 420.01 ppmv. That’s only about a 1% difference. (The difference offers a clue to the rate at which wind currents mix CO2 emitted mostly in the northern hemisphere into the southern hemisphere’s atmosphere.) That’s pretty well-mixed.
The fact that nature (the net sum of natural carbon sinks and sources) is removing CO2 from the air obviously means that mankind, not nature, is responsible for the ongoing (beneficial) increase.
There’s no question about the fact that nature is removing CO2 from the air; as I’ve just shown, that fact is proven by measurements and simple arithmetic. But you might wonder why nature is currently removing CO2 from the air.
The answer is that the higher atmospheric CO2 levels go, the faster natural “carbon sinks” absorb it from the air. That is a powerful “negative feedback,” which helps to stabilize the Earth’s climate.
The two most important of those sinks are marine uptake and terrestrial “greening” / soils. They both accelerate approximately linearly as the CO2 level rises.
W/r/t absorption of CO2 by water, the linearity is probably obvious: the more CO2 molecules there are in the air, the more frequent are their collisions with liquid water. (It’s more complicated than that, because of chemical and biological processes, but it’s nevertheless approximately linear.)
Terrestrial biosphere uptake is less obviously linear, but it we know from agronomists’ studies that “CO2 fertilization” enhances C3 plant growth nearly linearly to above 1000 ppmv, and the plants that sequester most carbon (trees, sphagnum moss) are C3 plants, so that, too, is approximately linear:
https://sealevel.info/C3_and_C4_Pflanze_vs_CO2_Konzentration_en_1750_2023_linearity_highlighted3.png
The sum of two linear functions is also linear, so the net rate of natural CO2 removals from the atmosphere must also be an approximately linear function of the CO2 level in the atmosphere.”
And that’s what the data show. In fact, the rate of natural CO2 removal from the atmosphere accelerates by about 1 ppmv/year for every 50 ppmv rise in the atmospheric CO2 level (about 1/50 = 2%), as you can see from this plot:
https://sealevel.info/Global_Carbon_Budget_2023v1.1_with_removal_rate_plot2.png
(That’s Fig. 1 here; here’s the spreadsheet.)
That 2% slope means the effective atmospheric lifetime (“adjustment time”) of CO2 added to the atmosphere is about 50 years. (Note: do not make the mistake of confusing the adjustment time with the “turnover time,” a/k/a “residence time,” which is only about 3-5 years.)
That short (≈50 year) adjustment time is highly inconvenient for climate FUD, but the IPCC’s Second Assessment Report nevertheless acknowledged it, in a roundabout way. It reported that, “Within 30 years about 40-60% of the CO2 currently released to the atmosphere is removed.” [SAR WGI TS B.1 p.15] That implies a half-life of 23 to 41 years, which implies an adjustment time (effective atmospheric lifetime) of halflife/ln(2) = 33 to 59 years. That means the rate of annual natural CO2 removals accelerates by 1/59 to 1/33 of the increase in CO2 level, which is 1.7% to 3.0% per year. (Unfortunately, subsequent IPCC Assessment Reports have failed to mention that fact, presumably because it torpedoes the “climate crisis” narrative.)
Roughly the same result has also been reported by many other researchers, including:
Spencer, Roy W. (2023). ENSO Impact on the Declining CO2 Sink Rate. J Mari Scie Res Ocean, 6(4), 163-170. https://doi.org/10.33140/jmsro.06.04.03
Dr. Peter Dietze: http://www.john-daly.com/carbon.htm
Engelbeen, Ferdinand (2022). The origin of the increase of CO2 in the atmosphere, http://www.ferdinand-engelbeen.be/klimaat/co2_origin.html (section 3)
Berrien Moore III and B. H. Braswell (1994). The lifetime of excess atmospheric carbon dioxide. Global Biogeochem. Cycles, 8(1), 23–38. https://doi.org/10.1029/93GB03392
Excerpt: “The single half-life concept focuses upon the early decline of CO2 under a cutoff/decay scenario. If one assumes a terrestrial biosphere with a fertilization flux, then our best estimate is that the single half-life for excess CO2 lies within the range of 19 to 49 years, with a reasonable average being 31 years.”
Those very strong negative feedbacks, which lead to the relatively short (fifty year) adjustment time, mean the atmospheric CO2 level cannot rise indefinitely unless the emission rate does, too. The CO2 level is currently rising by about 2.5 ppmv/year. So if anthropogenic emissions were to continue at the current rate for the long term, the atmospheric CO2 level would plateau at just 2.5 × 50 = about 125 ppmv above the current level.
That’s a mere 37% of a doubling. For comparison, the Earth has already seen 60% of a doubling since the “preindustrial” 1700s, with only benign effects, so there’s no reason to suppose that another 37% would be harmful.
That’s one of the many reasons that the “net zero” campaign is unscientific.
BTW, you can cite the CO2 Coalition investigation of the carbon cycle like this:
Engelbeen F, Hannon R, Burton D (2024). The Human Contribution to Atmospheric Carbon Dioxide. CO2 Coalition. https://doi.org/10.31219/osf.io/het6n
I hope you find this helpful.
Dear Dave.
Thank you for your comment, and especially for your updated reference to your publication. I will update my post accordingly.
In the following, I am going to be quite critical of your reply. Please understand that I am not judging you personally in my critiques.
My Reply:
You wrote:
We agree with your (1) but your (2) is ambiguous because you do not follow the path of human carbon through the carbon cycle. You merge human carbon with natural carbon in an undefined manner and this makes your statement and all your following statements that depend upon your (2) wrong.
Your (3) is also wrong. The proper description is to say (a) we assume the flows of natural carbon into and out of the atmosphere are equal and stay constant, so the natural carbon level stays constant and (b) that we keep separate track of the human carbon that flows into the atmosphere and then flows into the other carbon reservoirs.
THIS IS THE CRUX TO THIS WHOLE ISSUE. THE CO2 COALITION DOES NOT PROPERLY DEFINE THE PROBLEM.
(I did not receive your test calculation to compare it with my table above. if you have it, please email it to me.)
BOTTOM LINE: THE CO2 COALITION DOES NOT KNOW HOW TO CALCULATE THE EFFECT OF HUMAN CARBON EMISSIONS ON ATMOSPHERIC CO2.
Your continued explanations are simply handwaving and contradict simple physics:
THAT IS QUITE AN ADMISSION THAT THE CO2 COALITION HAS NO USE FOR CALCULATIONS THAT DISAGREE WITH ITS LEADERS’ EMOTIONAL NEEDS. WHAT HAPPENED TO PHYSICS?
THE CO2 COALITION CANNOT CALCULATE THE TRUE EFFECT OF HUMAN CO2, SO IT REJECTS MY CALCULATIONS WITHOUT FINDING ANY ERRORS IN MY CALCULATIONS AND MAKES A SWEEPING UNJUSTIFIABLE CLAIM THAT IT CALL “FACT”.
YOUR REFERENCE TO “NATURE” IS NOT A SCIENTIFIC STATEMENT BECAUSE YOU DO NOT PROPERLY DEFINE “NATURE”.
THE GOAL OF THIS SUBJECT IS TO CALCULATE HOW MUCH HUMAN CARBON INCREASES THE CO2 LEVEL. THE CO2 COALITION FAILS TO ACHIEVE THIS GOAL.
THAT IS WHAT MY EQUATION (2) DOES BUT THE CO2 COALITION REJECTS MY (2) AND ALL THE CORRECT CALCULATIONS THAT (2) PRODUCES.
TO PUT IT AS POLITE AS I CAN, THAT SENTENCE IS JUNK SCIENCE. THE ADJUSTMENT TIME IS NOT RELEVANT TO THE PROBLEM WE ARE DISCUSSING.
All your references fail to do proper physics. So, using these references further degrades your argument. ARE YOU TRYING TO ARGUE THAT YOUR REFERENCES ARE A CONSENSUS THAT PROVES YOU ARE CORRECT?
But you did not do the simple test calculation that I requested.
THERE IS NO MATH IN YOUR ARGUMENT. ALL YOUR ARGUMENTS ARE HANDWAVING. BY CONTRAST, I CALCULATE REAL NUMBERS THAT THE CO2 COALITION REJECTS.
BOTTOM LINE: THE CO2 COALITION DOES NOT KNOW HOW TO CALCULATE THE EFFECT OF HUMAN CARBON EMISSIONS ON ATMOSPHERIC CO2.
The CO2 Coalition is severely negligent in its use of physics to calculate the effect of human carbon emissions on the level of atmospheric CO2.
Since you’re referring to my three bullet points by number, here’s the “tl;dr + numbers” version of the three bullets, with numbers added to match yours, and minor clarifications in [brackets]:
Ed wrote:
It is not ambiguous, it is calculated mostly from real, reliable data: high quality measurements, and economic statistics. It is not from hypothetical models, except for the minor contribution of “land use emissions”.
Carbon is fungible, so it makes no sense to try to “follow the path” of emitted carbon. The natural sinks which remove carbon from the atmosphere do not distinguish between “natural carbon” and “human carbon.”
Ed wrote:
All human and natural CO2 emissions go into the air, where they mix. There’s nothing undefined about it, that’s the physical reality. I don’t merge them, the atmosphere does!
Many climate alarmists think some percentage of our emissions are magically teleported to the oceans & biosphere. They are wrong, but it’s widely believed, and even implied in parts AR6. Lots of alarmist sources make that mistake. For example, here’s the UN saying, “The ocean… absorbs 30 percent of all carbon dioxide emissions”. It is nonsense.
Ed wrote:
None of that is correct. It is not true that “flows of natural carbon into and out of the atmosphere are equal and stay constant,” nor is there a “natural carbon level” which “stays constant.” Carbon is fungible, and CO2 from all sources is mixed in the atmosphere.
There are no pipelines for “separate[d] human carbon that flows into the atmosphere and then flows into the other carbon reservoirs.” That is unphysical.
Contrary to your “Figure 3,” which erroneously shows a separate “human carbon cycle” removing carbon from the atmosphere to the land and ocean, there are no major anthropogenic carbon sinks. There are only natural removal processes.
There are small differences between isotopes for the speeds with which various processes proceed, but that merely introduces slight isotopic fractionations, and it does not affect the calculations I’ve showed you.
The amount of carbon in the atmosphere is increasing because the additions to it exceed the removals from it, by about 2.5 ±0.1 ppmv/year. (1 ppmv CO2 = 7.8024 Gt CO2 = 2.12940 PgC.)
We know that the anthropogenic CO2 additions are about 5.2 ±0.8 ppmv/year, and the anthropogenic removals are about zero.
That means the net sum of all other processes (which we call “nature”) is a removal rate of (5.2 ±0.8 ppmv/year) – (2.5 ±0.1 ppmv/year) = 2.7±0.9 ppmv/year.
Ed partially quoted me writing:
To which Ed replied:
The field of “climate science” is overrun with people who think their unrealistic models trump measured physical reality. That’s a major reason it is such a mess. At the CO2 Coalition, we deal in measured reality.
Ed wrote:
The true effect of emitting 5.2 ppmv of CO2 into the atmosphere is a 5.2 ppmv increase in the atmospheric CO2 level.
How is that not obvious?
If, when we (humans) add 5.2 ppmv of CO2 to the atmosphere, the measured increase in the atmospheric CO2 level is only 2.5 ppmv, that means something else removed a not total of 2.7 ppmv of CO2 from the atmosphere.
That “something else” is what we call “nature.”
Ed wrote:
I told you, “Nature [in this context is] the net sum of all natural [CO2] sources and sinks.”
Is that unclear?
Ed wrote:
As I’ve already showed you, human carbon emissions increase the atmospheric CO2 concentration by 5.2 ±0.8 ppmv/year.
Nature (the net sum of all natural sources and sinks) reduces the atmospheric CO2 concentration by 2.7±0.9 ppmv/year.
The difference between those two figures is the measured average annual increase in the atmospheric CO2 concentration: 2.5 ±0.1 ppmv/year.
Ed wrote:
The measurement-derived adjustment time, of about 50 years, is the “CO2 lifetime” which determines the duration of effect for contemporary CO2 emissions. It is the only lifetime which is relevant to the problem we’re discussing.
I urge you to abandon your “models,” and focus on measured reality.
Dear Dave,
You make your science life difficult because you do not separate concepts and formulations from data.
As Einstein said, formulation of a problem is more difficult and important than solving the problem.
I omitted your irrelevant data from your paragraphs because your data are not needed to illustrate the formulation. Yet, you go and add the data back again.
POINT #1: You have not produced a simple 10-year calculation to compare with mine. That means you are either ignoring this or incapable of doing this.
I wrote:
“Your (2) is ambiguous because you do not follow the path of human carbon through the carbon cycle.”
You replied,
Everything you write is about your unstated imaginary model. You do not recognize your own assumptions. You think data is everything. It’s not.
Data has only two functions in science: (a) used to formulate a hypothesis that can be tested, and (b) to test the predictions of hypotheses. You are bypassing the scientific method.
You call my work, “hypothetical models.” You don’t realize that my “climate model” is an accurate description of IPCC’s carbon cycle. My “model” is based on my (1) and (2). Everything else is deductive math.
My deductive “model” shows how to correctly calculate the effect of human carbon on the CO2 level, based only on (1) and (2) and IPCC’s own data.
I clearly stated my two assumptions, my equations (1) and (2). You don’t dispute these equations. You seem to not get it that all my equations and calculations are deductions from these two equations.
If you understood my simple math, you could insert your own data into my mathematical model to calculate the effect of your data on the outcome.
All your data is useless unless you have a means to calculate the effect of your data on how human carbon adds to the CO2 level.
You are unable to use your data to calculate a result because you have not formulated a way to do your calculations, and you don’t know how to insert your data into my mathematics.
Above these posts, I show you an example of how I calculate the effect of human carbon on atmospheric carbon. My calculation is not a model. It is a math that any good scientist or engineer should be able to do.
You don’t get it that my equations apply to human and natural carbon equally and independently. Yet, that is the key to calculation the effect of human carbon on the carbon in the atmosphere.
Without such equations, you cannot follow the separate paths of human and natural carbon through their carbon cycles.
You say that “nature” removes human carbon from the atmosphere. Your statement is irrational and incorrect. You assigned the outflow of human carbon to the outflow of natural carbon.
You say:
Unless you can describe nature in equations, you can’t calculate what nature is doing. You reject my description, which leaves you with nothing but handwaving.
Your (3) is also wrong. The proper description is to say (a) we assume the flows of natural carbon into and out of the atmosphere are equal and stay constant, so the natural carbon level stays constant and (b) that we keep separate track of the human carbon that flows into the atmosphere and then flows into the other carbon reservoirs.
You wrote:
I did not say such a thing. I said your hypothesis of carbon flow must be able to replicate the situation where the natural carbon level stays constant because this is the assumed environment where human carbon flows.
You must use the Climate Equivalence Principle to calculate what human carbon will do in that environment.
You wrote:
Nonsense. Every place natural carbon goes human carbon will go. With more carbon, trees grow.
You wrote:
I deleted your numbers because they are distracting you. In theoretical physics we first write our equations to formulate a solution to our problem. Only then do we add numbers. You are modifying your equations because you assume human carbon outflow. First, get your equations correct, and then deal with the data.
You wrote:
I replied:
“THAT IS QUITE AN ADMISSION THAT THE CO2 COALITION HAS NO USE FOR CALCULATIONS THAT DISAGREE WITH ITS LEADERS’ EMOTIONAL NEEDS.”
You wrote:
I do not have an “unrealistic model.” Anyone who claims that is not a good physicist. I simply do my time step calculations using a standard systems model. You imply that my calculations are like a climate model, all of which are disasters.
You are not dealing in “measured reality.” I am surprised no one in the CO2 Coalition has tried to help you like I have.
I wrote:
“THE CO2 COALITION CANNOT CALCULATE THE TRUE EFFECT OF HUMAN CO2.”
You wrote:
Dave, your examples are wrong because you do not calculate how fast human carbon flows to the other carbon reservoirs. You assume incorrectly that the human carbon inflow sticks in the atmosphere.
You must follow my example calculation and let human carbon flow out of the atmosphere each year.
YOUR REFERENCE TO “NATURE” IS NOT A SCIENTIFIC STATEMENT BECAUSE YOU DO NOT PROPERLY DEFINE “NATURE”.
Your belief is clear, and wrong. It just proves you never learned how to do theoretical physics. You have shown me that you cannot do physics.
THE ADJUSTMENT TIME IS NOT RELEVANT TO THE PROBLEM WE ARE DISCUSSING.
You wrote:
Adjustment time is not mathematically related to calculating the effect of human carbon on the CO2 level. Even you have not shown such a relationship.
You wrote:
Now, you have made this discussion personal.
To call my calculations “models” is a fallacy, especially when you cannot do any calculations to support your illusions.
Dave, did you and your co-authors write your crazy ideas on climate science all on your own?
Did someone in the CO2 Coalition review and approve your paper?
Did Will Happer or Richard Lindzen or anyone approve your outright decimation of physics, math, and logic in your paper and your comments?
Dr. Ed,
Was (and still am) busy with the calculation sheet and did just read your reply to David.
Sorry, but you are getting much too personal, while simply ignoring what David wrote.
Our work was read by a lot of people, including Will Happer and many others, before being published.
The adjustment time of near 50 years is exactly what happens with the extra mass of CO2 in the atmosphere and that was found by Peter Dietze, already in 1997, in a discussion with the inventor of the (faulty) Bern model, Fortunat Joos:
https://www.john-daly.com/carbon.htm
and the discussions with Joos and others:
https://www.john-daly.com/dietze/cmodcalc.htm and
Many others, including known skeptics like Lindzen and Spencer found similar adjustment times.
Your calculations are about the 4 years residence time which only shows how long an individual CO2 molecule “resides” in the atmosphere, before being removed or swapped with a CO2 molecule from another reservoir. In the latter case, that doesn’t remove one gram of CO2 out of the atmosphere, as long as ins and outs are equal. 95% of all CO2 fluxes just swap molecules, 5% is what humans add and only 2.5% is what the fluxes do remove as mass out of the atmosphere…
Dear Ed,
I will work on it tomorrow, with a slight change in Figure 3 of the IPCC, as we disagree with the IPCC about the isolation of the deep oceans by the ocean surface. That is based on the IPCC’s Bern model, which doesn’t reflect the real world, because there is a direct connection between the atmosphere and the deep oceans with the THC (thermohaline circulation) of about 40 PgC/year.
That will not affect the overall picture for the atmosphere, only remove the F34 and F43 links and add F24 and F42 links…
Dear Ferdinand,
Thank you for your comment. Don’t feel pressured to reply to my comments instantly. We all have lives to live, me included.
What I am looking for is how you would calculate the annual change in levels of the four reservoirs according to the IPCC data set I use AND my test assumption that annual human carbon inflow equals 10 PgC per year.
After that, you can show your proposed F24 and F42 links and show how they change your calculations.
If your added links are defined well enough, then I can do a second calculation that includes those links.
The overall goal in my request is so we can see and compare any differences in our calculations.
Dear Ed,
Thank you for your perceptive, untiring efforts to see that this outrageous, faked-science scandal will finally be laid exposed. I do poems.
A Tripping Point
More carb in the sky makes it hotter
The Greenhouse Effect says it’s gotta
But by Henry’s Law
Hotter oceans add more
and more carb in the sky makes it hotter
and hotter and hotter and hotter . . .
Dave,
You wrote:
“The field of “climate science” is overrun with people who think their unrealistic models trump measured physical reality. That’s a major reason it is such a mess. At the CO2 Coalition, we deal in measured reality.”
And:
“I urge you to abandon your “models,” and focus on measured reality”
You have no measurements, just words. Show us where you measured CO2 being emitted from the oceans. You claim you’ve measured human emissions, you haven’t. The global carbon budget is not measurements, that is all based on guesses and estimates and models based on false assumptions.
You’ve got nothing but words.
Brendan,
Not only the fluxes between ocean surface and atmosphere are measured,
See: https://www.pmel.noaa.gov/pubs/outstand/feel2331/maps.shtml
but the resulting increase of inorganic CO2 in the ocean surface, in equilibrium with the atmosphere (with some small delay) is measured too:
https://tos.org/oceanography/assets/docs/27-1_bates.pdf
See Figure 3 and Table 2 of that work for the increase in DIC.
If the warming ocean surfaces were the source of increasing CO2 in the atmosphere, then DIC would decrease and the pH increase. Because the net flux of CO2 is reverse, DIC increases and pH decreases in all ocean surface waters where is measured…
Dear Ferdinand,
We will discuss this as we proceed through my Excel file. You will have an opportunity to show how you use this information in your carbon cycle calculation.
Ed
Salby discusses the Bern modal in this video (https://www.youtube.com/watch?v=rohF6K2avtY) at 1 hr and 1 min.
He concludes that it is not compliant to basic physics.
DMA,
Murray Salby also thought …
Murray Salby and Hermann Harde .. ….
Murray Salby was ….
Murray Salby relied on …..
If Murray Salby said it….
Skeptics like yourself claim to reject authority, but all you do is accept without question people who tell you what you want to hear. Either think for yourself, DMA, or if you are unable to do that, make better choices of authorities.
David Andrews June 30, 2025 at 8:50 pm
David,
I deleted your remarks that attack Salby from your above refrenced comment. I will otherwise leave the comment.
My reasons are (a) personal attacks are not part of a science debate, (b) Salby is not here to defend himself, (c) your attacks have no references, (d) your attacks make no contribution to this discussion, and (e) if I leave your attack on Salby, it will set a bad precedant to the discussions on my website.
We are here to discuss and debate climate science. Whatever a person has done in the past, or even accused to have done, is not relevant to the discussion of what the person has published or otherwise presented to the public.
Ed as administrator
David,
Please see section 2.8 of my draft post at the top of these comments for the truth.
This section is my summary of the Delta14C data.
It proves you are wrong about the effect of human CO2, and you have never been able to properly rebut my proof.
This reminds me that you also have not been able to show your version of the simple ten-year test calculation that I put at the top of these comments.
If you can’t calculate how human carbon moves through the carbon cycle, your handwaving rants mean nothing.
But you do provide nice entertainment for the readers.
Ed,
Jerry and Ferdinand have done a good job rebutting your confused C14 analysis in Section 2.8. But you seem to be asking for my comments and I will comply. I will be referring to figures in a recent Radiocarbon https://www.cambridge.org/core/services/aop-cambridge-core/content/view/193CDF1F705B269BC975AF178CEF1AC3/S0033822224000274a.pdf/discussion-presentation-of-atmospheric-14co2-data.pdf
The Seuss effect is easily observed prior to atmospheric nuclear testing. See Figure 1a in the above link for a falling Delta14C between 1900 and 1950. Your so-called “balance level” is nowhere to be seen. Also see Figure 1b for the C14 concentration increase during the same period. Jim can explain to you how disequilibrium isofluxes made that happen. Nature is subtle. Adding C14 devoid carbon to the atmosphere increased the C14 concentration in the atmosphere, because of those balanced exchanges!
Figure 2 shows the “bomb pulse” plotted both in terms of DeltaC14 (as you do) and in terms of concentration. You might remember that back when you thought DeltaC14 and concentration were the same thing, and I showed you a true concentration curve similar to that shown here, we both wondered what caused the concentration increase after about 2000. I know now; do you? Hint: think disequilibrium isofluxes due to balanced exchanges. Where is DeltaC14 lowest in 2020?
Figure 4 shows the usefulness of plotting concentration instead of Delta14. You can visually add up the contributions from different reservoirs. Study it and see how the bomb carbon got spread around among the various reservoirs, just as industrial carbon gets spread around today. Notice that the bomb carbon is still with us 65 years later.
DMA, Salby was right on that point: the Bern and similar models are wrong, because they assume an uniform ocean surface that isolates the deep oceans from the atmosphere. In reality there is a huge sink/source that directly connects both via the THC, bypassing the ocean physical and chemical restrictions.
For the rest, Salby was completely wrong on so many points (ice core CO2 migration, increase of CO2 by integration of temperature, etc.) that he simply was unreliable as source of good information.
BTW, he never was involved in discussions about his work, not a real sign of reliability…
Also, the Bern model is wrong because it assumes human carbon causes all the CO2 increase. This assumption is built into its calculations.
Dear Dr. Ed,
Here are my responses to your challenge:
https://www.ferdinand-engelbeen.be/klimaat/klim_doc/Ed%20Berry_challenge.docx
and the accompanying Excel sheet with the calculations is here:
https://www.ferdinand-engelbeen.be/klimaat/klim_xls/Berry_fluxes.xlsx
The Excel sheet is made very flexible, so that any change in fluxes, starting conditions and Tau is immediately calculated.
I did return the favor by asking for your calculations for the 2010-2020 period with realistic figures…
Best regards,
Ferdinand
Dear Ferdinand,
Thank you for your reply.
In return, I added at the top of these comments, a link to my Excel file so everyone can download it. I put the instructions in the file.
Later, I will dispute your Tau, but let’s first see how far we can go where we agree on these calculations.
That is why I made my TEST tab in my Excel file simple so we can see if we agree on the first ten years of simulated human carbon. I am using human carbon inflow of 10 PgC/year for each years. Later, after we agree on the calculations, we can use real data.
In my first test Excel image, I did not make my instructions clear enough, so you did not match my test numbers.
We are assuming that the natural carbon cycle is in equilibrium at 280 ppm. Since it does not change, we do not calcuate it here.
Here, we calculate only the human carbon cycle starting with the Year 0 bins empty. That way we can more easily compare our numbers.
In my Excel file, I show my six Te in the top three lines. After we get the same numbers in this simple calculation, then you can change the six Te in the top green cells to your numbers. The second and third green lines are not part of the calculations. They are there so we can save other Te. Let’s save the third line so we can recover my Te easily.
Then we can see how your calculations differ from mine due to the Te alone.
I am sure we will have some discussion at that point. But at least we will then know exactly what we are discussing.
Everyone is welcome to download my Excel file and then participate in the calculation discussions.
Sorry, see a “Not Found” error when clicking the reference to the Excel file…
Thus can’t (yet) see what you have exactly done and how to match what you have done…
Please try this link:
http://edberry.com/excel-file/
Ten people have downloaded my file, so far.
The Bern Model assumes half the human CO2 moves out of the atmosphere with an e-time of 4-5 years but half the human CO2 has a very long e-time, many many decades. And, it assumes all the natural CO2 has an e-time of 4-5 years. I ask people if it is possible for a long e-time CO2 to become a short e-time CO2? If not what natural mechanism partitions the long e-time CO2’s and the short e-time CO2’s? And, how does one human CO2 have a different e-time than another human CO2? How can nature tell one human CO2 molecule from another human CO2 molecule? Is there a law of nature we don’t know about? How do you write a differential equation with the Bern Model as the solution?
The Bern model assumes that the different reservoirs get saturated.
That means that the uptake is quite fast, until saturation is reached and then it stops, and another (slower) reservoir must take over.
That is only true for the ocean surface, which is saturated at about 10% of the change of CO2 in the atmosphere.
That is not true for most of vegetation, that increases its growth for 93% of all (C3-type) plants up to 1,000 ppmv and more.
That is absolutely not true for the deep oceans, which are far from saturated. If all human emissions up to now ultimately get into the deep oceans, that would increase its carbon content with 1%. That would lead to 1% increase of CO2 in the atmosphere in equilibrium, or 3 ppmv. That is all.
The Bern model simply is wrong…
BTW, the Bern model and most models and our calculations look at the increase of total CO2, not at “human” CO2 alone. No matter what caused the increase of CO2 in the atmosphere…
Dear Uncle Bert,
You said “the fluxes between ocean surface and atmosphere are measured”
Your PMel reference cites Feely et al which states 940,000 measurements of surface water pCO2. This is pCO2 not CO2. And they are not measurements. pCO2 is estimated/calculated for the entire ocean using actual CO2 measurements from land based stations. This is politicised junk science, just what I expect from you. A wild goose chase.
Then you get carried away with the DIC. The only scientists that I see researching DIC are those pushing climate alarmism. What’s happening in the DIC is microscopic compared to what’s happening with the dissolution of CO2 in the ocean waters. Most CO2 in the ocean is CO2Aq. Your discussion on the DIC is nothing more than a side show waffle.
The hydration equilibrium constant for carbonic acid at 25 °C is Kh = [H2CO3]/[CO2] = 1.70 × 10⁻³. Hence, the majority of the carbon dioxide is not converted into carbonic acid, but remains as CO2 molecules. In the absence of a catalyst, the equilibrium is reached quite slowly.
https://www.sciencedirect.com/topics/chemistry/carbonic-acid
R.C. Ropp, in Encyclopedia of the Alkaline Earth Compounds, 2013
5.1.1 Carbonic Acid
Indeed there are about 2,000 CO2 molecules for each H2CO3 (carbonic acid molecule) in water
“Aquatic Chemistry Concepts” by James F. Pankow.
In reality, the conversions between the three forms of Dissolved Inorganic Carbon, CO2 or H2CO3, HCO3- and CO3– are almost instantaneous (less than one minute)
Veyres, C., Maurin, J. Cl. Revisiting the carbon cycle International Journal of Earth Sciences Vol. x, No. x, 2021, pp. x-x. doi: 10.11648/j.xxx.xxxxxxxx.xx.
When I pop the top off my 20 year old Dom Pérignon I don’t have to wait for an eternity for the CO2 to fight it’s way out of the DIC, the CO2Aq bubbles out instantly.
Your comments are specious waffle.
Brendan, I have no idea who Uncle Bert is, but what part of the formula:
F = k•s•DeltapCO2
don’t you understand?
From Feely: http://www.pmel.noaa.gov/pubs/outstand/feel2331/maps.shtm
From the next section:
“This map yields an annual oceanic uptake flux for CO2 of 2.2 ± 0.4 PgC/yr.”
And dissolved CO2 + H2CO3 together are only 1% in seawater, 90% are bicarbonates and 9% are carbonates. High time to refresh your chemistry. Learn here about the Bjerrum plot:
https://en.wikipedia.org/wiki/Bjerrum_plot
My thoughts on Tau vs Te after considering comments provided by Ferdinand Engelbeen. Tau equals disturbance / result (outflow) which means, when applied to ocean atmosphere fluxes, Outflow = [pCO2(atm) – pCO2(ocean)] / Tau. Generalizing this formula to carbon distribution between the atmosphere and its adjoining reservoirs requires a huge assumption which I believe is untenable. The assumption used by some researchers seems to be that the disturbance is proportional to the level difference, or pressure difference, between the existing level or pressure and what that level or pressure was in pre-industrial times. In other words, pCO2(now) – p(CO2)then. Roy Spencer writes, “[My] model assumes an anthropogenic CO2 source, and a constant yearly CO2 sink rate proportional to the excess of CO2 over a baseline equilibrium value determined by the Mauna Loa data.” https://www.opastpublishers.com/open-access-articles/enso-impact-on-the-declining-co2-sink-rate.pdf
Dr Spencer obtains a best fit to the Mauna Loa data using a “net” sink rate, 0.02/year, of the difference in the CO2 concentration in a given year compared to a fitted 1750 “baseline” value. That “net” amount is actually the relatively small difference between yearly input and outputs that are two orders of magnitude greater than their difference. The flaw in any model using a “baseline” is that the atmosphere does not remember what its “baseline” value was. It is extremely likely that pCO2(atm) and pCO2(ocean) may never return to their pre-industrial values. The only levels nature remembers are the ones they experience in the present time and places. There is no going back to the way things were in 1750 or 1850 or any other year in the distant past.
How does this affect calculations of Tau? If new baseline equilibrium levels were to be estimated today based on the current magnitude of inflows and outflows, assuming no further perturbations from fossil fuel emissions, then two possible situations remain. Either the baseline remains unchanged from some pre-industrial date, or a new baseline results at greater levels of inflows and outflows. I don’t think lesser levels are realistic given the growth in world population. In the former case, Tau would remain about the same as Dr Spencer predicts at 50 years, i.e. (420 – 280) ppm * 0.02/year = 2.8 ppm/year. But what if the baseline equilibrium is greater than 280? For example, a baseline of 320 ppm makes Tau = 1/0.028 or about 36 years. Therefore, Tau is overestimated if baseline equilibrium conditions have evolved due to increasing natural flows.
It makes sense that estimations of Tau vary widely among researchers. No one really knows what the current equilibrium level is or will be.
More specious waffle from Uncle Bert.
Ferdinand Engelbeen reminds me of the singer Engelbert Humperdinck who I always called Uncle Bert for short. I always shorten long names.
Uncle Bert previously said CO2 over the oceans was measured now he agrees that it is calculated and based on CO2 measurements over land.
And he’s dived back into the DIC for another wild goose chase.
Brendan, a calculated flow, based on quite good observations is as valid as direct observations. These observations were over all oceans: some 960.000 to be exact.
And all you have demonstrated is your complete lack of understanding chemical equations.
And please, shouting at someone only shows that you have no real arguments.
Jim Silverly
You said:
“It is extremely likely that pCO2(atm) and pCO2(ocean) may never return to their pre-industrial values. The only levels nature remembers are the ones they experience in the present time and places. There is no going back to the way things were in 1750 or 1850 or any other year in the distant past.”
CO2 rose to 450ppm twice during the last 200 years from instrumental measurements accurate to 1%-3%
See the chart at https://www.researchgate.net/publication/366823612_Lunar_Forced_Mauna_Loa_and_Atlantic_CO2_Variability/figures?lo=1
which is Figure 2 from:
Yndestad Harald, 2022b: Lunar Forced Mauna Loa and Atlantic CO2 Variability; Science of Climate Change, Vol. 2.3 (2022) pp. 258-274; https://doi.org/10.53234/scc202212/13 ; https://scienceofclimatechange.org/wp-content/uploads/Yndestad-2022-Lunar-Forced-CO2-Variability.pdf
CO2 also rose to 400ppm 12,000 years ago based on Stomata proxy measurements.
Steinthorsdottir 2013
The ice core proxy is very monotonic and does not show all the up and down extremes in CO2 measurements.
Brendan,
I have had years of discussions with the late Ernst Beck about the historical measurements, until his untimely death in 2010.
The historical measurement methods were not too bad (+/- 9 ppmv), but where was measured was a mess. Midst of towns, forests,… completely unsuitable to know the real “background” CO2 levels of that time.
The late Ernst Beck lumped them all together: the good, the bad and the ugly. The real range of measurements was from near the bottom of the graph to (far) over the ceiling.
When one did choose only the measurements over the oceans or at the coast, with wind from the seaside, all these measurements are on or below the ice core measurements:
https://www.ferdinand-engelbeen.be/klimaat/klim_img/beck_1925_1955.jpg
With one exception: at a slope of the Alps where was measured in the morning and extreme CO2 values were found.
To show the problem: there is a modern station at Linden/Giessen (Mid-West Germany) at a few km of the historical station that makes the largest influence on the CO2 “peak” around 1940.
Here for a few days under inversion, compared to the same (raw) data of Barrow, Mauna Loa and the South Pole:
https://www.ferdinand-engelbeen.be/klimaat/klim_img/giessen_background.png
Stomata data are local proxies which are calibrated to ice core values. If the average differs from the ice core values over the resolution of the ice core, then the stomata data must be recalibrated. Not reverse…
See further my comment of Beck’s latest, posthumous published work:
https://scienceofclimatechange.org/ferdinand-engelbeen-about-historical-co2-levels-discussion-of-direct-measurements/
I just finished reading Koutsoyiannis, Demetris & Johnson, Mark. (2024). The superiority of refined reservoir routing (RRR) in modelling atmospheric carbon dioxide. https://tinyurl.com/bdd4fhyb
Their equations in Annex A. explain in detail the difference between Tau and Te; they support my view that a sink rate proportional to [pCO2(now) – p(CO2)then], although empirically based, “may be a result of the coincidence of increasing human and natural CO2 emissions. The latter, caused by the biosphere expansion, are totally neglected in this relationship.”
My thanks to David Andrews for introducing me to this work. It seems to support Dr. Ed’s multi-compartment analysis and the conclusion that H1 is false.
Happy Fourth of July, all.
Jim,
In recent discussions with Koutsoyiannis (last September during a workshop in Athens for Clintel) he used temperature anomaly as the base for his calculations of the CO2 increase/year. Temperature(anomaly) is of a different order than the CO2 increase/year, but has the same variability as temperature change/year, with a pi/2 shift. T(anomaly) has a slope, while T(change)/year has not:
https://www.ferdinand-engelbeen.be/klimaat/klim_img/wft_T_dT_dCO2_trends.jpg
WfT has the emissions not in their database, but the slope is about twice the slope of the CO2 increase in the atmosphere…
Not the first to use T(anomaly) as base and use its slope to calculate the increase in the atmosphere, while ignoring the twice as fast increasing slope of human emissions…
The net effect of his calculations violate the carbon mass balance, but can be corrected by increasing the natural sinks:
https://www.ferdinand-engelbeen.be/klimaat/klim_img/demetris_1b.png
The increase in the atmosphere may be between 100% natural and 100% human. In the latter case, the net natural contribution is the net sink rate in nature. In the former case, the total sinks remove every gram of what humans have added (as mass, not the only the original FF molecules) out of the atmosphere. Quite remarkable.
In that case, net natural sinks are twice the net natural addition in the atmosphere. So how can nature be the cause of the atmospheric increase?
Then, have a look at table 4:
He calculates the residence time from both the change in temperature over the seasons, and from the year by year variability: both between 3 and 4 years. Except that the seasonal change of CO2 is negative for temperature and the year by year change positive… That makes no difference for the residence time, but makes a huge difference for the adjustment time…
Then in equations [66] and [67] he calculates the remaining human CO2 in the atmosphere. He gets around 6%, Harde found about 10%, based on the 13C/12C ratio. While Harde is right, that only shows the remaining FF molecules in the atmosphere, not what the IPCC says as “airborne fraction” which is about the remaining total mass of CO2, caused by FF emissions (the difference being exchanged with CO2 molecules from other reservoirs).
And how can he explain that only 1.5 to 5% of FF in the supply 1960-2020 causes over 10% FF in the atmosphere in the same period with his one-way supply?
Below equation 48 he writes:
“Proposition 1. The IRF equals the probability density function of the residence time for the case
that the input is an impulse function.
Corollary 1. The mean and median response time equal the mean and median residence time for
the case that the input is an impulse function”
Which is only true for a one-way “classic” input-container-output (“lake/bad tube”) model.
Completely at odds with the real world, where 95% of all CO2 fluxes are independent of the pCO2 in the atmosphere…
Ferdinand,
Apparently, Koutsoyiannis’ Research Gate article is not the one you referenced above. I’ll try to locate it and explain why you may have incorrectly concluded, “The net effect of his calculations violate the carbon mass balance….” Different models can account for the same mass balance data. What is important is using equations that employ the correct physical processes involved.
Ferdinand,
I looked briefly at the parts of https://www.mdpi.com/2073-4441/16/17/2402 that relate to your critique of Koutsoyiannis’ model.
“…he used temperature anomaly as the base for his calculations of the CO2 increase/year.”
Including a temperature factor in one’s analysis makes sense, although I suspect he doesn’t use that to conclude all of the rise in CO2 is due to temperature. That would be the equivalent of saying nature causes all of the rise.
A “twice as fast increasing slope of human emissions…” compared to the temperature anomaly slope is arguing causation by correlation.
“So how can nature be the cause of the atmospheric increase?”
What my primitive model (converting Roy Spencer’s Tau spreadsheet to Te version) indicates is that natural emissions since 1750 have been increasing logarithmically from about 70 ppm in that last pre-industrial century to about 90 ppm today. Almost all of that is sinked each year. However, the net gradually increases each year. The explanation is, as we have discussed, an expanding biosphere. The oceans contain more CO2 and they are warmer. People have prematurely cut down trees and them decomposing and being burned creates extra emissions that otherwise wouldn’t have been without human’s influence.
Skipping down to your last point, a Proposition 1 and Corollary 1 being “only true for a one-way ‘classic’ input-container-output (‘lake/bad tube’) model [and] completely at odds with the real world, where 95% of all CO2 fluxes are independent of the pCO2 in the atmosphere…”
Koutsoyiannis’ model seems to be along the same lines as the multi-component models of Dr. Ed and others like that. Again, they are using rate constants applicable to real world flows/fluxes in each direction. They account for the amounts and concentration of CO2 in each reservoir. There is no need to deal with an adjustment time, because no one knows what the future holds as far an unsure of changes in industrial emissions and probably natural sources too.
Jim,
I know of the difficulty of dealing with huge cycles and small one-way additions…
There is indeed one and only one possibility that the natural fluxes are the cause of the increase in the atmosphere: if, and only if, they increased in exact the same ratio as the human emissions.
If that is not the case, then you violate the equivalency principle for any CO2 molecule in the atmosphere.
Human emissions increased a 4-5 fold between 1958 and current. Total flows (natural + human) increased maybe 50% or 1.5 times for the ocean fluxes (for which I didn’t find any explanation) and some 20% in vegetation. Thus the only possibility for a natural caused increase is rejected.
Indeed the biological cycle moves a lot of CO2 in and out and increased a lot, but as said before:
1. It removes first and releases only what was first removed out of the atmosphere, most of it diurnal and seasonally and a little bit over longer periods (mostly 1-3 years and the rest longer).
2. A cycle doesn’t net remove anything, only the difference between ins and outs does change the content of a reservoir.
3. The total biosphere since about 1990 is increasingly removing more CO2 than adding to the atmosphere.
Then all one-direction models like that of Koutsoyiannis and many others, have one point against them: any marker in the inputs never can exceed the ratio in the inputs in the further flows: the containers or the outputs.
Human FF emissions were 1-5% in the inputs 1958-2020, but are over 10% in the atmosphere and over 6% in the ocean surface. One-way model completely rejected.
Further, there is little doubt that the “equilibrium” CO2 level did not change a lot over time. One can shift it somewhat higher or lower, but a range of 30 to 60 years for the adjustment time still is an order of magnitude higher than de residence time of 4 years. Even the “thinned” levels of 14C (14-20 years adjustment time) or of the 13C/12C ratio adjustment time of around 15 years is way higher than the residence time.
Last but not least, with a residence time of 4 years, the table in Ed’s spreadsheet (tab: Test) shows the human caused increase in the atmosphere of 2020 at 72.47 PgC or an increase in the atmosphere of 40,71 ppmv.
The basic natural CO2 level was/is (IPCC) 589 PgC or 276 ppmv. Together some 337 ppmv.
Observed for 2020 is 414 ppmv???
From where comes the difference? Both the oceans as vegetation increased in carbon level, thanks to the short residence time…
Fredinand,
I don’t think natural fluxes have to increase in the same ratio as human emissions. The latter are zero order and the former first order. No violation of the equivalency principle.
Regarding 1., the biological cycle doesn’t remember when it recycled itself. Whether is was diurnal, yearly, or from fallen trees hundreds of years old.
As for 2., cycling is everything, otherwise nothing moves in and out.
“3. The total biosphere since about 1990 is increasingly removing more CO2 than adding to the atmosphere.”
Yes, but if you figure in a fraction of the removal was industrial sourced, the natural sink minus source eventually flips negative as the industrial content of the atmosphere increases.
I fail to understand why you claim the compartmental models are unidirectional. The only unidirectional model I can imagine is molecular escape from the atmosphere to space. In other words, the sentence “any marker in the inputs never can exceed the ratio in the inputs in the further flows: the containers or the outputs” is incomprehensible to me.
“Further, there is little doubt that the “equilibrium” CO2 level did not change a lot over time.”
That is totally argument by assertion and circular logic. You are using assumptions about an unvalidated Tau model as evidence against the Te models which suggests an expanding biosphere.
“From where comes the difference?”
Well, you explained it yourself. From the increasing ocean and terrestrial carbon levels. 276 ppm seems a bit low, but makes 414 ppm a 50% increase. Of that, the 41 ppm contributed by humans is 29%, leaving 71% or 97 ppm contributed by the growth in natural emissions. Unless proven otherwise, the null hypothesis on H1 stands.
Jim,
Indeed here we are at the crux of the matter. Thanks for your insight!
You have noticed the right difference between Te, used by several skeptics and Tau as used by several other skeptics and most “mainstream” scientists, including the IPCC.
Now the main remaining point is what happened with the equilibrium in current times.
From the past (ice cores) we know that the equilibrium changed with Antarctic temperatures at about 8 ppmv/°C or for global temperatures somewhere between 15-20 ppmv/°C. CO2 are direct measurements, be it averaged over 560 years (Dome C) and 600 years (Vostok), while T is derived from dD and D18O and mainly reflect the temperature where the snow was formed, thus near Antarctica.
https://www.ferdinand-engelbeen.be/klimaat/klim_img/vostok_t_co2.png
The discrepancies with the trend are largely caused by the (very) long lags of CO2 changes after T changes, especially during cooling periods, for which is not compensated.
Higher temperatures on land in general increase vegetation (more land available), that is a negative feedback for CO2.
For recent temperatures, we have the formula of Takahashi to calculate the change of CO2 as result of SST changes.
That gives not more than 13 ppmv since the LIA and 3 ppmv since 1958. The real increase since 1958 is over 100 ppmv together with 170 ppmv human emissions over the same period…
Then the possible increase of the equilibrium over the past decades.
That is completely true for about 90% of the sea surface: the pCO2 of the ocean surface follows very closely the pCO2 of the atmosphere. That means that the ΔpCO2 remains about the same (currently at ~7 μatm) and, together with chemical restrictions, that is reflected in the small increase of DIC at about 10% of the change in the atmosphere. For the current increase of about 5 PgC/year in the atmosphere, most of the ocean surface absorbs ~0.5 PgC/year.
That is not what happens at the extremes of the oceans: at some 5% of the ocean surface, the waters are sinking directly into the deep, due increased density from to low temperatures and salinity. That is at the edge of the sea ice, where SST is slightly negative. pCO2 there reaches ~150 μatm, far below the atmosphere. Moreover, that hardly changes over time, as long as there is sea ice. The same at the other 5% of the ocean surface, where deep ocean waters are upwelling, the temperature hardly changes (thanks to clouds!), thus the pCO2 remains high at around 750 μatm. That means that the equilibrium pCO2 between atmosphere and deep oceans hardly changed over the past few millions of years…
The difference between ocean surface and deep oceans is demonstrated by the difference in CO2 uptake: with only about 5% of the sea surface, the deep oceans absorb some 2 PgC/year, 90% of the surface absorbs only 0.5 PgC/year…
See: https://www.ferdinand-engelbeen.be/klimaat/klim_img/bern_balance.png
Thus, besides the straight forward linear uptake by vegetation, the ocean uptake also remains linear with the “old” equilibrium…
Jim,
Further, the rather stable equilibrium pCO2 of the oceans (and vegetation) is demonstrated by the small changes in Tau over the period 1958-current.
The total emissions are known, these are the cause of the CO2 increase in the atmosphere, but play no role in the pCO2 difference between atmosphere and the rest of nature.
The only assumption is that the base equilibrium since 1850 changed with SST with the formula of Takahashi. If one disagrees with that base, one can start with SST and CO2 in 1958, which makes hardly any difference:
https://www.ferdinand-engelbeen.be/klimaat/klim_img/acc_decay.png
Where [A] is the sum of all FF emissions (without land use changes), the observed increase in the atmosphere, the calculated influence of SST on the pCO2 of the oceans and the resulting ΔpCO2 between atmosphere and oceans.
[B] is the observed net sink rate and
[C] is the calculated Tau, based on the polynomial through the net sink rate, to avoid the influence of short time SST variations.
Dear Ferdinand,
Thank you very much for your many explanations of your hypothesis that says human CO2 caused all or most of the CO2 increase.
Thank you also for your response to my request to show your calculations in my suggested Excel format. My two takeaways are:
(a) that you acknowledge that this method of doing a time-step calculation is valid (and not an Invalid “model” as Dave Burton has called it) and
(b) Your numbers indicate that our major difference is in the Te that we insert for our calculation.
Of your many links, I recommend this one as your best summary of your argument in 42 slides:
https://www.ferdinand-engelbeen.be/klimaat/klim_img/on_the_co2_residence_time.ppsx
With all your work, you deserve a thorough reply to your argument, so I will try to do that in my next comment and in an update in my draft post above. I will show that your arguments, as summarized in your 42 slides — that conclude the true Te equals a tau of 50 years — will not fly.
After that, I will get back to the comments of David Andrews and others. But since your work is the focus of my post, you deserve my priority to recieve my best repies to your comments.
Thanks Ed,
Only one remark:
Te and Tau are completely different things:
Te is how long a single CO2 molecule (of whatever origin) resides in the atmosphere, before being completely removed (as mass) or exchanged with a CO2 molecule of another reservoir (no change in mass).
Tau is how long it takes to reduce a (one-shot or continuous) extra injection of CO2 as mass (of whatever origin) out of the atmosphere, back to (dynamic) equilibrium.
Tau is <= Te only if all in- and outflows are unidirectional (that is the "lake / batch tube" model)
Tau is completely independent of Te if cycles are involved that bring back CO2 from the outputs to the inputs (that is the "fountain" model).
I am working further on the spreadsheet to put it in about the same form as you have made…
Ferdinand,
I appreciate your kind remarks and responses to my suppositions.
At JULY 4, 2025 AT 1:42 AM, with regard to 90% of the sea surface you wrote, “ΔpCO2 remains about the same (currently at ~7 μatm)” and, for the other 10%, “equilibrium pCO2 between atmosphere and deep oceans hardly changed over the past few millions of years.” With respect, those are arguments by assertion. The obvious rebuttal is the fact that the surface ocean contains about 10% more carbon than it did pre-industrial. Somewhere recently I read where terrestrial mass is also increased, in other words, more vegetation to decompose. In the words of Koutsoyiannis and Johnson, the result is biosphere expansion. Therefore the “disturbance” decreases with time, but the amounts sourced and sinked increase yearly due to the always increasing driving force of extra carbon in the air. You could call my comments just assertion also, but I worked on a spreadsheet that I copied from Dr Spencer modified by changing Tau to Te and adding in realistic sources and sinks. It accomplishes the same results as models based on Berry, Skrable, Bolin & Erickson, and many others. Those models work, because the flow rates in nature stay relatively constant while the reservoir concentrations evolve. There is no need to explain why Tau wanders all over the place.
JULY 4, 2025 AT 2:54 AM you wrote, “Further, the rather stable equilibrium pCO2 of the oceans (and vegetation) is demonstrated by the small changes in Tau over the period 1958-current.” What stable equilibrium? The anomalous disturbance that ebbs and flows all the time everywhere? I propose small changes in Tau are an artifact of your flawed model.
“The total emissions are known, these are the cause of the CO2 increase in the atmosphere, but play no role in the pCO2 difference between atmosphere and the rest of nature.” I assume by this you mean the remaining industrial emissions playing a negligible role? This makes no sense. The addition of industrial carbon and possible incremental increases in natural emissions CREATE the pCO2 difference that causes nature to return to a new equilibrium. Perhaps you could summarize the equations that produce graphs A, B, and C. I’m working on a way to demonstrate how the simple math you and David Andrews rely on can give ambiguous results based on somewhat arbitrary choices of variables.
Jim,
Sorry should have been more clear: the (larger) human emissions play no role in the calculation of the adjustment time…
The simple math is in play in both the residence time as in the adjustment time.
In the case of the residence time, the math is always simple, whatever the direction of the flows.
In the case of the adjustment time that is only simple of the decay rate is in linear ratio with the distance between pCO2 of the atmosphere with the pCO2 of the oceans and plants. Which for both is the case.
As good as the carbon mass balance is simple bookkeeping of ins and outs…
Have a view on the (rough) carbon balance of the different flows (PgC/year) and net changes seen from the atmosphere side:
Human emissions: 10 in, 0 out; net change in the atmosphere: +10 (calculated from FF sales)
Atmosphere: 215 in, 210 out; net change in the atmosphere +5 (measured as increase)
Vegetation: 120 in, 122.5 out; net change in the atmosphere: -2.5 (measured via the O2 balance)
Ocean surface: 50 in, 50,5 out; net change in the atmosphere: -0.5 (measured as DIC in the surface)
Deep oceans: 40 in, 42 out; net change in the atmosphere: -2.0 (not directly measured, difference between total ins and outs of the atmosphere and difference with total for the oceans minus ocean surface, see Feely et al.).
All known other sources and sinks either much smaller or much slower in exchange rate…
The cycles give you the residence time, but even if these double, that doesn’t change the adjustment time with one year, only halves the residence time…
But please show me your calculations…
Ferdinand,
My operating system is no longer compatible with dropbox where I used to share access to files. I’m thinking of not sharing publicly anywhere anymore anyway. I will try to include all the necessary information for you to understand my calculations. They come from modifying a spreadsheet shared by Roy Spencer some four or five years ago at drroyspencer.com. The concept is similar to Dr. Ed’s “test” spreadsheet except, like Dr. Spencer, I’m only considering the atmosphere with all the other reservoirs combined into one.
I added a column to Dr Roy’s spreadsheet between column C, (anthro CO2 INFLOW), and column D, (“anthro” OUTFLOW), naming it Natural inflow. That column accumulates yearly based on the formula = 64 ppm + 1.3*(1E-17)*EXP(0.02*year). That formula calculates the value of natural inflow for all of the values for each year from 1750. It is an artifact of fitting the Mauna Loa data. Instead of Dr Roy’s 0.02 (1/Tau) and 295 ppm value for 1750 CO2 level, I used 0.23 (1/Te) and 280 ppm. The formula for each successive new value of total atmospheric CO2 (Cn) is Cn-1 + EHn + ENn – Cn-1 / Te.
This results in 2018 values of 4.74 ppm industrial in (from Boden et al.), 91.9 ppm natural in, 94.1 ppm total output. The calculated CO2 is 411.6 ppm compared to the actual 408.5 ppm, but the overall correlation with the Mauna Loa data is, if I don’t say so myself, better than Dr Roy’s. You can find his spreadsheet here: https://www.drroyspencer.com/2019/04/a-simple-model-of-the-atmospheric-co2-budget/
I learned that I can maintain a good correlation even with other values of initial CO2 and Te, but never without some increasing increment from other than the industrial source.
Ed and Jim,
The net effects of the differences between Te and Tau demonstrated for the past 175 years…
For the current atmosphere:
Dynamic equilibrium: for the current average SST, the equilibrium pCO2 between ocean surface and atmosphere would be around 295 ppmv. Can be calculated with the formula of Takahashi [1], if an equilibrium of the past is known. Some 13 ppmv since the LIA (worse case for the largest T increase reconstruction). Some 10 ppmv since 1850 and a few ppmv since 1958, if one doesn’t trust ice cores…
Situation in 1850 (IPCC, 2013):
628 PgC in the atmosphere
Sum of outputs: 168,4 PgC/year.
Net output: 0 PgC/year.
Te = 628 / 168.4 = 3.7 years
Tau = N/A
Situation in 1960:
673 PgC in the atmosphere
Sum of outputs: ~180 PgC/year [2]
Net output: 1.0 PgC/year
Te = 673 / 180 = 3.7 years
Tau = (673 – 628) / 1.0 = 45 years
Situation in 2020:
880 PgC in the atmosphere
Sum of outputs: ~236 PgC/year [2]
Net output: 4.7 PgC/year
Te = 880 / 236 = 3.7 years
Tau = (880 – 628) / 4.7 = 53 years
Looking for the zero net output (that is the equilibrium):
CO2(eq) = CO2(2020) – [CO2(2020) – CO2(1960)] / [Fnet(2020) – Fnet(1960)] * Fnet(2020)
CO2(eq) = 880 – [880 – 673] / (4.7 – 1.0) * 4.7 = 617 PgC
or about 290 ppmv. Not far from the situation in 1850. Not bad for a rough calculation.
The same calculations were done by Peter Dietze (1997!), Lindzen, Spencer and myself years ago…
My colleague, David Burton, used all recent figures to calculate the zero-net-sink equilibrium CO2 level at:
https://sealevel.info/Global_Carbon_Budget_2023v1.1_with_removal_rate_plot2.png
Then what is the real CO2 outflow caused by the absolute CO2 pressure in the atmosphere?
Also easy to calculate even with only two observations at 1960 and 2020:
F(abs) = 880 / (880 – 673) * (4.7 – 1.0) = 15.7 PgC/year.
Some 16 PgC/year of the CO2 outputs from the atmosphere into oceans and vegetation together is caused by the absolute CO2 pressure in the atmosphere. The rest of the over 200 PgC/year outputs are completely independent of the CO2 level in the atmosphere…
[1] (pCO2)seawater @ Tnew = (pCO2)seawater @ Told x EXP[0.0423 x (Tnew – Told)]
http://www.sciencedirect.com/science/article/pii/S0967064502000036
[2] Assuming that the outflows increase with the increase in the atmospheric, but also the inflows, thus only speeding up the cycles.
According to the IPCC, that is true for the ocean surface (but haven’t seen any explanation why that should be), but the expansion of the biosphere, and thus the expansion of the short seasonal bio-cycle, is a lot slower than the increase in the atmosphere, about half of it…
DEAR Dr. Ed
The carbon dioxide molecule excited by the IR photon loses its charge in max. 1 secundum and is capable of absorption again. This is a fact! So what are the prominent representatives of climate science arguing about?
Csaba Huszar
Not my best knowledge, but as far as I know, the opposite may be happening too: high energy O2 and N2 molecules may excite CO2 to emit IR by collisions:
I asked Google:
“can high energy O2 and N2 excite CO2 molecules to emit IR radiation”
And their AI responds with:
“Yes, high energy O2 and N2 molecules can indirectly excite CO2 molecules to emit IR radiation. While O2 and N2 don’t directly absorb or emit infrared (IR) radiation themselves, they can transfer energy to CO2 molecules through collisions, causing them to vibrate and emit IR radiation”
That is correct. I first learned about this from Prof. Will Happer, when I met him for the first time in 2014, when he taught a colloquium in the Physics Dept. at UNC in Chapel Hill.
I arrived uncharacteristically early for the colloquium, and was surprised and disappointed to learn that the UNC Physics Department had made no arrangements to record it. So I took the middle pair of seats on the front row and used my phone to record the audio. Prof. Happer kindly gave me his PowerPoint slides, and I combined the audio with the slides to make a usable video, which I posted on YouTube.
The sound quality is mediocre, and we don’t get to see his smiling face, but it is a lot better than nothing. You can find the PowerPoint slides and a link to the video here:
https://sealevel.info/Happer_UNC_2014-09-08/
Afterward, I exchanged emails with Professor Happer, and he generously answered my questions. That email exchange is on my website, and it is instructive:
https://www.sealevel.info/Happer_UNC_2014-09-08/Another_question.html
At temperatures and pressures normally found in the troposphere, air molecules, including CO2, are continually and very rapidly colliding with one another, and thus trading energy back and forth. Those collisional transfers are far more frequent than radiative emissions of photons (the other way that CO2 molecules have of giving up energy), so those collisional energy transfers keep the various constituent gases of the atmosphere in local thermal equilibrium.
When a CO2 molecule has been vibrationally excited with 82.66 meV of energy (which is the energy of a 15 µm photon), on average it takes about one full second(!!) before the molecule will emit a 15 µm photon! In contrast, the time before a CO2 molecule in the troposphere would lose that energy by collisional transfer to another air molecule is measured in nanoseconds, though it depends on altitude and temperature.
So even if a particular radiatively active gas in the atmosphere is absorbing lots of radiation, the effect of that absorbed radiation will be simply to warm the bulk atmosphere. It really doesn’t matter which gases absorb the radiation, nor what wavelengths the absorbed radiation was, the effect is just to warm the air. The N2, O2 & Ar are warmed to the same extent as the “GHGs” which absorbed the radiation.
The very rapid collisional energy exchanges (compared to radiative emissions) do NOT mean that emissions from CO2 are small or inconsequential. But they do mean several interesting things:
1. There are MANY energy transfers, back and forth between air molecules, for each emitted LW IR photon.
2. A CO2 molecule is far more often vibrationally excited with 82.66 meV of energy via collision with another air molecule than via absorption of a 15 µm IR photon, even if there’s a lot of incoming IR.
3. In the lower atmosphere, the constituent gases of the atmosphere all stay at almost exactly the same temperature, even though some of them are absorbing and/or emitting IR, and others are not.
4. The amount of IR emitted by the CO2 in a volume of air is determined by just two factors: the amount of CO2 it contains, and the temperature.
5. The amount of IR absorbed by the CO2 in a volume of air is NOT one of those two factors!
It is the temperature of the air (and the amount of gas) which determines the intensity of radiative emissions. Notably, the strength of radiative emissions from CO2 (or another GHG) is almost completely unaffected by the amount of radiation absorbed by that GHG (except indirectly, as the absorption of radiation warms the air).
As it happens, the Earth’s LW IR emission band peak is similar to the molecular bending mode energies of some gases, including CO2. But only triatomic (and higher) molecules have bending modes, so only molecules with three or more atoms can be “greenhouse gases.” That’s why, for example, O3 (ozone) is a GHG, but O2 (diatomic oxygen) is not a GHG.
Dear Dave,
Surely, you are not saying that Will Happer supports your irrational arguments in your special document and in your claims in these comments.
I can’t believe Happer would support such nonsense.
If the total emissions is the sum of each of the individual emissions: Et= E1+E2+E3…., and Quantity (Q) in the atmosphere is what is there now plus the total emissions minus the total sinks. It seems very reasonable to say that sink rate for the total would match the rate of sink for each individual emission source.
The crucial point of this discussion is: If we reduce our emissions will it cause the growth in Q to stop?
Dr. Ed’s approach says NO, only slow slightly. The opposition approach says YES. Both sides here seem to agree that growing CO2 concentration is not a problem but if Dr. Ed’s work is correct and it would certainly be a huge hurtle for those that espouse Net Zero.
The irony is that all this fuss about burning fossil fuels (CO2 increase) is a huge mistake. The only greenhouse gas that has a significant effect on climate is water vapor. Global WV is measured by NASA/RSS and the trend has been increasing about 1.4% per decade which is substantially faster than possible from just temperature increase of the planet (net effect of all forcings and feedbacks). WV has increased more than 3 molecules (more than 5 at ground level) for each molecule of CO2 increase. The WV increase is substantially more than possible from just planet warming (more than twice as fast). The WV increase can account for all of climate change attributable to humanity with no significant net contribution from CO2. https://watervaporandwarming.blogspot.com
The atmospheric process that partially explains why CO2 increase has no significant effect on climate is documented at Theory of Redirected Energy: https://energyredirect3.blogspot.com
Ed, you keep insisting that we err by ignoring anthropogenic removals of CO2 from the air. But that’s not an error, it just reflects what the data show: that anthropogenic removals are negligible.
Approximately 59 kt (= 0.059 Mt = 0.000059 Gt) of CO2 per year are removed from the atmosphere by Direct Air Capture projects, worldwide. That’s about 0.00015% of anthropogenic emissions. That’s obviously negligible. Those projects are scams.
Approximately 50 Mt (= 0.050 Gt) of CO2 per year is captured and stored by operational CCS facilities, but 99.9% of that is captured at the sources, so it’s really avoided emissions, not removals. But I suppose you could make the case that if estimated emissions are calculated from fossil fuel use then carbon capture at sources should be counted as removals. Still, that’s less than 0.2% of anthropogenic emissions, which is insignificant compared to the error bars.
What else? Cement carbonation?
According to GCB (2024), cement carbonation is estimated to remove about 214 MtC from the atmosphere per year, globally, which is about 0.784 Gt of CO2. (The claimed uncertainty is something like ±20%, but that’s surely optimistic.)
That’s conventionally considered a natural removal process, but you could make a good case for calling it anthropogenic removal. But it’s only about 2% of anthropogenic CO2 emissions, so even that is still much smaller than the error bars on anthropogenic emissions.
What else? Lumber?
Lumber production is roughly 2 billion cubic meters of wood per year, which contains about 2 PgC. That’s equivalent to the carbon in (2 × 3.66419 =) 7.3 Gt CO2. That’s a lot, but it’s carbon which was already removed from the atmosphere by trees (nature). That is, it’s carbon moved from a different “carbon reservoir” (the terrestrial biosphere), not from the atmosphere.
What else? Other agriculture?
Crops remove a great deal of carbon from the air. On a windless, sunny day, a healthy cornfield can almost completely deplete CO2 from the air at ground level by noon! But the nearly all of carbon removed from the air by crops (other than lumber) is soon returned to the air, through decay and digestion.
The bottom line is that anthropogenic CO2 removals from the atmosphere are roughly zero. Or, more precisely, they’re much smaller than the uncertainties in anthropogenic emissions of CO2, so they can be ignored in our calculations.
If you think that’s wrong, then tell me: what other anthropogenic processes do you think remove CO2 from the atmosphere?
Data references:
https://sealevel.info/Global_Carbon_Budget_2024_v1.0_with_ten_yr_avgs2.xlsx
https://www.perplexity.ai/search/globally-how-much-carbon-did-c-sWWftiSbTrqTCQyc8S2sfQ
Dear Dave,
If you tie a weight to a string, and whirl the weight around, then stop whirling and let the string wind up on your steady finger… what makes the weight speed up?
Ed
That’s a remarkably random question, Ed. (And I think you meant angular velocity, rather than “speed,” right?)
What does that has to do with anthropogenic CO2 uptake (your “Ah”)? And, what anthropogenic processes do you think remove CO2 from the atmosphere?
Dear Dave,
It has nothing to do with the effect of human CO2 on atmospheric CO2.
It is just a simple question to you to see if you can answer a simple question, simply, without making it very complicated with stuff that is irrelevant.
At least two meteololgy books I have read answered this question and related it to what makes the wind in hurricanes speed up as the air gets closer to the eye wall.
Just thought you were up on this simple physics.
Dear Dave,
I am looking for ANY calculations that you have done properly. That’s why I gave you the chance to answer a simple physics question that is at the freshman level of physics.
For example, you calculated the e-time of D14C to be 20 years.
https://sealevel.info/Graven2020_nofossil_logscale_1970-1995_annot6.png
You used data for about 1972 to 1986 from a log plot of D14C. You further claim others are wrong and you are correct.
There are two key problems with your calculation:
(a) The log plot does not give the correct answer because it does not relate to a balance level that D14C is decaying to.
(b) You are not using the full range of available data.
See Figure 9 of my paper above. It shows a proper curve fit to the D14C data using (8) that is derived from (2), and which shows that a proper curve fit to the D14C data must use two parameters: e-time and balance level. The curve fit in Figure 9 shows Te = 16.5 years and a balance level of zero. And it uses all the available data after 1970.
Figure 9 proves your calculation is invalid. In fact, Figure 9 supports (2), which proves just about everything you are claiming about the carbon cycle is wrong.
Ed, it is ironic that in your quiz question, to evaluate my freshman-level physics chops, YOU got it wrong: you said that the spinning weight speeds up, but it does not. Only its angular velocity increases.
Hopefully your mistake was just sloppy wording, rather than an actual misunderstanding. So I asked whether that’s what you meant—but you didn’t answer. So, again: Is that what you meant?
Regarding the atmospheric lifetime of “bomb spike” 14C, 15-17 years is what you get if you forget to take into account Suess Effect dilution. The log-linear plot is useful because that produces a straight line from an exponential decay process, such as the approximately constant-rate mixing of atmospheric carbon with other major carbon reservoirs, which is the dominant process decaying the radiocarbon bomb spike. But you needn’t use a log-linear plot to reach that conclusion. Here are two examples, using two datasets, which yield (approximately) the same result; one of them is linear, and the other is log-linear:
https://sealevel.info/ndp057_Fruholmen_d14CO2_hairlines3.png
https://sealevel.info/logc14_two_half-lives2.png
The reason for preferring the earlier 14C measurements is that there are two different processes shrinking the 14C bomb spike: one is dilution by mixing, through carbon exchanges between the atmosphere and other carbon reservoirs (mostly oceans and terrestrial biosphere). The other is Suess Effect dilution, due to the addition of 14C-depleted fossil carbon to the atmosphere.
The former process is the one we’re trying to characterize.
In the years immediately following the cessation of atmospheric H-bomb tests, dilution by mixing was the major process contributing to the bomb spike decay. But as the years passed, and anthropogenic CO2 emissions accelerated, Suess dilution became a bigger and bigger contributor.
What’s more, the quantification of Suess dilution is dependent on models, which I, frankly, don’t really trust.
So, by confining our analysis to the first couple of half-lives, we maximize the portion of the decay which is due to the process that we’re interested in, and minimize the portion due to Suess dilution and the possible modeling errors.
When you do that, you find a 14C lifetime of about 20 years.
Now, back to the question at hand: What anthropogenic processes do you think remove CO2 from the atmosphere?
Dear Dave,
You get a blue ribbon for your answer on the weight on a string. But my wording was meant to trap you. However, your answer is not perfect. You should have mentioned that energy is conserved, therefore. the speed of the weight cannot increase because that is the more fundamental reason the speed cannot increase.
Check my website menu: About/Adventure in Physics – Weight in a String.
https://edberry.com/an-adventure-in-physics-an-untold-story/
You will see that I published the first paper on this subject in the American Journal of Physics in 1963. I corrected the Scienfic American and two books on meteorology. After my publication, at the encouragement of one of my advisors, I did a simple experiment to further prove my point that the speed of the weight is constant.
Back to calculating the Te for Delta14C and for 14C.
My curve fit using (8) automatically takes into accout the Suess effect dilution because it requires setting the balance level as well as the curve fit. If the dilution were 10%, the balance level would have been -100 rather than zero. My figures 9 and 10 explain my point.
The D14C data show the Seuss effect is only a few percent at best. This means the human carbon is only a few percent of the total carbon in the atmosphere. Therefore, the human CO2 emissions add only a few percent to atmospheric CO2.
Your argument that claims the real amount of human CO2 in the atmosphere is much larger than that indicated by the Suess effect is junk science. It is not backed by data or testable hypotheses. It it imaginary handwaving that contradicts physics.
My curve fit with (8) follows the Delta14C data very closely, leaving little room for controversy or an alternate hypothesis.
Ed wrote, “…the human carbon is only a few percent of the total carbon in the atmosphere. Therefore, the human CO2 emissions add only a few percent to atmospheric CO2.”
It has been explained to you over and over why that is wrong. Exchanges of carbon between reservoirs do not change the amount of carbon in those reservoirs, but they change the distribution of 14C-depleted fossil between those reservoirs.
Ed wrote, “Your argument that claims the real amount of human CO2 in the atmosphere is much larger than that indicated by the Suess effect is junk science.”
Please don’t put words in my mouth. I haven’t said that. In fact, that doesn’t even make any sense, because the Suess effect does not “indicate” how much human CO2 remains in the atmosphere.
Using just GCB (2024) best estimates, ignoring CIs for economy of expression…
From 1750 (roughly the start of the Industrial Revolution) through 2023, human emissions added roughly 232 ppmv of fossil CO2 to the atmosphere + very roughly 105 ppmv of CO2 from land use changes, a total of 337 ppmv. Over the same time period, the amount of CO2 in the atmosphere increased by a net total of about 143 ppmv. Over that time period human removals of CO2 from the air were negligible (even if you count cement carbonation as anthropogenic, it was at most 3-4 ppmv). That means that nature removed (337 – 143) = roughly 194 ppmv of CO2 from the atmosphere.
But that does not mean that “the amount of human CO2 in the atmosphere” is 337 ppmv, or 232 ppmv, or 143 ppmv. The amount of anthropogenic CO2 remaining in the atmosphere is far below 143 ppmv, because of exchanges of carbon between the atmosphere and other carbon reservoirs, which reduce the amount of “human CO2” in the air without reducing the amount of CO2 in the air.
Now, Ed, will you PLEASE answer the question about your “An”? What anthropogenic processes do you think remove CO2 from the atmosphere?
Ed, in the comment below addressed to “Dave,” were you talking to me, or to Dave A? In it you complained about my (his?) “tau,” but I’ve said nothing about “tau.”
The model you depicted in your “Figure 3,” labeled “IPCC’s natural and human carbon cycles,” is based on a misunderstanding of Fig. 6.1 from AR5, and it is strikingly unphysical. It shows “human carbon cycle” distinct from a “natural fast carbon cycle,” which is nothing like physical reality, and certainly not what the IPCC’s diagram meant. Notably, your model diagram shows various “human carbon cycle” flows between the atmosphere and both “Land” and “Surface Ocean,” which have no basis in reality. It also shows unbalanced “human carbon cycle” flows from the atmosphere into & from both “Land” and “Surface Ocean,” yet shows zero “human carbon” accumulated in both, which obviously makes no sense.
I’m uninterested in analyzing that model, or the equations based on it. I prefer to focus on the real world.
You claimed that human processes removing carbon from the atmosphere (your “An”) are not negligible. So I discussed those processes, one by one, here:
https://edberry.com/co2coalition/#comment-112419
I showed you that your “Ah,” i.e., the anthropogenic processes which deplete the CO2 from the air, are negligible. More precisely, they are much smaller than the error bars on anthropogenic emissions, so they can be ignored in “mass balance” arithmetic. Even if you count cement carbonation, anthropogenic CO2 removals are still only about 2% of anthropogenic CO2 emissions.
● If you now understand that that is correct, then please acknowledge your error, so that we can move on.
● Or if you still think that’s wrong, then please demonstrate that. Please answer the question I keep asking: What anthropogenic processes do you think remove CO2 from the atmosphere?
“If an honest man is wrong, after being shown his error he either stops being wrong or stops being honest.”
– unknown (related by Andre Bijkerk)
Dear Dave,
Here’s my point.
You claim my equation (2) is wrong and that your (and Ferdinand’s) tau is correct.
Yet, nothing you say contradicts (2).
So, your argument are meaningless.
But your tau cannot explain how inflows set balance levels. Your tau cannot explain how nature held a CO2 level before human carbon had any influence on the CO2 level.
Therefore, you tau is a product of your imagination. It adds nothing to your explanations of anything relevant to how carbon flows through the carbon cycle.
You do not have any equation that might substitute for (2). You don’t even realize that you must provide such and explanation to justify all your handwaving about more data that is nice but proves nothing relevant to the core of your message or to the core of our debate.
So, where is your replacement equation for my (2)?
Dr. Ed,
On page 5, there is an indented paragraph with a quote by “Robert.” The end quote is inside the period rather than, by custom, outside.
Another nit pick on page 16, 4th to the last paragraph, “It also says each individual gas flow independently.” Should be “flows,” no? Or “It also treats each individual gas flow independently.”
The 4th paragraph on page 18 is “IPCC’s true human carbon cycle shows human CO2 causes only 8% of the CO2 in the atmosphere. This proves IPCC’s H(1) that claims human CO2 is 33% of the CO2 in the atmosphere is wrong.”
Shouldn’t it be “…8% of the increase of the CO2…” Also in the next sentence, “…human CO2 is (or causes) all of the 33% of the increase of the CO2…”
Where is 8% calculated? I see the 8% shown in Figure 9, but it isn’t specifically explained previously, unless I’m mistaken. The present article does not suffer from brevity, but perhaps adding that explanation or a reference to it in past papers would be appropriate.
Dear Jim,
Thank you for finding more English errors in my draft, which are now fixed in the next update I will post. Regarding you final suggestion, my text now is:
Berry (2019, 2021, 2023a) derived IPCC’s natural carbon cycle as explained above. Since IPCC’s human carbon cycle must use the same e-times as IPCC’s natural carbon cycle, according to the Climate Equivalence Principle, Berry calculated IPCC’s “true” human carbon cycle.
IPCC’s true human carbon cycle shows human CO2 causes only 8% or 33.6 ppm of the 420 ppm of CO2 in the atmosphere. This proves IPCC’s H(1) that claims human CO2 is 33% or 140 ppm of the 420 ppm of CO2 in the atmosphere is wrong.
Ed,
As I have said many, many times before, neither me, nor Ferdinand, nor Dave Burton, nor Jerry Elwood, nor the IPCC has claimed that your “human carbon” is 140 ppm of the present atmosphere. We all know it is much less. I have told that to Skrable, to Koutsoyiannis, to Harde and Salby, to Ato and to others in the parade of deniers that has come through [junk] Science of Climate Change. I have told that to Jim on this thread. I explicitly told you in our “debate” in SCC in 2023. If you read the Seuss paper from the 1950’s, you will see that he was well aware that balanced exchanges (aka “disequilibrium isofluxes”) between the atmosphere and land/sea reservoirs would dilute his effect. I provided a link on this thread to a Radiocarbon paper showing the (diluted) Seuss effect, measured before atmospheic nuclear testing complicated things in the 1950’s. You continue to either willfully misunderstand, or intentionally misrepresent, good science.
That good science leaves no doubt where the atmospheric carbon increase is coming from : Us.
Dear David,
Well, let’s review what we are talking about in this post. The CO2 Coalition’s special document we are discussion says in its abstract:
“Since the beginning of the Industrial Revolution in the late 1700s, the average concentration of Earth’s atmospheric carbon dioxide (CO2) has increased by about 140 parts per million by volume (ppmv) to the current amount of about 420 ppmv. This is much higher than concentrations of the past 800,000 years, which rarely exceeded 300 ppmv, according to ice core data. In this document, the CO2 Coalition presents multiple lines of scientific evidence demonstrating conclusively that the modern increase in CO2 is mainly due to anthropogenic emissions.”
And in its introduction:
“That is, nature is removing CO2 from the atmosphere rather than adding to the total. Since nature is removing large amounts of the gas nearly every year, it follows that the rise in atmospheric CO2 cannot be from natural causes.”
“We use multiple lines of scientific evidence to demonstrate that nearly all the increase in
atmospheric CO2 is from human emissions, most of which are from fossil fuel use.”
So, David, do you agree with these CO2 Coalition statements, or do you disagree?
Do you agree or disagree with the arguments by the authors of this special document?
Ed,
What’s odd about your argument is that you are telling us what we think. You did the same when you wrongly told us that our “natural absorption” term left out the natural absorption of industrial carbon. WE, not you, get to define what OUR terms mean. You consistently try to create straw men by misrepresenting valid arguments.
Dear David,
Amazing. I ask you two questions, that are normal for a debate, and you refuse to answer them:
“So, David, do you agree with these CO2 Coalition statements, or do you disagree?”
“Do you agree or disagree with the arguments by the authors of this special document?”
Further, you claim:
“What’s odd about your argument is that you are telling us what we think.”
Have you truly lost your mind?
Dear David,
Replying to your comment on July 1, 2025 at 10:25 pm
Your reference https://www.cambridge.org/core/services/aop-cambridge-core/content/view/193CDF1F705B269BC975AF178CEF1AC3/S0033822224000274a.pdf/discussion-presentation-of-atmospheric-14co2-data.pdf
does not in any way “rebut” my papers.
My section 2.8 discusses the Suess Effect because it is part of my calculations. I note
The Suess Effect is not a cause. It is a result of human CO2 inflow that dilutes natural CO2. Berry’s accurate curve fit shows human CO2 causes no significant “Suess effect dilution.”
Your referenced Figure 2 indeed shows a Suess effect of a few percent. That agrees with my calculations of the expected Suess effect. It shows human CO2 in the atmosphere is about 8%. In other words, your Figure 2 supports my (2) and its calculations using IPCC’s data and my Figure 9.
Even the IPCC knows its carbon cycle data is not perfect, so no one expects perfection in carbon cycle calculations. I notice that your D14C data extends to 2020 whereas my data ends in 2015. So, I will upgrade my data and make some minor revisions to my calculations. But we are not looking at any data that will substantially change my conclusion that human carbon emissions have little effect on the CO2 level.
But your paper is lacking something very important, as shown in my Figure 10, which shows the likely reason 14C increased since, say, 1955 is because 12C inreased while the D14C balance level remained near zero.
The balance level is the critical factor because it represents the continuing inflow of natural carbon (or CO2) into the atmosphere.
Since the D14C balance level has remained near zero even while the bombs increased 14C, the balance level is the best measurement we have of the effect of human carbon on atmospheric carbon. And it clearly shows the inflow (and balance level) of human carbon is somewhere between zero and 8% of the total carbon in the atmosphere.
Seems to me that you agree with (2) even though you cannot bring yourself to admit it.
In addition to what David Andrews said (and many skeptics endorse)…
Take an example:
In Europe, each country that uses the Euro has its own 1 and 2 euro coins. One side is the same with the value, the other side is different for each country. Coins from small “countries” like Andorra (between France and Spain) and the Vatican are very rare and real collectors items.
See:
Now, one day, I bring 300 Andorran one euro coins to the local bank. Coins are not that frequently used anymore in the bank transfers, so they have only 600 coins of different countries in stock. Together that gives a sudden increase to 900 coins in total, of which 300 from Andorra.
There are a lot of transactions of coins each day in the bank, which exchange some 180 one euro coins per day. Exchange, not remove.
While at the start 33% of the coins going out are from Andorra, few will come back, as the total number of one euro coins outside the bank is enormous and doesn’t contain much Andorran coins. So the number of one euro coins in the local bank will get reduced very fast with a “residence” time of about 4 days.
At the start there is a 50% increase of all one euro coins in the local bank, that number will slowly get reduced to the “normal” local level of 600 coins at a much slower speed of about 50 days “adjustment” time for any increase of coins from any country.
That results in following graph:
https://www.ferdinand-engelbeen.be/klimaat/klim_img/andorra_decay.jpg
As you can see: the part of Andorran coins is dropping very rapidly, while the number of total coins only slowly get reduced.
Or the difference between the residence time and the adjustment time.
Just replace FF CO2 for Andorra and all CO2 for total coins and make it years for days…
The number of observed FF molecules remaining in the atmosphere is what the input and the residence time caused.
The amount (pressure) of total CO2 in the atmosphere above equilibrium and what is net changing, is reflected by the the adjustment time, independent of the residence time.
First graph:
https://www.ferdinand-engelbeen.be/klimaat/klim_img/andorra_euro.jpg
Dear Ferdinand,
David Andrews tried a similar stunt to your in our 2023 debates. Andrews boasted that the solution could be found in Monte Carlo calculations. He was trying to dump on my equation (2). So, I showed David how the balance levels that I derive from (2) produce a quick and more accurate solution than a Monte Carlo calculation.
Your challenge is similar and easily answered by my (2). So, thank you for supporting (2) and thereby all of its derivations.
Dear Ed,
Your equation (2) only shows how many Andorran coins are left over time, the increase in total coins from 600 to 900 coins anyway was caused by the supply of 300 Andorran coins, no matter how fast these in the next days were replaced by equation (2) by coins from other countries.
That is completely irrelevant for the cause of the increase in coins and how fast the extra number of coins about the “equilibrium” of 600 coins are removed.
The decline of the total number of coins (of whatever country) or the “adjustment time” of the total number of coins back to 600 is all what is of interest…
Exact the same points as for CO2 in the atmosphere…
Dear Ferdinand,
You better stick to the carbon cycle. Your attempt to make your point using coins fails.
You have not shown in any of your arguments that your tau produces a more valid explanation of the carbon cycle than (2).
Jim,
“Shouldn’t it be “…8% of the increase of the CO2…” Also in the next sentence, “…human CO2 is (or causes) all of the 33% of the increase of the CO2…”
Is exactly where it goes wrong: 8% (meanwhile over 10%) of all CO2 in the atmosphere (and over 6% of the ocean surface water CO2) is from fossil fuel origin, as the decrease in 13C/12C ratio shows and the other possible main source of low-13C, vegetation is growing, this leaving more 13C behind in the atmosphere…
That doesn’t disprove that FF is the cause of the 33% increase in the atmosphere, only that some 2/3 of the original FF molecules were exchanged with CO2 molecules from the deep oceans, “thinning” the FF “fingerprint”:
https://www.ferdinand-engelbeen.be/klimaat/klim_img/deep_ocean_air_zero.jpg
Dear Ferdinand,
This is in reply to one of your comments far above in these comments.
Your definition Tau is meaningless because you define Tau not as a (level / outflow) but as a (difference in levels / an unspecified and invalid outflow).
You have not provided a substute for my (2). Therefore, you have no rational model. You have no way to calculate how nature could have produced an equilibrium in the levels before we assume human carbon interferred with this equilibrium.
You have not proved there is any need for a Tau that differs from Te, or that your Tau brings anything to the table to explain how carbon flows in the carbon cycle. In other words, your Tau does not even describe nature, let alone the effects of human carbon.
Your use of “removal” rate is not physics or even science. Removal rates have physics backwards. The only way to structure a carbon cycle model is to use the equation (2) Outflow = Level / Te.
You tell your story about how flows continue without changing levels but you do not realize that this is properly explained by (2). Your story does not justify using a Tau to replace Te.
You claim for 2020 that the total carbon outflow from the atmosphere is 15.7 PgC/year.
Even the IPCC recognizes the carbon outflows (as of 1750) were about 108 PgC to Land and 60 PgC to Ocean, for a total of 168 PgC/year outflow.
Your CO2 Coalition-approved model is one of the biggest frauds in climate history. The CO2 Coalition is way left of the IPCC’s position on climate.
You reference other publications (Dietze, Lindzen, Spencer) in your attempt to prove your claims, without realizing that these publications are also wrong.
How can the people in the CO2 Coalition get science so wrong?
Your Tau model cannot explain how D14C, after 1970, declined back to its original balance level of zero.
This D14C decline may be the most important accidental set of data relevant to our discussion of the effect of human carbon on the observed CO2 increase.
Yet, you do not address this subject in a manner supported by physics.
Your formulation does not recognize or calculate balance levels. Because of that omission in your model, you misinterpret the data. (Same for David Andrews, by the way).
Perhaps your most glaring error of all, is your twice-repeated claim in these comments:
“Where Tau is the exponential decay rate to reduce a disturbance (like the addition of extra CO2 from whatever source) to 1/e of the initial disturbance.”
You don’t get it that only my (2) properly explains the 1/e decrease (found in the D14C data) and which properly explains how carbon flows in the carbon cycle.
So, your argument has come full circle.
You allow that (2) expains the initial D14C decrease, but then you claim (2) does not explain this D14C decrease when D14C gets closer to its balance level.
You then claim you need Tau to explain the decrease closer to the balance level. Yet, you don’t even know what a balance level is, or how to define it.
Then you claim:
“Where Tau is the exponential decay rate to reduce a disturbance (like the addition of extra CO2 from whatever source) to 1/e of the initial disturbance.”
Which means you are recognizing, without knowing it, that (2) indeed explains the complete approach of a level to its balance level.
All your CO2C claims are delusional junk science because, in the end, you indeed recognize, in your 1/e claim, that (2) is the correct explanation of carbon flow.
Common Dr. Ed, have you never heard of an exponential decay rate for a disturbance of a process in equilibrium? Or Le Chatelier’s principle?
Te and Tau have completely separate definitions.
Te indeed is the residence or “turnover time” that can be expressed with the simple formula:
Te = mass / output
That shows how long a single molecule of CO2 (of whatever origin) in the atmosphere resides in the atmosphere before either being removed, with or without a change in total mass in that reservoir, or being swapped with a CO2 molecule of another reservoir, thus without a change in total mass within that reservoir.
Wiki gives a nice definition for the residence time:
https://en.wikipedia.org/wiki/Residence_time
Tau is how long it takes for a process in equilibrium that is disturbed by an extra input of one of the reactants to get back to 1/e of the original disturbance.
Again from Wiki for an exponential decay:
https://en.wikipedia.org/wiki/Exponential_decay
and of Le Chatelier’s principle:
https://en.wikipedia.org/wiki/Le_Chatelier%27s_principle
These two, Te and Tau can be equal if, and only if, all flows are unidirectional.
The real world shows that 95% of all CO2 fluxes are bidirectional: half the day or half the year CO2 inputs get outputs and reverse that in the other half.
That is our model, which reflects the real world.
Many before me have calculated the equilibrium between the ocean surface and the atmosphere as 280-300 ppmv for the current average sea surface temperature. That is where Tau is based on: the effect of the difference between the CO2 pressure (pCO2) in the atmosphere and that equilibrium. That gives a small real NET output of only half human emissions in both oceans and vegetation together. No matter how much CO2 circulates through the atmosphere. No matter how high the CO2 outflows (thus Te or your formula (2)) get. Completely unimportant for the NET outflow, which is the only part in the total ins and outs that changes the CO2 level in the atmosphere and other reservoirs.
Your model includes a 3.5 years decay rate for all CO2 molecules and for all isotopes alike.
The decay rates for 14C in the atmosphere are calculated between 12 and 20 years.
The decay rate for the 13C/12C ratio is about 15 years.
The decay rate for 12CO2 and 13CO2 mass, back to equilibrium at around 295 ppmv is about 50 years.
Completely independent of and much slower than your residence time…
Thus your formula doesn’t calculate what the observations show.
The only reason for a faster decay rate of the 13C/12C ratio or the 14C of the bomb tests, compared to the mass of 12/13CO2 is that the isotopic ratio’s are redistributed over all reservoirs and a lot of “old” seawater from the deep oceans from long before the use of fossil fuels or atomic bomb tests is coming back with the old isotopic composition.
With your residence time of only 3.5 years, your calculated increase in the atmosphere gets far lower than what is observed. In your spreadsheet (tab: Test) the human caused increase in the atmosphere in 2020 is 72.47 PgC or an increase in the atmosphere of 40,71 ppmv.
The basic natural CO2 level was/is (IPCC) 589 PgC or 276 ppmv. Together some 337 ppmv.
Observed for 2020 is 414 ppmv.
From where comes the difference? Both the oceans as vegetation increased in carbon level, thanks to the short residence time, thus can’t be the source of the increase in the atmosphere…
Then a few points as direct answer:
“Your definition Tau is meaningless because you define Tau not as a (level / outflow)”
The whole world defines Tau as the time needed to reach 1/e of a disturbance of a process in equilibrium…
“You claim for 2020 that the total carbon outflow from the atmosphere is 15.7 PgC/year. ”
I did claim, based on observations, that the part of the outflows caused by the absolute pressure of CO2 in the atmosphere is 15.7 PgC/year. The rest of the outputs is NOT caused by the absolute pressure of CO2 in the atmosphere. These are caused by temperature, photosynthesis, life and pCO2 differences, largely to completely independent of the CO2 pressure in the atmosphere. I did not claim that all carbon outflow from the atmosphere is 15.7 PgC/year.
“Which means you are recognizing, without knowing it, that (2) indeed explains the complete approach of a level to its balance level. ”
Except that the real speed to reach the balance level is 50 years for any excess CO2 in the atmosphere, not 3.5 years. You simply don’t see the difference between the residence time of an individual molecule CO2 (of 3.5 years) based on the sum of all outflows and a mass removal time (of 50 years) which is based on the NET outflow, that is the difference between all inflows and all outflows.
Dear Ferdinand,
I put your comments in quote.
The only definition of Te that is important is equation (2).
Te (2) and the continuity equation (1) fully explain the carbon cycle.
No other definition matters because equation (2) governs the carbon cycle model.
Te explains the real world and Tau does not.
The many before you were wrong. We now have a new carbon cycle generation defined by (1) and (2).
Tau is irrelevant because Net output is irrelevant to a carbon cycle model.
No, my “model” which is (1) and (2) does not specify any value for Te.
IPCC’s data for its natural carbon cycle show the overall Te for carbon in the atmosphere is 3.5 years.
However, carbon isotopes 14 and 13 have a larger Te. For example, D14C data show the Te for 14CO2 is close to 16.5 years.
NO. Data reject your claim.
No, the isotopes follow their own independent carbon cycles with their own Te. Otherwise their carbon cycle are the same.
NO. You have no basis in data to make that claim.
My carbon cycle exactly replicates IPCC’s data for its natural carbon cycle at equilibrium. Your model cannot do this.
Therefore, the data reject your model and accept my model.
My Test spreadsheet used in inflow of 10 PgC/year which DOES NOT represent real data.
There’s no difference because these were not real data.
YES. But only Te repesents the 1/e value. Tau cannot. Case in point: D14C data.
You refuse to recognize that (2) produces the equilibrium that matches real data.
Figure 5 shows that Te is the time it takes for the level to move 63% toward its balance level, no matter where we start. Te properly defines the “speed” to reach the balance level.
You simply have not measured the speed to balance level correctly.
Nonsense. Forget about your “individual molecule” thing. Te fully describes how fast a level moves toward its balance level. Your Tau adds nothing but confusion and errors.
Einstein said we must keep things as simple as possible to explain a physical system. You are adding complexity that is not needed.
Dear Ed,
Only one remark, which is at the essence of our dispute:
Me: ” In your spreadsheet (tab: Test) the human caused increase in the atmosphere in 2020 is 72.47 PgC or an increase in the atmosphere of 40,71 ppmv. ”
You: “My Test spreadsheet used in inflow of 10 PgC/year which DOES NOT represent real data.”
It does for the years after 1800, but in your tab “HumanBB” anyway you use the real data of FF emissions and the calculated increase in the atmosphere, caused by these emissions, according to your formula (2) for all flows.
For the years 2010 and 2020 your calculations show:
Year Lg La Ls Ld Total La ppm
2010 154.35 57.05 29.98 112.77 354.14 26.91
2020 196.10 70.18 37.95 147.32 451.55 33.11
The observed CO2 levels were:
2010: 390 ppmv
2020: 414 ppmv
Or an observed increase in La vs. 1750 of:
2010: 114 ppmv
2020: 138 ppmv
Your calculations with formula (2) don’t match the observations and give much too low results for the observed total increase of CO2 in the atmosphere… That is because your individual Te’s are about a factor 4 too fast…
Dear Ferdinand,
In reply to your comment: July 8, 2025 at 4:25 am
You are correct that my calculations in HumanBB show a much smaller increase in CO2 that the total measured CO2.
That is because my HumanBB calculations are only for human CO2. Notice, those calculations begin with zero levels in the reservoirs and only human carbon gets added each year.
The difference is the amount that natural carbon has added to the atmosphere.
You have discovered how I calculated the effect of human CO2 by using IPCC’s own data.
Thus, my conclusion that according to IPCC’s own data, human carbon adds very little to the CO2 in the atmosphere.
The tabs in the results disappeared…
Anyway, your results from equation (2) in human ppmv increase are:
2010: 26.29 ppmv
2020: 33.11 ppmv
The observed increases are:
2010: 114 ppmv
2020: 138 ppmv
Equation (2) doesn’t reflect reality…
Sometimes my English is too phonetic… Common is of course Come on Dr. Ed…
No problem, there, Ferdinand. Your English is excellent.
To Everyone,
The dark side uses clever ways to promote its invalid claim that H(1) is true.
Figure 11 (in my paper above) is a replot of a figure in CO2C. It has a logical error in the way its data are plotted.
CO2C does not catch this error, which means the CO2 Coalition reviewers are not very concerned about republishing junk science.
I could have explained the error in Figure 11, but I thought I would give you a chance to find it on your own.
Will you be the first to find the error in Figure 11?
Dear Ed,
I don’t see any error in that plot:
All what was plotted at the left part of the curves, is the observed combination of O2 and CO2 measurements.
Observed.
At the right side there is a plot of the calculated drop in O2 by burning FF for each type of fuel and the sales for that type and the increase in CO2 if all that FF derived CO2 remained in the atmosphere.
Then one subtracts the calculated O2 release by plants, that is the difference between the above calculated O2 use and what was observed, which is caused by their CO2 uptake, which gives a stoichiometric release of O2 for each CO2 molecule absorbed.
Then one subtracts the calculated CO2 uptake by plants from the FF drop. The remaining gap in CO2 uptake is what the oceans did absorb.
The graph has the ocean and vegetation uptake in reverse order for clarity of the graph, but anyway, without ocean uptake, it would end at the same height as the observed O2 level, with a minor difference, caused by the out-gassing of O2 by the warming oceans. Maybe you have a different sink available than the oceans, but as DIC measurements in the ocean surface show: the oceans are net sinks for CO2.
So I am very curious what the “glaring error” could be, as I don’t see any error in that graph.
Ed,
Of course I agree with the CO2 Coalition’s conclusion that the rise in atmospheric CO2 is anthropogenic. But we are all also on record as saying that does not for a minute imply what you seem to think it implies, that today there should be ~140 ppm of C14 devoid “human carbon” in the atmosphere. We all understand disequilibrium isofluxes. You quite obviously either do not understand, or do not want to.
I have to say that it is rather sad that you spent such an effort over the years showing that “human carbon” is not abundant in our atmosphere, when all you had to do was have a conversation with Hans Suess some 70 years ago to anticipate it would not be.
So, you still think that the 4% human carbon inflow can cause 33% of the CO2 level in the atmosphere even as you agree that the Suess effect has never been greater than 8% and likey never greater than 4%.
Good luck with that one, David.
Dear Ed,
With an input of only 1 to 5% FF in total inputs, the observed ratio of FF in the atmosphere is already over 10% and over 6% in the ocean surface. The rest of the FF molecules gets into vegetation and the deep oceans, where it is more difficult to measure. The speed at with the FF molecules are exchanged is caused by the residence times. No problem with that. That is about CO2 molecules.
The speed at which the total mass in the atmosphere get reduced to the equilibrium with the ocean surface is of a complete different order: an observed year by year increasing NET removal of CO2 mass (of whatever origin) out of the atmosphere. NET removal. That is observed (!) as only half the current human emissions. Or a Tau of around 50 years.
Moreover, the sum of all FF emissions over time is near twice the observed increase in the atmosphere:
https://www.ferdinand-engelbeen.be/klimaat/klim_img/acc_co2_mlo_t_1960-cur.png
Thus nature removed about half of the FF emissions as mass (and 2/3 of the FF molecules were replaced by molecules from other reservoirs). Thus nature is not the cause of the CO2 increase in the atmosphere. Human emissions of FF CO2 are.
Each year the calculated (quite exactly known from taxes!) FF emissions are average twice the observed increase in the atmosphere over a year, be it with huge year by year variations in net sink rate (not net source rate!):
https://www.ferdinand-engelbeen.be/klimaat/klim_img/dco2_em2.jpg
With the exception of a few borderline (El Niño) years.
Any bookkeeper worth his/hers money will tell you that FF emissions are the cause of the increase in the atmosphere. No matter your formula (2)…
Dear Ferdinand,
Perhaps to give you some perspective, please look at my Figure 7. The top row shows the natural distribution of natural carbon among the four IPCC reservoirs. Only 1.4% is in the atmosphere. 90% is in the oceans. This is the equilibrium distribution for the fast carbon cycle.
Human carbon has added about one percent to the total carbon in the carbon cycle. If humans ever stop emitting carbon to the atmosphere, the human carbon cycle would move to the same equilibrium percentages as the natural carbon cycle. At that equilibium, human carbon would all only 4 ppm to the atmosphere.
My calculations do perfect carbon accounting because I keep human carbon atoms separate from natural carbon atoms. No one else, to my knowledge, is keeping the human and natural carbon atoms entirely separate in their carbon cycles. Not even you.
My one specific objection to your comment is there is no Tau of around 50 years. My figure 5 shows e-time s the time for a level to move 63% of the way to its balance level. You claim your tau does the same thing. Therefore, you tau is really my Te. There is no difference. Te explains everything you use to justify your use of Tau.
Figure 5 shows how the level approaches its balance level seemingly very slowly as it gets closer to its balance level. You have use that “very slowly” feeling to invent a tau but your tau is still Te.
I think the other weakness in your argument is that you do not yet understand balance levels.
And good luck to you convincing people net global uptake is negative.
The socialists have an agenda that relies on all CO2 emitted in the last 150 years came from humans and that CO2 never rose above 300ppm until humans started burning fossil fuels. Any evidence to the contrary has to be somehow destroyed at all costs, no matter what the costs.
I said that CO2 rose to 450ppm twice during the last 200 years from instrumental measurements. I never mentioned Beck. But Uncle Bert immediately went on the attack against Beck.
Beck compiled some 200,000 instrumental CO2 measurements from 901 different locations from many dozens of highly qualified and notable scientists. Beck never made any measurements, he just collected them. He is the messenger. Yet the socialists choose to attack him vigorously. Don’t attack the science or the measurements, shoot the messenger.
Uncle Bert has just written more totally unverifiable specious waffle including false statements. Harro Meijer and Ralph Keeling have tried to falsify the 1812 to 1961 instrumental record and failed miserably. Now Uncle Bert’s having a crack. The socialists never give up when their narrative is in jeopardy.
Uncle Bert said:
“When one did choose only the measurements over the oceans or at the coast, with wind from the seaside, all these measurements are on or below the ice core measurements”
False.
Figure 7 from:
Yndestad Harald, 2022b: Lunar Forced Mauna Loa and Atlantic CO2 Variability; Science of Climate Change, Vol. 2.3 (2022) pp. 258-274; https://doi.org/10.53234/scc202212/13 ; https://scienceofclimatechange.org/wp-content/uploads/Yndestad-2022-Lunar-Forced-CO2-Variability.pdf
Shows CO2 in a range from 370ppm to 300ppm from 1820 to 1960. 50% of these measurements were over the ocean.
Nothing in all of his comment or links on July 4, 2025 at 3:04 pm did anything to falsify the 1812 to 1961 instrumental record. He’s done much the same as Meijer and Keeling, cherry pick one or two locations and claim these measurements can’t be correct, therefore all the remaining 900 locations are all wrong too. In his attack on the measurements in the supplied link he keeps referring to a background layer. Charles Keeling demonstrated with his measurements that there was no difference between CO2 measurements at the surface to 4,300 metres up on mountain tops.
I.e. His measurements demonstrated there was no such thing as a background layer. There was only a difference if the measurement location was in the middle of a forest. Out of the 901 locations in the 1812 to 1961 instrumental record, Charles Keeling only found one. The 1812 to 1961 instrumental record demonstrated the same as Keeling’s own measurements.
There was no difference over the oceans. Keeling falsified his own background layer nonsense. The background layer is a red herring.
Uncle Bert tried to say that Beck did not interpret the measurements correctly. You can’t interpret measurements. A measurement is a measurement.
Uncle Bert, along with Meijer and Keeling, are all saying the measurements are wrong and the proxies are right. There is complete ignorance with the monotonic ice core record. It shows an average and does not show the up and down extremes in the record. To see the extremes you need to look at Stomata proxies. Then Uncle Bert comes out with the astonishing comment that “Stomata data are local proxies which are calibrated to ice core values”. What a load of nonsense. This comment demonstrates just how desperate Uncle Bert’s specious waffle has become. In addition, CO2 rose to 400ppm in 500 AD. See Figure 14 in:
Mixing Proxy and Measured Data
DOI: 10.13140/RG.2.2.19788.95360/1
https://www.researchgate.net/publication/354144035_Mixing_Proxy_and_Measured_Data
This is CO2 from plant stomata for the past 1,800 years. Chart adapted from Kouwenberg et al 2004 by Dr Robert Holmes in his video presentation The Ice CO2 Record is “Probably Wrong” Too.
Holmes, (2019b) https://www.youtube.com/watch?v=WNEQo6lk9ko&t=2s “The Ice CO2 Record is “Probably Wrong” Too YouTube video with many references to the literature, accessed 20/11/2023.
Uncle Bert, along with Meijer and Keeling, are trying to falsify a measurement because it is an inconvenient truth and destroys the socialist narrative. A measurement is a measurement. You can’t re-interpret it or falsify it to suit your predetermined narrative.
Finally, Figure 2 from:
Yndestad Harald, 2022b: Lunar Forced Mauna Loa and Atlantic CO2 Variability; Science of Climate Change, Vol. 2.3 (2022) pp. 258-274; https://doi.org/10.53234/scc202212/13 ; https://scienceofclimatechange.org/wp-content/uploads/Yndestad-2022-Lunar-Forced-CO2-Variability.pdf
is the average from 901 locations from all over the world, most were over the oceans. Many locations were on mountain tops, one even higher than Mauna Loa. Many along beaches. The key to the accuracy of these measurements is the 3 year overlapping period of 1958, when Mauna Loa began and 1961 when the 1812-1961 instrumental record ended. For that 3 year period the two different measurements mirrored each other and were almost identical.
I’ll probably be locked out of this discussion yet again for another week. I anticipate this will be my final comment. Good luck to those with the patience to sift through Uncle Bert’s specious waffle. I’ve had the experience before and it is not pleasant. The socialist political activists are 24/7 in their political endeavors. We normal people have lives to live.
Dear Brendan,
You will not be locked out of these discussions. So, keep commenting.
I am not blocking any opinions from these comments because I want this to be an open discussion.
Sometimes, WordPress does not recognize a commentor’s email address. So, it holds a comment until I approve it.
I am not at my computer 24 hours a day, so sometimes a comment gets put on hold until I arrive. I always approve comments.
It is important that WordPress filters comments because the internet is literally flooded with website comments that insert bad code into a website and take down the whole site.
Thank you for your comment.
Ed
Dear Brendan…
Again a lot of allegations with little real meat…
As I already said, I have had a lot of direct discussions with the late Ernst Beck and therefore I am very reluctant to discuss his work, as he can’t defend his work anymore.
For a good idea how he worked: he did dig out lots of historical data, which was an enormous work and that really is where he should applauded for. The problem is his non-selection and use of all available data, the good, the bad and the ugly.
One can criticize the criteria that Calendar used to select or deselect the historical data for his compilation, but at least he had stringent criteria, including not using any data that were used for agricultural purposes.
That should have excluded the two main series (Giessen/Germany and Poona/India) which are at the base of his 1940-1942 “peak”, which doesn’t exist in any other measurement or proxy.
A peak of some 80 ppmv in only 5 years is only possible if you burn down a lot of forests and regrowth in 5 years simply is impossible.
That are the bad data. The ugly data: in Figure 1 of Yndestad (directly copied from Beck’s work) you see the “atmospheric” CO2 measurements. The northern Atlantic air was really measured and below the average of the ice cores. The mid- and south-Atlantic pCO2 was only measured on the seawater samples at different depths, including at the surface, noticed as 0 meter depth. According to Beck, that were atmospheric measurements, but… from the same samples the pH was measured… Nevertheless, he used these data in his latest work.
Then we have Figure 2 in Yndestad: the peak in temperature around 1940 may have caused the peak in CO2, but that implies a 120 ppmv peak for only 0.6°C change. Or 200 ppmv for only 1°C sea surface increase. Wow.
Moreover a similar increase and decrease after 1950 does not lead to any detectable increase of CO2. Very strange behavior of CO2: it stops its huge reaction on temperature at the exact moment that accurate direct measurements in the atmosphere start…
What makes all the historical measurements suspicious is that in about every year one can find any CO2 level one likes: from below the ice core measurements to 500-600 ppmv in the same year at the same place on earth or at different places.
There is a modern CO2 (and other gases) station at Linden/Giessen at a few km of the historical station that is the main source of the 1942 peak. Here a few days of measurements under inversion, compared to Barrow, Mauna Loa and the South Pole. All raw, uncorrected data:
https://www.ferdinand-engelbeen.be/klimaat/klim_img/giessen_background.png
The historical measurements were three times a day, two at the flanks of the peaks:
https://www.ferdinand-engelbeen.be/klimaat/klim_img/giessen_background.png
So that are the measurements that caused the “peak” around 1941…
About the calibration of the stomata data: these indeed are calibrated against ice core measurements over the period 1900-1990:
https://www.ferdinand-engelbeen.be/klimaat/klim_img/stomata.jpg
For the same stomata index (SI) of 7%, the CO2 level may vary between 315 and 365 ppmv. I think that the ice core values are somewhat better…
And even in the stomata data, there is no “peak” around 1940:
According to the ice cores, the CO2 level in 1940 was around 310 ppmv. If the “real” CO2 level was at 380 ppmv, according to Beck, then the stomata index would be at the bottom of the graph near 5%. Nothing special can be seen in the calibration around 1940…
See further my opinion of already from 2008 about Beck’s compilation:
https://www.ferdinand-engelbeen.be/klimaat/beck_data.html
Again, stomata data are calibrated against ice cores for local bias over land for the period 1900-1990. But what happened hundreds of years ago with the local bias? That may have changed due to land use changes in the main wind direction over the centuries or even the main wind direction may have changed as was probably the case between the warm MWP and the cold LIA in Europe. In that case, the stomata data need to be recalibrated to match the averages of both over the same period. Not the other way out…
And I have followed the video. What a bunch of nonsense is that. Good to fill a whole page in reaction. He uses the unreliable stomata proxy data to refute the ice core records (while that should be in reverse!) and he uses the remarks of the late Jaworowski, which were already refuted point by point in… 1996 by the work of Etheridge et al. on three ice cores at Law Dome.
See my comment on Jaworowski, again of 2008:
https://www.ferdinand-engelbeen.be/klimaat/jaworowski.html
And please let politics out of the debate: I am very interested in politics, but don’t mix a debate about data with a debate about who is politically biased in your own eyes…
The second reference for the modern CO2 measurements at Giessen (Germany) should be:
https://www.ferdinand-engelbeen.be/klimaat/klim_img/giessen_2005-07-14.png
The historical measurements were at 7 AM, 2 and 9 PM.
That already gives a bias of about +40 ppmv, compared to the ice cores.
Even the modern average at still rural Linden/Giessen is good for average +40 ppmv, together already +80 ppmv for the historical measurements.
Calendar was completely right to reject all historical measurements for “agricultural purposes”…
Dear All,
The essence of the arguments, for or against (H1), centers on what the correct equations are that describe the true physical processes governing mass transfer between the global reservoirs. Ed Berry uses Outflow = Level / Te and related equations which embody the first-order nature of Fickian diffusion. Ferdinand Engelbeen adheres to a Tau “model” which ascribes Outflow proportional to disturbance / Tau where disturbance equals the difference between the current atmosphere concentration of CO2 and some equilibrium level that would be restored on suspension of industrial emissions.
Mathematically, both models begin with the math balance equation (1):
(1) dC(t)/dt = Eh(t) + En(t) – Sn(t)
where C is the concentration of CO2, and E, S, h, and n represent emissions, sinks, human, and natural, respectively. Demetris Koutsoyiannis describes Tau model adherents as “lumping” emissions and sinks together by equating [Sn(t) – En(t) to net sinks, NS(t), defined as in (2):
(2) NS(t) = k* [ C(t) – C* ]
where C* represents a value of C(t) at some hypothetical equilibrium. The Te model also starts with equation (1), but expresses net sinks, SN, as in (3):
(3) SN(t) = ke [ S(t) ]
Which of (2) or (3) properly reflects the true physical processes at work in carbon cycling?
According to Koutsoyiannis, “The proponents of the above ‘sceptic’ [Tau] approach may have difficulties to accept this relationship, preferring [Equation (2)], but [Equation (2)] is for the net sink NS(t) = Sn(t) – En(t), while [Equation (3)] is for the natural sink Sn(t) without subtraction of the emission. It would be absurd to assume that Sn(t) would be related to a portion of the atmospheric storage, such as the surplus above the assumed equilibrium state.
The crucial difference between the two models, other than the question of which equations best describe the realistic physical principles at play, is the fact that the Tau model assumes the equilibrium value of S* has not changed since pre-industrial times. The Te model allows for the possible expansion of the biosphere and a potentially larger S*. This would have the effect of shortening Tau.
Unfortunately for the Tau model camp, this dilemma will never be resolved with simple math. We are going to have to rely on more rigorous analysis such as presented here by Dr. Ed or that of Demetris Koutsoyiannis. See Annex A, page 20, https://tinyurl.com/bdd4fhyb
Dear Jim,
I must make one correction to your review comment:
My equation (1) is not as you wrote it. My equation (1) is:
(1) dL/dt = inlfow – Outflow
This applies to any definable set of carbon atoms, including their total.
I apply it separately to natural 12C and to human-produced 12C. I could also apply (1) to the total of natural and human carbon but this has no advantage.
This (1) is the continuity equation designed to keep track of specific atoms (in our case). Your (1) destroys this necessary continuity.
I disagree with your (1) because it does not include -Sh(t), and therefore it assumes the sinks for human carbon outflow are the same as the sinks for natural carbon outflow.
This assumption destroys the intended continuity, messes up the carbon cycle calculations, and messes up the minds of those like Andrews who can’t keep track of what is in their carbon cycle calculations.
The proper physics way to formulate this problem is the way I suggest, e.g., to do the natural and human carbon cycles separately using my (1). We can add them up later, if we wish.
This may be the most important point of disagreement in these discussions.
Ed
Ed,
The mass-balance formula we have long discussed only makes sense when the natural absorption term includes aborption of ALL types of carbon. Jim discovered what you and I already knew and maybe even Brendan has figured out. You are motivated to confuse the issue because correct analysis proves that your separate anaylsis of industrial and natural carbon hid from you an important insight: natural processes are removing substantially more carbon from the atmosphere than they are adding. That makes it very tough for Jim to argue natural processes are a significant source of the rise, but he is trying. I do not expect him to be successful. You might want to look at graphs of human emissions and atmospheric accumulation in your own earlier papers, which you have omitted from the current one.
Your conclusion that industrial carbon levels in the present atmosphere are small is old news, was anticipated in the 1955 Seuss paper, and is not relevant to the question of why atmospheric carbon levels have been increasing.
Dear Dr. Ed,
With respect, I’m on your side. My equation one,
(JS1) dC(t)/dt = Eh(t) + En(t) – Sn(t)
is exactly your equation,
(EB1) dL/dt = Inflow – Outflow
with Inflow = Eh(t) + En(t) and Outflow = Sn(t) = SN(t) = [ Sh(t) + Sx(t) ] where Sx(t) equals that fraction of total carbon sinked that was not derived from human sources. I could have included that earlier, but there was no need to clutter up the math with variables that can’t be derived from simple math. In other words, we know Eh(t) and dL/dt from the available data, but calculation or estimation of the relative amounts of Sh(t) and Sx(t) are not possible without model approaches like yours. My primary interest is in resolving the question of which model most appropriately describes the physical processes involved. Although probably a fool’s errand, I would like to see everyone get on the same page here.
You wrote, “I disagree with your (JS1) because it does not include -Sh(t), and therefore it assumes the sinks for human carbon outflow are the same as the sinks for natural carbon outflow.”
Sink rates for human carbon outflow are the same as the sink rates for natural carbon outflow, because of the equivalence principle. I hope my explanation of Sn(t) = [ Sh(t) + Sx(t) ] clears that up.
Dear Jim,
I had only an older version of his RRR approach and couldn’t load your reference in Firefox. But now loaded in the MS browser…
Koutsoyiannis wrote:
“1. The notion of the equilibrium state is incompatible with the recent biosphere expansion, which was documented in the main part of this essay and elsewhere [1,9,25].”
The main effect of temperature on short term is on vegetation at about -5 ppmv/°C for seasonal changes and +3 to +4 ppmv/°C for year by year changes. Over periods longer than a decade the influence of expanding vegetation is near zero and the oceans take over as the main level of equilibrium. Visible as +8 ppmv/°C for Antarctic temperatures and 15-20 ppmv/°C for global temperatures over the past 800,000 years.
That the expansion of the biosphere plays little role can be seen as a very stable 13C/12C ratio of -6.5 +/- 0.4‰ δ13C, until humans start to emit FF. The level today is below -8‰, while vegetation is a net sink of CO2, preferable of 12CO2, leaving relative more 13CO2 behind, thus increasing the 13CO2 level in the atmosphere…
What Koutsoyiannis and many others forget is that a cycle doesn’t add or subtract anything from the atmosphere, only the difference between the ins and outs changes the level of CO2 in the atmosphere. Even if the natural cycle of vegetation doubles (as was at least during interglacial periods), that halves the residence time, but doesn’t change Tau with one second.
“2. The idea that human emissions are the only or the main agent of change is incompatible with the ever-changing Earth’s states, including the atmosphere and climate”
We never said or implied that. Over the past 800,000 years, the changes were huge, but all caused by huge changes in temperature over very long time periods. The warming from a glacial period to an interglacial needed 5,000 years for a change of some 100 ppmv CO2, or some 0.02 ppmv/year…
Even shorter periods like the MWP-LIA cooling don’t show more than 10-20 ppmv/°C.
The current change in the atmosphere is 2.5 ppmv/year, with 5 ppmv/year of FF emissions and suddenly over 100 ppmv//°C. Which violates Henry’s law (maybe +13 ppmv since the LIA…)
According to Koutsoyiannis the FF emissions are not the cause of the increase in the atmosphere…
“3. The importance given to human emissions is disproportional to its share in total (4%).”
Again the idea of the “classic” reactor with unidirectional flows through the container… Indeed, in that case, FF ratio’s in the container and output never can exceed the FF ratio in the input.
But the observed FF level in the atmosphere is already over 10% and in the ocean surface over 6%…
Koutsoyinannis “lake model” is herewith rejected.
Our model more resemples the “fountain model”, where a small input is the only cause of the level and overflow of the basin, no matter how much water flows over the fountain itself… The latter gives the short residence time of 4 years for CO2 in the atmosphere. The former the small net outflow rate of 50 years…
“4. While the proportionality relationship in Equation (A3) has an empirical basis (see below), it may be a result of the coincidence of increasing human and natural CO₂ emissions. The latter, caused by the biosphere expansion, are totally neglected in this relationship. ”
The human input increased a factor 5 between 1958 and today. The biosphere expanded some 20% over the same period. Quite a difference.
As said before: only if both expanded at the same rate, the natural fluxes might be the main cause of the increase.
So, the whole appendix A of Koutsoyiannis fails to reject our approach…
Ferdinand,
“Even if the natural cycle of vegetation doubles (as was at least during interglacial periods), that halves the residence time, but doesn’t change Tau with one second.”
The kinetics of mass transfer of molecules between two reservoirs towards their return to equilibrium (or relaxation) after a sudden modification of the conditions, such as a jump of temperature or of pressure is analogous to how Tau and Te are related by 1/Tau = (K+ + K-) where K+ and K- are the individual rate constants for the forward and reverse directions of flow. A change in either individual rate constants will affect Tau. Making Tau independent of Te is a function of your incorrect model.
“Which violates Henry’s law (maybe +13 ppmv since the LIA…”
Henry’s Law expresses an equilibrium condition where the concentration of gas dissolved in a liquid is directly proportional to its partial pressure. It says nothing about the time to come to equilibrium after an imbalance.
“But the observed FF level in the atmosphere is already over 10% and in the ocean surface over 6%…”
Yes, and therefore “classic reactor” and “lake” simple math models can be rejected.
“The human input increased a factor 5 between 1958 and today. The biosphere expanded some 20% over the same period. Quite a difference.”
The simple math difference between 20% of 100 ppm of natural emissions is 5 times larger than the 4 ppm increase in industrial emissions. Even simple math shouldn’t require any correlation between the two fluxes. Koutsoyiannis hasn’t failed to reject your approach. He led you to water, but he just couldn’t make you drink.
Jim, about the formula’s:
Koutsoyinannis says:
“It would be absurd to assume that Sn(t) would be related to a portion of the atmospheric storage, such as the surplus above the assumed equilibrium state.”
Well, I suppose that Koutsoyiannis never has heard of the Le Chatelier’s principle?
That shows that Sn(t) – En(t) changes from zero to some value that tries to counter the “disturbance”, that is the change in one of the components of a dynamic equilibrium…
That is exactly what Tau does: with some extra CO2 in the atmosphere, Sn(t) will increase in ratio to the extra CO2 pressure and En(t) may be reduced (in the case of the oceans) or not (or even slightly increase, in the case of vegetation). Thus Sn(t) and possibly En(t) of course change with the extra CO2 in the atmosphere.
95% and more of Sn and En are completely independent of the CO2 level in the atmosphere. The 5% depends of the pCO2 difference between atmosphere and ocean surface. That will go to zero if there were no human emissions or stop increasing if we would halve our emissions, but there is no reason to do that at all…
The math still remains very simple: human emissions are straightforward into the atmosphere, for 100%.
The removal of the extra mass (no matter the original FF molecules) only depends of the total extra CO2 in the atmosphere (not that from one year human emissions) above the long standing dynamic equilibrium with the ocean surface, only with a small change in equilibrium over time caused by SST changes. The observed Tau is around 50 years and has nothing in common with the residence time… Even if all vegetation on earth doubled over time, that does about double S(t) and E(t) and thus halves Te, but doesn’t change S(t) – E(t), thus doesn’t change Tau…
Dr Ed
Thank you.
Brendan
Jim,
In an earlier note to Ferdinand you said “I’m working on a way to demonstrate how the simple math you and David Andrews rely on can give ambiguous results based on somewhat arbitrary choices of variables.” You seem to have been distracted from that goal or maybe have given up. My goal here is to keep you focused on it.
I think we agree on all of the following data-driven conclusions:
• The present atmosphere contains little “industrial carbon”, carbon that once resided in a fossil fuel. (That is Ed’s key result, but it is old news and unimportant.)
• The (fast cycle) carbon content of the atmosphere, oceans, and biomass have all increased since 1950.
• Natural emissions of carbon into the atmosphere from processes such as ocean outgassing and vegetation decay exceed emissions from fossil fuel burning by an order of magnitude.
• Data and “simple math” allow the further conclusion that natural transfers from the atmosphere to land and sea reservoirs (of ALL carbon types of course) exceed natural emissions. This is equivalent to the statement that “net global uptake” is positive. Repeating relevant data from Ballantyne: between 1950 and 2010, integrated human emissions were 350 +_29 PgC, atmospheric accumulation was 158 +-2PgC, making net global uptake 192 +- 29 PgC.
I know you are struggling to accept the consequences of the final bullet point.
You have argued that the larger natural emissions from decaying vegetation in 2025 compared to 1950 (because there is more vegetation to decay) means they are a cause of the atmospheric rise. This is what Koutsoyiannis has also argued, which is why I put you on to him. Several months ago I told Demetris I would nominate him for the Nobel Prize in Alchemy, if he could demonstrate in a laboratory setting how decaying vegetation managed to emit more carbon than it had taken in from the atmosphere while it was growing. He has not responded to me.
I don’t know how your spreadsheets are structured, but as the biomass example illustrates, it DOES make sense to link various emission and absorption processes and focus on net changes in individual caches of carbon, no matter what Demetris says. Stock changes over a defined period are presumably better known than emission and absorption rates. A larger biomass in 2025 compared to 1950, combined with carbon conservation, precludes biomass growth as a source of atmospheric carbon rise. Simple math is not wrong just because it is simple.
So once again I am puzzled how you can look at the 350 PgC hole in fossil fuel reserves made between 1950 and 2010 and have any doubt whatsoever where all the carbon is coming from. But if you have a coherent rebuttal, by all means bring it. Ed has none. Demetris has none.
David,
Thinking only of net sinks obscures the possible increase in atmospheric carbon due to increasing natural sources. Keep in mind that yearly emissions from natural sources are twenty times more than industrial emissions. Your simple math will never distinguish the sign of the difference between annual natural sources and sinks. That’s why I’m working on a method of determining it. The main thing I know is Mauna Loa data cannot be fitted by my model without allowing for an increase in emissions. That is why I agree with Dr Ed’s rejection of H1.
If decaying vegetation wasn’t at least as much as previous amounts absorbed, there would begin to be a deficit.
You miss the point by focusing on where the carbon is coming from, or at least by assuming it’s all from fossil fuel. The problem is determining how it’s being distributed and to what degree fossil fuels have contributed to the rise in CO2 in the atmosphere.
Jim,
You write “If [carbon from] decaying vegetation wasn’t at least as much as previous amounts [of carbon] absorbed…” You seem to be implying it could be more! Are you vying with Demetris for the Nobel Prize in Alchemy?
It could be more. If there was an equilibrium before the world population grew from negligible to 9 billion people, a lot of old growth forest has been cut down since.
Jim,
It was probably more source than sink until about 1980, due to expanding population and following land use changes. Since at least 1990, the biosphere is a net sink, as can be deduced from the oxygen balance: If there is a net CO2 uptake, then extra O2 is produced or reverse. By measuring the O2 balance, one can calculate the net uptake or release of CO2 by the global biosphere.
Only since about 1990, we have O2 measurements that are accurate enough (less than one ppmv in 21,000 ppmv…) to calculate the net uptake or release of CO2 by the global biosphere. Here reflected in the work of Bender et al.:
https://tildesites.bowdoin.edu/~mbattle/papers_posters_and_talks/BenderGBC2005.pdf
The partition of the net CO2 sinks between oceans and vegetation can be seen in Figure 7 at the last page.
From 1994 to 2002 the net uptake by the biosphere was 1.0 +/- 0.6 PgC/year. With the exception of the 1998 El Niño, the biosphere was always a net sink for CO2…
It really is that simple: human emissions are directly, for 100% in the atmosphere. They increase the CO2 level with the full emissions and decrease the δ13C and Δ14C levels for all what they supply.
All what nature does is removing about half what humans added as mass and replace 2/3 of all original FF molecules with CO2 molecules from other reservoirs…
Dear Uncle Bert,
More specious waffle. You are obviously running scared from the 1812 to 1961 instrumental record because it thwarts your political narrative. All you have to offer on this occasion is a list of excuses. You can’t falsify anything with excuses and you can’t falsify measurements. They are what they are.
You said:
“That should have excluded the two main series (Giessen/Germany and Poona/India) which are at the base of his 1940-1942 “peak”, which doesn’t exist in any other measurement or proxy.”
I have already falsified this in my previous comment.
Additionally your list of excuses are confusing. You refer to a figure and then talk about something else.
You said:
“A peak of some 80 ppmv in only 5 years is only possible if you burn down a lot of forests and regrowth in 5 years simply is impossible.”
You’re making the same stupid mistake as Ralph Keeling. You are ignoring the oceans. All your excuses are falsified by Bromley & Tamarkin 2022.
Bromley & Tamarkin 2022; Correcting Misinformation on Atmospheric Carbon Dioxide; https://budbromley.blog/2022/05/20/correcting-misinformation-on-atmospheric-carbon-dioxide/ Accessed 28-8-2023
They examined data following the explosive volcanic eruption of Pinatubo on the island of Luzon in the Philippines in June 1991. This eruption emitted large amounts of aerosols into the atmosphere blocking sunlight and reducing SSTs and surface temperatures. This altered the Henry’s Law ratio causing a reduction in oceanic emissions lowering the atmospheric concentrations. There was a large natural movement down in atmospheric concentrations of CO2 post the eruption, followed after that by an even larger natural movement back up.
The large movement down in CO2 concentrations post the eruption occurred despite the fact that during this same period, human emissions of CO2 continued unabated. Natural emissions also continued from, e.g. biosphere decay & ocean emissions. During 1991-1992 there was an El Nino event which caused increased emissions from a warmer Pacific Ocean. On top of that, the volcano itself added large amounts of CO2 gas to the atmosphere. In spite of all these emissions, overall SSTs dropped post the eruption causing a large drop in atmospheric CO2 concentrations.
“According to the results of this study, the second derivative (i.e., the acceleration) of CO2 concentration dropped precipitously in the 2 years following Pinatubo to its lowest point in the pre-Pinatubo Mauna Loa record, despite the CO2 additions by humans, natural sources, a volcano and an El Nino. Nature rapidly absorbed the added CO2 and then more rapidly accelerated again to reset its CO2 concentration to trend.
there is no other known, logical or physically possible sink for such a large amount of CO2 to be absorbed so rapidly other than ocean surface.
The environment, mostly ocean surface (since ocean about 71% of Earth’s surface,) demonstrated rapid CO2 absorbance capacity which is 239 times larger than maximum possible net human emissions. We conclude that net human emissions are trivially minor, negligible, and absorbed and re-emitted along with the 239 times larger change in natural CO2.
In the 2 years following the June 15, 1991 eruption of the Pinatubo volcano, the natural environment removed more CO2 than the entire increase in CO2 concentration due to all sources, human and natural, during the entire measured daily record of the Global Monitoring Laboratory of NOAA/Scripps Oceanographic Institute (MLO) May 17, 1974 to June 15, 1991. Then, in the 2 years after that, that CO2 was replaced plus an additional increment of CO2.”
You said that Beck copied good and bad data. What you meant is that Beck should have cherry picked his data to make it look like your ice core record.
Then you follow Keeling and blame an inversion. Like an inversion occurred at all 901 locations at the precise time they were all taking sample measurements. Even a grade 5 child can see through this.
Then you doubled down on calibrating stomata against ice core proxies. Only you do that. I have a chart that I can’t show you as I have no web link to the chart. You can find it. It is Figure 7-13 in the book Climate Truths. You’ll have to buy the book. http://www.climate-truths.com. We have charted Stomatal birch CO₂ vs Antarctic ice core CO₂ after Steinthorsdottir, 2013. We did not calibrate CO2 to the ice core data but merely charted them together. It shows CO2 going up and down and the ice core flat lining it’s way through the middle like an average.
Then there’s the flimsy excuse that the instruments were too close to vegetation and the plants were expiring CO2. This conveniently ignores that fact that readings were taken during the day when the plants were taking in CO2 and not expiring.
Patrice Poyet points out.
Poyet, Patrice 2021 in ResearchGate Discussion.
Global Warming (Part 1): Causes and consequences of global warming, a natural phenomenon, a political issue, or a scientific debate?
https://www.researchgate.net/post/Global_Warming_Part_1_Causes_and_consequences_of_global_warming_a_natural_phenomenon_a_political_issue_or_a_scientific_debate#view=5ce771de3d48b7330442d974
“A typical example where one confuses measurements (IR spectroscopy since 1959, or chemical since 1812 the accuracy of which we discussed before) with proxies delivering reconstructed values that are the result of a model applied on data coming from a low pass filter (firnification=convolution) that changes both the resolution and the dynamic of the records.
You can only compare ice-records with ice-records.
“Ice cores furthermore are low-pass filters on the temperatures themselves because of the “firnification” process.” [Poyet, P., 2021. The Rational Climate e-Book: Cooler is Riskier. The Sorry State of Climate Science and Policies. Final First Edition, April 19th, 125 Figures, 185 Equations, 473 pp., e-ISBN 978-99957-1-929-6, DOI: 10.13140/RG.2.2.28648.80640
(Ch. 5 Glaciers, Ice-Cores, Arctic and Antarctic, Page 182 on Page 189; Also page 110.)] “It takes decades, sometimes centuries before the air is completely trapped in the ice (before that, slowly decreasing exchanges remain with the atmosphere) and the composition of it is a complex sort of “mixed average” over the time during which the firnification process operates. In fact, ice core data, though providing some information, are not accurate proxies of the atmospheric composition (they depress, for various reasons, CO2 content that leaks when there is drainage during the firnification – and there is – as this gas is very soluble) nor of the temperature. They are just a better than nothing proxy. You can compare them between each others (e.g. Arctic versus Antarctic searching for the location of a volcanic eruption), but mixing apple, oranges and cabbages does not deliver any scientific result.””
Even your precious ice core record is fake. Ice core records have regularly gone over 300 ppm and as high as 500 ppm 3,000 years ago. The Byrd Core, e.g., has undergone intense attacks that really don’t stand up to any scientific scrutiny. Referring to the chart from Poyet 2021 of proxy measurements shows Camp Century Core in Greenland and the Byrd Core in the Antarctic going above 400 ppm.
This is Figure 15 from:
Mixing Proxy and Measured Data
DOI: 10.13140/RG.2.2.19788.95360/1
https://www.researchgate.net/publication/354144035_Mixing_Proxy_and_Measured_Data
which is taken from Figure 75 in Poyet 2021. The Rational Climate e-Book: Cooler is Riskier. The Sorry State of Climate Science and Policies. Final First Edition, April 19th, 125 Figures, 185 Equations, 473 pp., e-ISBN 978-99957-1-929-6, DOI: 10.13140/RG.2.2.28648.80640
Pre-Industrial CO2 concentrations from Antarctica and Greenland ice cores of up to 500ppm that were rejected by authors of various papers because they did not fit with the “man-made climate warming” theory. Poyet 2021.
Byrd Core has come under general attack, including from you above, by stating that the core samples were contaminated with drilling fluid. It has been said that everything Jaworowski said regarding the Byrd Core was refuted by Etheridge et al 1996 by the three ice cores drilled by Etheridge et al in 1996. Yet Etheridge never mentioned Jaworowski or the Byrd Core or drilling fluid in his paper. Etheridge did not refute anything.
Etheridge et al 1996 ice cores were for the last 1000 years and did not cover the 500 ppm period from Neftel et al 1982 which was 3,000 YBP. He was specifically looking at the last 200 years when CO2 increased. His CO2 measurements from his ice cores were based on assumptions and models. His CO2 growth was attributed to humans burning fossil fuels by way of assumption, not measurements.
Jaworowski points out that this criticism of contaminated core samples is valid for all other ice cores from the Antarctic since 1985.
There is no valid criticism of Neftel et al 1982 or Jaworowski 1992a. Both the Camp Century Core and the Byrd Core are valid CO2 proxy measurements.
As pointed out by Poyet, Callendar cherry picked the so called “Gold Standard” Ice Core Record leaving out all data showing CO2 proxy measurements above 300 ppm. Every time data is presented that shows CO2 above 300 ppm before 1750 it gets attacked by those supporting the IPCC’s narrative. These attacks don’t stand up to scrutiny.
And as for politics. The strategy employed by the socialists is infiltration and subversion. Subversion is where they say they are not who they actually are and are not doing what they are doing. Actions speak loader than words. You are actively pushing the global socialist agenda. You have infiltrated the CO2 Coalition.
Brendan,
I agree that data from around the time of the Pinatubo eruption demonstrates that natural processes can affect atmopheric carbon levels. Note that in this case, net global uptake INCREASED because of the cooler weather. That is, atmospheric carbon levels were LOWERED (did not rise as fast) because of the event. This is hardly a convincing demonstration that natural processes are raising atmospheric carbon levels as they remove carbon from the atmosphere.
ADMIN NOTICE:
I don’t know if you have the same difficulty as I do, trying to find previous comments that I wish to reply to, and trying to find if there is a new comment that is a reply to a comment days ago.
Because of the large number of comments on this post, I find it difficult to reply to comments that are embedded in comments way above the new comments at the bottom of this list.
So, I am going to try an experiment that is reversible:
WordPress allows me to set the number of sub-comments. it is presently set at the default of 4.
As a test, I am going to reset this to 0.
After this reset, all comments will be reorganized into cronological order rather than in reply order.
This will force us to state the author, date, and time of the comment we are replying to.
But I think it will help us to find the comments we wish to reply to, and help us review all NEW comments since we last looked at this page because they will all be at the bottom of the comment list.
So, if you don’t like this chronological order setup, tell me. It is easy for me to reset the WordPress replies back to 4.
We lose nothing by trying this experiment.
Here we go. Refresh your browser to see the comments in chronological order.
Dr. Ed – July 9, 2025 at 9:52 am
Good idea, I probably missed several comments and reactions, due to the local replies…
Ferdinand Engelbeen July 9, 2025 at 9:33 am
Of course:
“Even if all vegetation on earth doubled over time, that does about double S(t) and E(t) and thus halves Te”
only is true for the biosphere part of the natural CO2 fluxes.
As that is about halve the total natural CO2 flux in and out, then Te is reduced by app. 25%…
Dr. Ed, July 8, 2025 at 9:45 pm
Dear Dr. Ed,
The main question remains:
Human emission are redistributed between atmosphere, biosphere, ocean surface and deep oceans.
The increase in the atmosphere is only a fraction of the observed increase.
What is then the source of the observed difference, as both the biosphere and the oceans increased in carbon content?
Ed wrote, “So, if you don’t like this chronological order setup, tell me. It is easy for me to reset the WordPress replies back to 4. We lose nothing by trying this experiment.”
One thing you’ve lost is the “reply” button.
IMO, 10 would be better than 4, which was better than zero.
However, it would be better yet if there were a user option to choose to view the comments either in “tree view” (with replies shown immediately following the comments to which they reply), or “chronological.” The default should always be “tree view,” but an option to switch to chronological, to find any new comments, would be helpful.
Ideally, each comment would also show a link to the comment to which it’s replying.
As long as we’re wishing for things, it would be nice if references to .jpg and .png images like this produced scaled, inline copies of the image:
https://sealevel.info/1612340_Honolulu_thru_2025-04_vs_CO2_annot1.png
An “edit” button would be nice, too.
Brendan Godwin July 8, 2025 at 8:32 pm
Brendan, I am pretty sure that you are against measuring temperature in the middle of towns, near airco outlets, asphalt parkways, on asphalted rooftops etc. for the global temperature record.
Then it wonders me why you insist to use CO2 data which are highly contaminated by local CO2 sources. As like the alarmists for bad temperature data, because you like the results?
I do contest both: contaminated data are bad data and should not be used for any record.
There is no need to use contaminated data like these of Giessen and Poona, as there is a quite reliable source of average data over the same periods: ice core CO2 levels, with only one drawback: its resolution, which depends of the local snow accumulation.
For 2 out of 3 ice cores at Law Dome, the resolution is less than a decade. with data over the past 150 years, thus including the 1940 “peak” in the contaminated CO2 measurements of Giessen and Poona. The same ice cores have a direct overlap 1958-1978 with the direct measurements at the South Pole:
https://www.ferdinand-engelbeen.be/klimaat/klim_img/law_dome_sp_co2.jpg
Equal within +/- 1.2 ppmv (1 sigma).
If they correctly reflect the atmospheric data over 20 years, I don’t see any reason that they will not correctly reflect the data of 20 years before 1958. That is for the period 1938-1958, thus including the non-existing peak in the global CO2 data.
And again: stomata data are local data over land. They have the advantage of reflecting local changes very rapidly. Local changes, not global changes.
The historical Giessen data were three times a day, of which one in the middle of the day and two at the much higher levels at the flanks of the nightly degassing. Bias of the measurements: +40 ppmv. Bias of the location (in modern measurements) +40 ppmv. Overall bias, compared to global levels: +80 ppmv. That is your 1940 “peak”…
Have further a read of our specialist in ice core and stomata data: Renee Hannon:
https://co2coalition.org/wp-content/uploads/2024/06/Measurement-of-CO2-Concentrations-Through-Time-2024-June.pdf
Bud Bromley has some strange ideas of what Henry’s law implies. The effect of SST on the CO2 pressure of the ocean surface (in equilibrium with the atmosphere) is only some 10-20 ppmv/°C.
Or for the Pinatubo, only a smaller increase in CO2 than before or after the Pinatubo.
A smaller increase, not a decrease!
In January, compared to the previous year January:
1991: 1.1 ppmv
1992: 1.4 ppmv
1993: 0.8 ppmv
1994: 0.9 ppmv
1995: 1.9 ppmv
Moreover, the reduction of the CO2 increase was mainly caused by increased vegetation growth, thanks to the scattered sunlight by the Pinatubo induced aerosols, giving more light to leaves, normally part of the day in the shadow of other leaves…
How do we know that? Because the 13C/12C ratio increased while the CO2 increase dropped. If the oceans were responsible, the CO2 changes and 13C/12C changes would parallel each other:
https://www.ferdinand-engelbeen.be/klimaat/klim_img/temp_dco2_d13C_mlo.jpg
And I have seen the Byrd contaminated data. Well they did show the whole range of data they have measured at the same depth. For uncontaminated data the spread is about 1.2 ppmv for modern drilling and extraction methods.
If you find drilling fluid, that gives an enormous range, which has nothing to do with the real CO2 data of that time. I should have rejected all these data, the authors only retained the lowest data, as these were probably the real background CO2 of that time. But Poyet (and you) like the high, contaminated data, so the rejection must be wrong…
Then the late Jaworowski.
Indeed Etehridge didn’t refute his objections by using his name, he refuted them point by point, whithout naming him. But everybody knew that Jaworowski’s objections were the target. Except Jaworowski himself, who repeated his objections years later…
Further I confronted him in a personal mail with the fact that he had looked at the wrong column in Neftel’s ice core record: the ice age data vs. the gas age data.
He replied that there was no difference, as there are frequent melt layers in the ice of Siple Dome. In reality Neftel encountered only one melt layer and adjusted the ice age – gas age difference accordingly.
And if you believe Jaworowski, how can one measure 200-300 ppmv in the ice cores when the outside CO2 is over 400 ppmv and in the labs where is measured probably a lot higher, if there is a lot of exchange through “cracks in the ice”?
Let the good old Dr. Jaworowski rest in peace, together with his wrong ideas of CO2 in ice cores…
And how much liquid water do you think remains between the ice crystals at -40°C at the inland cores like Vostok and Dome C?
Ferdinand
To Ferdinand Engelbeen, from July 9, 2025 at 9:33 am
“95% and more of Sn and En are completely independent of the CO2 level in the atmosphere.”
That is completely wrong and utterly opposed to the forces at work between transport across interfaces. Study the derivation of the kinetics of the reaction of A B, which is analogous to interfacial transport. http://brussels-scientific.com/?p=7724 . The transport rates are proportional to the concentration at all times even at equilibrium when the forward and reverse rates are equal. Until equilibrium, the concentrations are constantly changing. There is no static concentration to which the disturbance is heading, such as in the case of your Tau model where the rate is proportional to the current level minus the equilibrium level. That old equilibrium level may never be achieved because of the new equilibrium created by additional carbon added to the system.
Jim Siverly, July 9, 2025 at 11:43 am
Jim,
If I have understand it correctly, both Dr. Ed and I use bidirectional flows to calculate Te or Tau alike. No problem there, except that the time constants of Dr. Ed are based on the total outflows as if these were caused by the absolute CO2 level/pressure in the different containers, while 95% of all outflows (especially from atmosphere into vegetation and back) are completely independent of the CO2 level in the atmosphere. Which makes that his increase of total CO2 mass in the atmosphere is way lower than observed.
I am aware of the time constant for Tau, as that is an observed 50 years. Not 4 years, or there wouldn’t be such an increase in the atmosphere.
Your calculation of the 5 times higher increase of the vegetation inflow violates the equivalency principle for CO2: for nature to be the main cause of the CO2 increase in the atmosphere, it should have increased all in- and outflows a 5-fold between 1958 and today, not 20%…
Koutsoyiannis, Harde and many others use the one-way input – container/lake/bath tube – output model and are completely at odds with reality, thus their results make no sense at all.
Jim Siverly, July 9, 2025 at 1:05 pm
Jim,
“The transport rates are proportional to the concentration at all times”
Yes, for those processes that depend of the CO2 concentration. The calculated output based on the absolute CO2 pressure in the atmosphere is some 16 PgC/year in total into both oceans and vegetation together.
Take the output form the atmosphere into vegetation in spring/summer: 120 PgC absorbed by the biosphere with increasing temperature and sunlight, due to photosynthesis. Going from near zero to 100% in a few months time, near completely independent of the pCO2 in the atmosphere. Even reducing the pCO2 of the atmosphere with some 10 ppmv in the NH. If there was no emission of 60 PgC from the same biosphere at night and 50 PgC from the warming ocean surface, the drop would be 120 PgC or 60 ppmv…
Reverse, there may be some influence of the CO2 pressure in the water of the leaves that respire CO2 at night, but for all other releases by bacteria, molds, animals, including humans, there is zero influence of the pCO2 of the atmosphere in the quantity that is released from decaying organics…
From Ferdinand Engelbeen, July 9, 2025 at 1:21 pm
Ferdinand,
Again you repeat the assertion that “95% of all outflows (especially from atmosphere into vegetation and back) are completely independent of the CO2 level in the atmosphere.” This cannot be supported by experimental data. If so, please present it. Look at the anecdotal data from the CO2 coalition where they subjected trees to several levels of CO2 with arguably a proportional increase in growth rate. If the growth was independent of CO2 level, no significant growth would have been observed.
You completely misunderstand my comparison of your five-fold increase in human emissions and my 20% increase in natural emissions. There is no violation of equivalence principle which applies to first-order uptake. Human emissions are zero order. They don’t follow the rules that must be applied to first order natural emissions and uptake.
“Koutsoyiannis, Harde and many others use the one-way input – container/lake/bath tube – output model and are completely at odds with reality, thus their results make no sense at all.”
Dr. Ed is right. You do not understand his model and the others. You have yet to develop a rigorous model that refutes theirs. Their models are not at odds with reality as they all explain the data and use proper physical principles in doing so. It’s your devotion to a simple math coincidence model that prevents you from understanding their models.
GENERAL QUESTION TO THOSE COMMENTiNG ON PHYSICS:
How familiar are you with the following concepts:
Lagrangian, Hamiltonian, Principle of Least Action, entropy, equilibrium, systems formulation and mathematics, time-step numerical integration, Markov Chains, probability, the significance of stastistical non-correlation, scientific method, and the philosophy of science?
This is not a test and you don’t have to answer this question. But the reasoning you learn in these subjects does help people understand my simple deductive model that is entirely based on (1) continuity equation and (2) outflow proportional to level divided by an e-time.
To Ferdinand Engelbeen, from July 9, 2025 at 1:49 pm, and also from July 9, 2025 at 9:33 am
I may be incorrect in claiming all “transport rates are proportional to the concentration.” You gave examples such as releases by bacteria, molds, animals, including humans, etc. I will give some thought to what degree that would effect a Te model. But certainly, the ocean processes are first order in both directions.
From July 9, 9:33 am
“The math still remains very simple: human emissions are straightforward into the atmosphere, for 100%.”
You are likening human emissions to a “disturbance” and characterizing Tau as relaxation time. That is not an appropriate model in that continually accumulating human emissions, rather than a one-time “dose,” conflated with additional “excess” natural emissions give rise to your ambiguous Tau values. Your estimates of Tau are a consequence of using a flawed model.
“The removal of the extra mass (no matter the original FF molecules) only depends of the total extra CO2 in the atmosphere (not that from one year human emissions) above the long standing dynamic equilibrium with the ocean surface, only with a small change in equilibrium over time caused by SST changes.”
That is assertion based on what equation NS*(t) = K* [ S(t) – Se* ] predicts. Since there will never be cessation of burning fossil fuels in our lifetime, you won’t have any way to verify it.
“The observed Tau is around 50 years and has nothing in common with the residence time… Even if all vegetation on earth doubled over time, that does about double S(t) and E(t) and thus halves Te, but doesn’t change S(t) – E(t), thus doesn’t change Tau…”
Do you have any actual evidence of that?
Jim Siverly quoted Ferdinand saying, “The observed Tau is around 50 years and has nothing in common with the residence time…” and asked, “Do you have any actual evidence of that?”
The roughly 50 year “adjustment time” (a/k/a the 35 year effective first half-life) of CO2 added to the atmosphere is determined from measured data, as I discussed here (section 2):
Burton, D. A. (2024). “Comment on Stallinga, P. (2023), Residence Time vs. Adjustment Time of Carbon Dioxide in the Atmosphere.” OSF Preprints. https://doi.org/10.31219/osf.io/brdq9 (and there’s supplementary material here)
It also cites five other sources reporting approximately the same result: Spencer 2023, Engelbeen 2022, Dietze 2001, IPCC SAR WG1 TS B.1 p.16, Moore & Braswell 1994:
1. Spencer, R. W. (2023). ENSO Impact on the Declining CO2 Sink Rate. J Mari Scie Res Ocean, 6(4), 163-170. https://doi.org/10.33140/jmsro.06.04.03
2. Engelbeen, F (2022). The origin of the increase of CO2 in the atmosphere, http://www.ferdinand-engelbeen.be/klimaat/co2_origin.html (section 3)
3. Dr. Peter Dietze: http://www.john-daly.com/carbon.htm
4. The IPCC’s Second Assessment Report: WG I Technical Summary, section B.1, p.16:
https://archive.ipcc.ch/ipccreports/sar/wg_I/ipcc_sar_wg_I_full_report.pdf#page=29
https://sealevel.info/SAR_TS_p15_50yr_adjustment_time_highlighted.png
Excerpt:
“Within 30 years about 40-60% of the CO2 currently released to the atmosphere is removed.” That implies an adjustment time of 33-59 years, and a half-life of 23-41 years.
5. Moore, BIII, &Braswell, B.H. (1994). The lifetime of excess atmospheric carbon dioxide. Global Biogeochem. Cycles, 8(1), 23–38. https://doi.org/10.1029/93GB03392
Excerpt:
“The single half-life concept focuses upon the early decline of CO2 under a cutoff/decay scenario. If one assumes a terrestrial biosphere with a fertilization flux, then our best estimate is that the single half-life for excess CO2 lies within the range of 19 to 49 years, with a reasonable average being 31 years.”
Also, Prof. Richard Lindzen mentioned it during the Q&A (3rd video) of this excellent(!) lecture:
● Part 1: https://www.youtube.com/watch?v=hRAzbfqydoY
● Part 2: https://www.youtube.com/watch?v=V-vIhTNqKCw
● Part 3 (Q&A): https://www.youtube.com/watch?v=69kmPGDh1Gs (including discussion of CO2 adjustment time / effective atmospheric lifetime):
Dear Ferdin
I am responding to your “Fountain Model” that you described in response to my comment. Your Fountain Model is nothing that exists in nature. When water enters a fountain, it doesn’t cascade over a stagnant pool of water that is only released if a small valve opens from the bottom. The water mixes with all the water in the fountain, and the thoroughly mixed water cascades over the side. Nature doesn’t segregate CO2. Dr. Ed’s hypothesis is that outflow is proportional to level or concentration. This makes sense because as the concentration of CO2 increases in the atmosphere, according to the gas law, CO2 partial pressure increases, and the number of collisions with its surroundings increases. These surroundings include other gases, matter, etc. Some of these collisions are with sinks, thus increasing outflow. A hypothesis has to be derived from logic. Your hypothesis that there is some carbon cycle that exists in nature that is partitioned from the human carbon cycle violates the Equivalence Principle and all manner of logic and common sense that the scientific method derives from. Your notion that there are human sinks and natural sinks has no observable basis. You will need to explain in detail how nature does this.
Dear Uncle Bert,
Re: Your comment July 9, 2025 at 12:47 pm.
You’re looking at ice core data for the last 150 years. You can’t take ice core proxies until firnification is complete. That takes centuries. Take that same data that you’ve presented and conduct a proxy measurement in another 200 to 300 years and it will show the same flat line.
You said: “stomata data are local data over land . . . Local changes, not global changes”. You also say CO2 is a well mixed gas the same everywhere. You say it’s not well mixed if it is measured from stomata. Ice core data is local to the poles and is not global. You thinking is scrambled.
Your Giessen hysteria is based on nothing except your specious waffle, excuses and a wing and a prayer.
You said: “Bud Bromley has some strange ideas of what Henry’s law implies”. Bud Bromley is a world renown expert on Henry’s Law. He worked with Henry’s Law his entire working career. It is his profession. He knows a lot more than you do. You only think you know. You’re once again blaming everything on vegetation growth and ignoring the oceans. It can’t be the oceans no matter what and the only argument you have to back that up is yet more of your specious waffle.
And you’re doubling down on the Byrd ice core data being contaminated. The data was not contaminated. It was only contaminated in your confirmation biased mind. All other ice core data was contaminated.
More from [Poyet, P., 2021. The Rational Climate e-Book: Cooler is Riskier. The Sorry State of Climate Science and Policies. Final First Edition, April 19th, 125 Figures, 185 Equations, 473 pp., e-ISBN 978-99957-1-929-6, DOI: 10.13140/RG.2.2.28648.80640, (Ch. 5 Glaciers, Ice-Cores, Arctic and Antarctic, Page 182 on Page 189; Also page 110.)]
“If I understand well: Oeschger has been unable to answer one single question asked by Jaworowski, but he states that he cannot be wrong because he’s been involved for so long that he cannot be mistaken, and finally the cherry on the cake, the argument of morality, Jaworowski is irresponsible because he dares ask questions. [Page 247]
3. Now, third stage, while drilling and extracting the core, when lifting up the column will let the gas reform from the clathrate and escape the sample throughout the cracks (this is somewhat following similar hysical processes to what happens when oil and gas are extracted by fracking). Furthermore various pollutions, contamination and corruption of the T preservation are unavoidable during the drilling, conditioning and transportation processes. While lifting up the ice core the same mechanisms that led to fractionation when the ice accumulated over time are also at play but in a reverse manner as the gases will transit from their hydrate form to gas again at different P/T (according to the phase diagram) and therefore at different moment and depths thwarting the records in the bubbles. Drilling decompresses cores excavated from deep ice, and contaminates them with the drilling fluid filling the bore-hole. Decompression leads to dense horizontal cracking of cores, by a well known sheeting process. After decompression of the ice cores, the solid clathrates decompose into a gas form, exploding in the process as if they were microscopic grenades. In the bubble-free ice the explosions form a new gas cavities and new cracks as reported by Shoji and Langway (1983) for a 2,037m long ice-core “Deep-ice cores drilled from the Greenland and Antarctic ice sheets undergo volume relaxation due to the expansion of air bubbles with time after core recovery”. These authors also report, and it gives an idea of the stress of the recovered sample, “decreasing rate of hydrostatic pressure of about 5.4bar.min-1 for each core length recovered of approx 1.9m”. Through these cracks, and cracks formed by sheeting, a part of gas escapes first into the drilling liquid which fills the bore-hole, and then at the surface to the atmospheric air. Particular gases, CO2, O2 and N2 trapped in the deep cold ice start to form clathrates, and leave the air bubbles, at different pressures and depth. [Page 249]
As a summary, all these problems arise simply because the ice cores do not fulfill the essential closed system criteria.” [Page 250]
Poyet states on page 251:
“On the other hand, the ice core data from the Taylor Dome, Antarctica, which are used to reconstruct the IPCC’s official historical record, feature a much more flattish time trend and range, i.e. 285 to 245 ppmv (Indermühle, et al. 1999). This difference strongly imply that ice cores are not a proper matrix for reconstruction of the chemical composition of the ancient atmosphere. Furthermore, Jaworowski (1997) claims that many discrepancies affect the ice cores and that (Oeschger et al., 1985) made an ad hoc attempt to explain some of these anomalies without success and further adds a very specific claim “In about ~6,000-year-old ice from Camp Century, Greenland, the CO2 concentration in air bubbles was 420 ppmv, but it was 270 ppmv in similarly old ice from Byrd, Antarctica”. Though, he does not provide the source of this, it is not difficult to find Fig.1 in (Neftel, 1982) to display exactly that sort of anomaly, though the age is more ~7,000-year-old corresponding to 1010 meters at Camp Century, Greenland and 900 meters at Byrd, Antarctica, see for yourself next Figure 108. [Page 252]
So we are left with inaccurate and dubious ice core results as the three fundamental premises are violated because the closed system criteria cannot be met, and which lead the entire CAGW edifice to crumble. Pre-industrial CO2 air concentration of at least 335 ppmv (Slocum, 1955) and pre-Boreal Holocene concentrations of up to 348 ppmv totally invalidate the low and arbitrary cherry picking of Callendar (1938) of 292 ppmv319 which appears more as pathological science (Langmuir, 1989) than anything else. “Callendar was prejudice in selecting from all his data roughly 30%, which showed concentration around 290 ppm, leaving the remaining 70% which showed concentrations over 300 ppm” (Foscolos, 2010) and he made a disservice to science. This practice of arbitrary selection of data sets matching prerequisites is also prejudicial to science and denounced by Jaworowski (1997) for Neftel at al.; Pearman et al.; Leuenberger and Siegenthaler; Etheridge et al.; Zardini et al.; among others.”
From his 2004 paper, Jaworowski, at page 252 in Poyet 2022, states that the IPCC concluded that all CO2 emissions post the industrial revolution were caused by humans burning fossil fuels and that this is based solely on the assumption that CO2 did not rise above 300ppm until after the industrial revolution. Jaworowski says that this assumption, which is based on ice core studies, is false and that IPCC projections should not be used for national and global economic planning.
Additionally Jaworowski says: “. . . they did not measure CO2 in the air bubbles and secondary gas cavities from such larger samples, but only from 1g samples.. . small [sample] size meant that [they were] probably uncontaminated.
Jaworowski (1992a)” Pages 242-243.
You ignore all inconvenient truths and facts. You’ve totally ignored the fact that Etheridge was comparing ice core samples from 2,000 years apart. The 3,000 YBP samples were wrong because they weren’t the same as his 1,000 YBP samples. Biased pseudoscience.
You have a confirmation bias and all arguments must be equal to your confirmation bias. You construct specious waffle arguments to try and make everything equal to your confirmation bias. Your comment on July 9, 2025 at 12:47 pm was nothing more then another bunch of excuses. You’ve said nothing that negates anything that I have said.
Jim Siverly on July 9, 2025 at 3:33 pm and July 9, 2025 at 4:02 pm
Part 1.
Dear Jim,
I will try to show where it goes wrong with the use of Te, compared to Tau, specifically for the biosphere, as the problems are very clear for that part…
To start with: Te and Tau are different things, but may be the same in specific circumstances.
The formula for Te is:
Te = mass / output
The formula for Tau is:
Tau = disturbance / effect
The first is about how long a molecule CO2 resides in the atmosphere, that is the residence time or turnover time.
The second is how long it takes to remove an extra injection of CO2 mass in the atmosphere back to 1/e (~37%) of the original injection. In the case of a linear ratio between disturbance and effect, the time period makes no difference for Tau.
The first is about molecular transfer, the second is about mass transfer. Both for natural and FF CO2 alike.
In the case of a one-way world (container/lake/bath tube model), Tau is always <= Te.
In the case of a bidirectional world (fountain model), Tau is completely independent of Te.
Then the "model":
We can separate the in/outflows in two main parts: atmosphere – biosphere and atmosphere – oceans.
Both show large bidirectional (mainly seasonal) flows.
1. The atmosphere – biosphere flows.
In 1750, according to the IPCC, there was a more or less stable dynamic equilibrium between the atmosphere and the biosphere, with an alternating bidirectional flow of 108 PgC/half year.
That gives for Te:
Te(a-g): 628 / 108 = 5.8 years
Te(g-a): 2500 / 108 = 23.1 years
For Tau:
As there is no disturbance, the effect is zero and Tau can't be calculated.
Remark: Te(g-a) is in fact mostly the effect of the much smaller reservoir of about 550 PgC in living vegetation. That gives a much faster Te(g-a) of 550 / 108 = 5.1 years. For our model, that plays no role at all.
Then we suddenly add 50% extra CO2 in the atmosphere, about the current increase, so that we can compare the results.
The observed increases in fluxes and decrease in the vegetation reservoir (according to the IPCC) gives:
Te(a-g) = 883 / 123 = 7.4 years
Te(g-a) = 2470 / 118.7 = 20.1 years.
Tau = (883 – 589) / (123 – 118.7) = 68.4 years
Remarks:
The increase of CO2 in the atmosphere is far more rapid than the increase in outflow into vegetation, because the biological growth of vegetation needs far more time to follow the extra pCO2 pressure. Even in ideal circumstances, the ultimate growth rate is about 50% of the extra CO2 level. Not 100%.
The back flow of CO2 from vegetation into the atmosphere follows the inflow in vegetation, mostly within the same year in other seasons, minus what is added to more permanent vegetation and soils. As the total level in vegetation + soils hardly changes, Te(g-a) decreases.
That also means that Te is not constant and the reverse formula (2): Outflow = L /Te is not applicable.
That all demonstrates that Tau and Te have very little in common and the results not only differ an order of magnitude, but also are nearly independent of each other. Add to that the Tau for the oceans of a similar order (and more accurate calculations) and then you will find the ~50 years real, observed, adjustment time…
About understanding the different models, please look at my presentation for the Clintel wrokshop in Athens, last September, with a direct confrontation with Harde, Koutsoyiannis, Stallinga and others. If that is not sufficient, we can discuss that here in detail.
https://www.ferdinand-engelbeen.be/klimaat/klim_img/on_the_co2_residence_time.ppsx
And, while Berry started with the same one-way "container/lake" model with only one Te out, he evolved to a two-way model in recent years, which is already more like what happens in the real world. Be it with the decay rates which are not relevant at all. Koutsoyiannis, Harde, Stallinga and others still stick to their one-way models.
"That is not an appropriate model in that continually accumulating human emissions, rather than a one-time 'dose,'"
Sorry, but for any process in dynamic equilibrium, only the distance between the "disturbed" pCO2 and the equilibrium pCO2 counts, no matter if that is a one-time injection or a continuous (increasing) supply. That can be seen in the quite constant Tau, while yearly human emissions increased a five fold 1960-2020 and CO2 in the atmosphere increased with some 30% over the same time period:
https://www.ferdinand-engelbeen.be/klimaat/klim_img/acc_decay.png
Where A shows the sum of all human emissions since 1750, the observed increase in the atmosphere, the influence of the SST increase since 1850, calculated with the formula of Takahashi and the resulting ΔpCO2 between atmosphere and ocean surface.
B shows the observed net sink rate with a polynomial through the data.
C shows the calculated Tau.
That Tau is observed and not even based on a model is clearly demonstrated by David Burton…
Stephen P Anderson, July 9, 2025 at 5:25 pm
Stephen,
We didn’t separate human and natural CO2 at all in all our works. That is what Dr. Ed did.
In all our calculations, the human input is only handled as a separate, one-way supply into the atmosphere. That is all. In the atmosphere, it is mixed with all what is already there plus what is added by the natural cycles. In all following reactions it is handled as part of the mass changes, not separated at all.
The outputs are directly proportional to the partial CO2 pressure (pCO2) difference (not the absolute CO2 pressure!) with the ocean pCO2 and similar for water in plant leaves. For plants, the bulk of the CO2 uptake is completely independent from the pCO2 in the atmosphere and only depends of temperature and sunlight. Only a small percentage per year is directly proportional to the extra CO2 in the atmosphere. The same for the ocean surface temperatures over the seasons and the resulting in- and outflows.
That are the main differences in “model” that Dr. Ed and we have.
More to see in the sheets that I have made for a workshop in Athens:
https://www.ferdinand-engelbeen.be/klimaat/klim_img/on_the_co2_residence_time.ppsx
Dave Burton, from JULY 9, 4:35 PM
Artifact: Something observed in a scientific investigation or experiment that is not naturally present but occurs as a result of the preparative or investigative procedure.
Your Tau model is an artifact of a self-fulfilling prophecy. The plot you made in your comment on Stallinga, P. (2023), “net natural CO2 removal rate vs. Mauna Loa CO2 level,” follows from Koutsoyiannis’ equation (A3), which is NS*(t) = K* [ S(t) – Se* ] or my equation (2) from July 8, 2025 at 12:32 pm. Your data fits the model, but unfortunately correlation does not equal causation. You even label the graph “fossil only” seemingly unaware of the fact that it violates the equivalence principle.
In short, your logic is flawed. You assume no annual increases in natural emissions and no change in equilibrium conditions. Then you apply an equation that assumes the sink rate is proportional to the disturbance and claim the calculated result is a “measured” adjustment time. That fails the smell test.
Thanks for the reference to the Moore and Braswell reference introducing me to some unfamiliar terms, donor-dependent flux and unit pulse (Dirac Delta) functions. I will investigate them for potential application to this discussion.
Brendan Godwin, July 9, 2025 at 7:38 pm
Brendan,
You have no idea of the differences between ice cores.
Two of the Law Dome ice cores have an enormous snow precipitation per year: 1.2 meter per year ice equivalent.
That makes that at 72 meters depth or ~40 years of snow/ice layers, the gas bubbles are already fully closed in the ice. Until that depth, there is 40 years of gas exchange with the atmosphere, which makes that the average age of the air, at the depth where the gas bubbles fully close, is only 10 years older than in the atmosphere:
https://www.ferdinand-engelbeen.be/klimaat/klim_img/law_dome_firn.jpg
That means that the difference between the age of the ice and the enclosed gas is about 30 years. That is all.
There are differences between the closure time for different bubbles, which makes that the gas content of all bubbles at the same depth has a spread of about 8 years.
As there is a steady increase in CO2 over the past 100 years, the changes in CO2 level is easy to follow and also shows that there is no “leaking” of CO2 or diffusion within the ice core, surely not over such a short period.
That also shows that the compilation of the late Ernst Beck makes no sense: there was no “peak” of 80 ppmv around 1940, or that would have been measured in the Law Dome ice cores as a near equal peak, but with shorter duration.
I never said that CO2 is well mixed everywhere. It is well mixed in 95% of the atmosphere. It is not well mixed in the first few hundred meters over land, where huge CO2 sources and sinks are at work. Thus all CO2 measurements there, historical or not, don’t give you any clue of the real “background” CO2 level.
And Giessen hysteria? It looks more that you are getting hysteric if one shows you that the historical data were not so reliable. Have a look at the monthly averages for the modern station at Linden/Giessen:
https://www.ferdinand-engelbeen.be/klimaat/klim_img/giessen_mlo_monthly.jpg
Compared that to what is measured on the top of a volcano…
The standard deviation for the historical CO2 data was 68 ppmv (1 sigma, not a sign of reliability!), of the modern station about half of it and at Mauna Loa a few ppmv (seasonal changes excluded) and at the South Pole less than 1 ppmv…
“Bud Bromley is a world renown expert on Henry’s Law. He worked with Henry’s Law his entire working career. It is his profession.”
Maybe he is, and I am not an “expert” in these matters, but I look at the evidence of what many “experts” tell me and accept their expertise, if what they say is reasonable.
So, what says Bud Bromley: that the recent CO2 increase is caused by Henry’s law because of the warming oceans. In the past 800,000 years, the CO2/T ratio never was above 20 ppmv/°C. Currently not more than 3-4 ppmv/°C for short term temperature changes (Pinatubo, El Niño) and -5 ppmv/°C for seasonal changes.
The change over the past 175 years the increase of CO2 in the atmosphere is over 100 ppmv/°C. That rings some alarm bells: impossible that Henry’s law got berserk.
Thus looking at what other “experts” say, I did see the work of Takahashi on near one million seawater samples and he concluded that the increase in pCO2 (the CO2 level in equilibrium with the atmosphere) with temperature is a simple formula, independent of the start conditions or composition of the seawater:
(pCO2)seawater @ Tnew = (pCO2)seawater @ Told x EXP[0.0423 x (Tnew – Told)]
Or calculated for the SST increase since the LIA (worst case): some 13 ppmv extra.
Since 1850: less than 10 ppmv extra.
Bud Bromley’s expertise indeed is quite strange…
And the ice core from the Siple core (not the Byrd core) indeed was contaminated with drilling fluid:
https://www.ferdinand-engelbeen.be/klimaat/klim_img/siple_01.jpg
“Additionally Jaworowski says: “. . . they did not measure CO2 in the air bubbles and secondary gas cavities from such larger samples, but only from 1g samples.. . small [sample] size meant that [they were] probably uncontaminated. Jaworowski (1992a)” Pages 242-243.”
Which thus is clear nonsense: there is a huge range of 280-500 ppmv at the same depth from multiple samples where drilling fluid was found.
And then the following:
“Particular gases, CO2, O2 and N2 trapped in the deep cold ice start to form clathrates, and leave the air bubbles, at different pressures and depth.”
That indeed is true. But the reverse, does not lead to problems, as ice cores are at least stored for over a year at -20°C to expand. Then most clathrates decompose, as “grenades” that explode, causing cracks in the ice.
As N2 and O2 clathrates “explode” at much lower temperatures than CO2 clathrates, they should escape first, thus leaving higher CO2 levels behind. As the opposite is found, even within current much higher CO2 levels in the ambient atmosphere, that seems no problem at all.
The newest sublimation technique even sublimates everything of a sample under vacuum, leaving no ice at all, freezes water out and cryogenically freezes every gas to measure them later over a mass spectrometer, including the isotopic ratio’s…
The objections of the late Jaworowski are exactly the points that Etheridge et al. have investigated: drilling with three different methods, dry (hot coil) and wet, sampling CO2 top down in air, firn and ice and especially at closing depth both in firn and ice where the bubble closing starts and ends.
Jaworowski was a specialist in the radioactive outfall of Tsjernobyl, including in ice cores, but he never performed any CO2 measurement in ice, only had a lot of comments that were rejected only 4 years later. Still he insisted that he was right in 2002, 4 years after Etheridge’s work. That is your source…
“You’ve totally ignored the fact that Etheridge was comparing ice core samples from 2,000 years apart.”
Not that I know: the Siple ice core is much longer than the three Law Dome ice cores, but all ice cores show the same CO2 levels over the past 10,000 years in overlapping periods with a maximum difference between each other of +/- 5 ppmv:
https://www.ferdinand-engelbeen.be/klimaat/klim_img/antarctic_cores_001kyr.jpg
and
https://www.ferdinand-engelbeen.be/klimaat/klim_img/antarctic_cores_010kyr.jpg
Despite extreme differences between the ice cores in accumulation rate: from 1.2 meter per year for Law Dome to a few mm/year for the inland cores like Vostok and Dome C and between -20°C and -40°C average temperature.
It is up to you who you want to believe… I look at all the evidence, no matter who says it and no matter if I like the data or not…
Jim Siverly wrote on July 10, 2025 at 10:10 am, “Your Tau model is…”
I have no “Tau model.”
There are four commonly mentioned time constants associated with atmospheric CO2, as I discussed in my Comment on Stallinga. The one which matters for climate is the “adjustment time” (roughly fifty years, determined from measurements). I sometimes describe it as the “effective lifetime.” The associated half-life is about 35 years.
The one which Demetris Koutsoyiannis, Ed Berry, Peter Stallinga, and a few others erroneously fixate on is the “turnover time” (estimated from models at at three to five years). It is also sometimes called the “residence time.”
Jim wrote, “The plot you made… follows from my equation (2) from July 8, 2025 at 12:32 pm” (‘(2) NS(t) = k* [ C(t) – C* ]’).
The plot does not follow from any model or the equations derived from any model. It is just data: measured CO2 data, and calculated emissions (from economic statistics). The observed linearity is simply what the actual data show.
That linearity is unsurprising because we know that the main (geophysical & biological) processes which accelerate the removal of CO2 as the CO2 level rises are roughly linear.
Jim wrote, “You even label the graph “fossil only” seemingly unaware of the fact that it violates the equivalence principle.”
Apparently I was unclear. “Fossil only” simply means that the data in the graph includes only fossil CO2 emissions, and does not include estimates of “land use change emissions.”
It is commonly estimated that current CO2 emissions due to land use changes are only about 1/10 the magnitude of fossil CO2 emissions, but the fraction was higher in the past.
Land use changes (clearing forests and draining swamps) cause the release of (non fossil) CO2, but the magnitude can only be estimated from very uncertain models. So there are two ways of accounting for it:
Option #1. We can include very rough estimates of land use change emissions in the estimates of anthropogenic CO2 emissions. This is more “fair,” but at the cost of widened error bars on our estimates of anthropogenic emissions.
Option #2. Alternately, we can count only fossil CO2 as anthropogenic emissions, and consider the land use change emissions as a diminishment of natural CO2 sinks. That has the advantage of resulting in much more precise “anthropogenic emission” numbers, because we aren’t adding the rather large uncertainty of those land use change emissions. But the cost is that our calculated CO2 removal rates are somewhat understated.
Since I have very low confidence in the models used to estimate land use change emissions, in my plot I chose Option #2. That is what “fossil only” means.
I explained that in the paper:
Here’s that plot annotated to identify a few key events associated with “outlier” data points:
https://sealevel.info/Global_Carbon_Budget_2023v1.1_with_removal_rate_plot4.png
I also mentioned in the paper what the result is when Option #1 is used:
Jim wrote, “You assume no annual increases in natural emissions and no change in equilibrium conditions.”
Where did you get THAT idea? I said no such thing.
In fact, I can name several natural CO2 sources which I’m confident have increased. So what? There’s nothing remarkable about that. Natural CO2 sinks have increased faster.
It would be unreasonable to think that equilibrium levels cannot change. For one thing, we know from ice core data that CO2 levels at glacial maxima averaged around 190 ppmv, and during interglacial optimums they peaked around 280 ppmv, representing a roughly 90 ppmv shift in equilibrium CO2 level in the air (associated with very drastic environmental changes).
What’s more, the equilibrium between multiple carbon reservoirs depends on the total amount of carbon in the system. So if the total amount of carbon increases (due to burning coal), the equilibrium levels must also increase.
However, the atmosphere contains less than 3% of the carbon in the major carbon reservoirs (ocean, terrestrial biosphere/soil, and air), and our CO2 emissions have increased the total by less than 2%. So the change to the equilibrium levels due to that increase should be small.
Jim wrote, “you apply an equation that assumes the sink rate is proportional to the disturbance and claim the calculated result is a ‘measured’ adjustment time.”
I did no such thing. I just plotted the data. The linearity is obvious.
When you see an obviously linear plot, linear regression yields the equation which characterizes it. The equation follows from the data.
Perhaps I assume too much. Do you understand how to recognize linearity vs. acceleration vs. deceleration in a graph?
Ferdinand, from your comment July 10, 2025 at 4:07 am
The Tau model gets increasingly hard to understand. In your calculations for present day, you have
Tau = disturbance / [a difference in bidirectional flows]
Where is the derivation of this formulation?
In my objection to conflating a constant infusion with a one-time dose you wrote, “Sorry, but for any process in dynamic equilibrium, only the distance between the ‘disturbed’ pCO2 and the equilibrium pCO2 counts, no matter if that is a one-time injection or a continuous (increasing) supply.”
Where is that assumption validated? That could only be known if there was experimental data to confirm. There has been and likely never will be a cessation of burning fossil fuels.
Your graph C in the link you gave was calculated and, therefore, not observed. What is observed is that your calculation is based on a flawed model as Dr. Ed, Koutsoyiannis, Harde, Stallinga and others have been trying to explain to you.
I was unable to load the power point presentation. Can you check to see if the link is correct?
Dave Burton July 9, 2025 at 10:42 am
Dear Dave,
Did you ever learn to read?
Your comment shows you did not even read the legend to my Figure 3, which clearly says that it shows the exact data from IPCC Fig. 6.1.
My Figure 3 exactly represents the key carbon cycle data in IPCC’s Fig. 6.1. Maybe you are so incompetent that you cannot understand IPCC’s Figure. 6.1, and simply follow the numbers that show IPCC’s levels and flows for its Land-Air-Surface-Deep simulated carbon cycle.
The purpose of my Figure 3 is to make it easy to understand what is in IPCC’s Fig. 6.1.
You don’t understand either figure. You call these figures “unphysical.”
If you think you have better data on the fast carbon cycle than the IPCC spent about $500 billion to produce, then where is YOUR competitive carbon cycle diagram and your argument that somehow YOUR data is so much better?
You say my Figure 3 lower row for the “human carbon cycle” “has no basis in reality.”
But you did not even read my text that says the same thing about IPCC’s human carbon cycle. You did not read any of my papers that calculate IPCC’s true human carbon cycle using IPCC’s own natural carbon cycle data, to prove IPCC’s human carbon cycle is wrong as shown in IPCC’s Figure 6.1 and in my Figure 3.
The late Richard Courtney wrote that my work – that uses IPCC’s own data to prove wrong IPCC’s claim that H(1) is true – is the only breakthrough in climate science since 1980. You may disagree with Courtney, but you are not a qualified reviewer like he was.
In any case, I would think that anyone as involved as you are in climate science would have read what I wrote carefully. But you reject my papers that show this, when you have not shown there is any error in my argument.
You simply say, “I’m uninterested in analyzing that model, or the equations based on it. I prefer to focus on the real world.”
The “real world” you say. You are living in a pseudoscience dream world.
Then you change the subject to talk about Ah.
You say, “I showed you that your “Ah,” i.e., the anthropogenic processes which deplete the CO2 from the air, are negligible.”
No, you did not. You did junk science to make your claim.
My argument is simple. I simply assume human carbon follows the same rules as natural carbon follows to flow through the atmosphere, e.g., the climate equivalence principle.
Turns out this approach proves your claim is wrong. Further, there is no valid scientific basis to your claim.
You argue you can “ignore human emission in your mass balance arithmetic.”
You are wrong because when we include it, we get a different answer. We get the correct answer.
My paper above explains why your mass balance arithmetic is wrong, and you have not defended your error.
You don’t understand IPCC data that relates to this discussion.
You don’t understand my paper or its proof that H(1) is false.
You can’t do a correct carbon mass balance because you throw out the most important part of the balance.
Jim Siverly, July 10, 2025 at 12:31 pm
Jim, I think that David Burton has replied to most of your questions…
More details about what Tau means and different calculations can be found at Wiki:
https://en.wikipedia.org/wiki/Exponential_decay
In a former page of Wiki it was shown that for a linear response of a system in equilibrium, the formula:
Tau = disturbance / effect is independent of the time frame over which the ratio is measured. For non-linear decay rates, one need to do the calculation for each time frame again.
Both the uptake by the oceans and by vegetation are quite linear.
Effect in the case of CO2 is the net increase in output when the CO2 level above the equilibrium increases, the net increase in output is the difference between inputs and outputs, for each bidirectional exchange between reservoirs apart as good as for all exchanges together.
And in my opinion, a simple calculation, based on observations, is as valid as a direct observation.
Our idea of the real word is based on real world data, the “one-way” model is rejected by the same data:
If one has only 1.5-5% FF in the input, the one-way model of Koutsoyiannis, Harde, Stallinga,… never can show higher levels of FF in the atmosphere than 5%. In reality, the atmosphere already contains over 10% FF and the ocean surface over 6%.
If you click on the reference, the sheets are automatically downloaded, thus maybe found in your download map.
If that doesn’t work, I will make pictures of the relevant sheets…
Ferdinand,
Wiki is not a scientific reference. It has no scientific credibility. It has site moderators who push agendas. Your Fountain Model, where outflow is proportional to [pCO2(atm)-pCO2(ocean)] has no scientific basis-that is, there is nothing that it is derived from. There is no partial pressure of CO2(ocean). Henry’s Law states that the amount of gas that dissolves in a liquid is directly proportional to the partial pressure of the gas above the liquid. Dr. Ed’s hypothesis that outflow is proportional to level is derivable from Henry’s Law and the Ideal Gas Law. Your model has no natural basis. Also, you continue to violate the Equivalence Principle, although you continue to claim that you don’t, but Dr. Ed does. You don’t make any sense.
Ferdinand,
The partial pressure of CO2 is equal to the mole fraction of CO2 times the total pressure of the atmosphere. It has nothing to do with some imaginative pCO2(ocean).
Dave Burton, in answer to July 10, 2025 at 11:46 am, and Ferdinand Engelbeen July 10, 2025 at 1:41 pm
No, Ferdinand, Dave Burton replied unsatisfactorily to my questions. He claims the “CO2 removal rate vs. CO2 level” plot does not follow from any model. The plot in question has the form NS(t) = k* [ C(t) – C* ] with CO2 removal rate being net sink, NS(t), and CO2 level as C(t). When NS(t) = 0, C(t) = C* or as Dave’s preprint says, the “x-intercept gives an estimate of the equilibrium level, which is 285 ppmv. Like it or not, that is a model equation.
Ironically the explanation of “fossil only” misses the fact that sink rate is calculated from Eh(t) – dC(t)/dt which is another way of saying “fossil carbon not removed” in violation of the equivalence principle.
Furthermore, Dave admits that, “the equilibrium levels must also increase.” Yet his simple math model portrayed by the “CO2 removal rate vs. CO2 level” plot leaves no room for that possibility.
Ed wrote on July 10, 2025 at 1:35 pm, “My Figure 3 exactly represents the key carbon cycle data in IPCC’s Fig. 6.1.”
No, Ed, it represents your misunderstanding of AR5’s Fig. 6.1. They show in red the natural increases in natural CO2 sinks which result from elevated CO2 levels, and you misinterpreted the red as meaning those were “human” CO2 sinks.
Perhaps the AR5 authors should have used a different color, rather than using the same red that they used for human CO2 emissions. It was clear to me what they meant, but obviously it was unclear to you. (The AR6 authors used a quite different diagram for their figure 5.12, which I found less clear, but you might prefer it,)
For instance, the AR5 authors used a red arrow for 20 PgC/year (of the 80 PgC/year) of CO2 absorbed by the ocean from the atmosphere, and likewise a red arrow for 17.7 PgC/year of the CO2 emitted from the ocean into the atmosphere, because those increased fluxes are due to the elevated levels of atmospheric and ocean surface CO2. You interpreted those as “human.” But those are both natural CO2 fluxes.
The reason the AR5 authors drew them in red is because they represent the portion of the natural CO2 fluxes which are due to the rise in atmospheric CO2 level (and the rise in surface water DIC), which they understand (but you deny) is due to human CO2 emissions.
The physical mechanism for those increased fluxes is pretty obvious, too: a 50% elevation in CO2 partial pressure in the atmosphere results in a 50% increase in CO2 air molecules striking and being absorbed by the ocean surface.
Likewise, since the DIC in surface water tracks pCO2 in the air pretty closely, the AR5 authors estimated that that rise increases CO2 fluxes the other direction by 17.7 PgC/year.
Now, can we please discuss the actual, physical anthropogenic CO2 sinks?
You claimed that the human processes removing carbon from the atmosphere (your “An”) are not negligible. So I discussed those processes, one by one, here:
https://edberry.com/co2coalition/#comment-112419
When I say that “Ah,” i.e., the anthropogenic processes which remove CO2 from the air, are negligible, I mean that they are much smaller than the error bars on anthropogenic emissions, so they can be ignored in “mass balance” arithmetic.
1. Approximately 59 kt of CO2 per year are removed from the atmosphere by Direct Air Capture projects, worldwide. That’s about 0.00015% of anthropogenic emissions.
2. Approximately 50 Mt of CO2 per year is captured and stored by operational CCS facilities, but 99.9% of that is captured at the sources, so it’s really avoided emissions, not removals. But if you count it, that’s a little over 0.13% of anthropogenic emissions. Are you counting CCS as part of your “An”?
3. According to GCB (2024), cement carbonation is estimated to remove about 214 MtC from the atmosphere per year, globally, which is about 0.784 Gt of CO2. That’s conventionally considered a natural removal process, but IMO you could call it anthropogenic. But it’s only about 2% of anthropogenic CO2 emissions, so even that is still much smaller than the error bars on anthropogenic emissions. Are you counting cement carbonation as part of your “An”?
Can you identify any other anthropogenic sinks?
● If so, then what are they?
● If not, then please acknowledge that your “An” is negligible, so that we can move on.
“When my information changes, I alter my conclusions. What do you do, sir?”
– John Maynard Keynes (attributed)
Ferdinand Engelbeen, July 10, 2025 at 1:41 pm
The Wiki discourse on exponential decay is boilerplate. It explains the math applicable to a system at rest disturbed by “a quantity is subject to exponential decay if it decreases at a rate proportional to its current value.” Since CO2 increases annually, in part due to the fraction of industrial carbon contributing to it, I contend simple exponential decay does not apply.
Where is the former page of Wiki showing that, for a linear response of a system in equilibrium, the formula [ Tau = disturbance / effect ] is independent of the time frame over which the ratio is measured?
This sentence I do not understand: “Effect in the case of CO2 is the net increase in output when the CO2 level above the equilibrium increases, the net increase in output is the difference between inputs and outputs, for each bidirectional exchange between reservoirs apart as good as for all exchanges together.”
Also, if by “And in my opinion, a simple calculation, based on observations, is as valid as a direct observation,” you mean simple math, I’m not buying it.
Thank you for your patience with my attempts to understand your position. I did get the download of the power point presentation and will have a look now.
(Sorry about the botched </a> in that comment.)
Stephen wrote on July 10, 2025 at 2:55 pm, Wiki is not a scientific reference. It has no scientific credibility. It has site moderators who push agendas.”
I like to say that Wikipedia is untrustworthy for anything controversial. Inevitably, partisans for one side of the argument take over the articles, and turn them into propaganda. Gender issues and climate change are particularly notorious examples, but you really cannot trust Wikipedia for information about anything controversial. Here’s an eye-opening article:
Harvard Students Edit Wikipedia To “Dismantle The Patriarchy”
Since Jimbo Wales is a leftist, his thumb on the scale ensures that that side of the argument generally “wins” on Wikipedia.
But Wikipedia is not completely useless. For topics which nobody argues over it is usually fine.
For instance, it is good for looking up data cable pinouts:
https://en.wikipedia.org/wiki/IEEE_1284
The article on exponential decay is fine, too:
https://en.wikipedia.org/wiki/Exponential_decay
Ed,
I can’t sit quietly by and ignore the ignorance you show every time you mention C14. A year ago, I presented an oral paper at the annual meeting of the NW chapter of the American Physical Society in Bothell, WA, which I called “Challenging the Abuse of Atmospheric Radiocarbon Data “. You were featured, but you had company. A few corrections to your narrative:
• DeltaC14 is a measure of the C14/C12 ratio in a sample, and there is indeed a “balance” involved in determining the reference ratio, the C14/C12 ratio that gives Delta C14 = 0. The amount of C14 in fast cycle carbon is determined by the competition between the mostly constant production rate of C14 in the upper atmosphere, and the decay rate dictated by C14’s 5730 yr half-life. At the “balance level”, as much C14 is leaving the fast-cycle system by decay as is being added by upper atmosphere production. This balance level has nothing to do with flow rates into or out of the atmosphere as you assert.
• If an object containing carbon, say a piece of wood, is sequestered from the atmosphere for a long time because it is no longer growing, some of its C14 decays (to N14), and the C14/C12 ratio in the sample decreases. The magnitude of the decrease indicates the age of the sample. For example if C14/C12 is measured to be half of the reference value, the sample is about 5730 years old. You cannot extract a date from the C14 concentration alone, because without knowing how much carbon was in the sample to begin with, that concentration is meaningless. That is why the isotope ratio is used in dating, not concentration. It is not because Delta14C has a balance level and C14 concentration does not, as you claim.
• Let’s talk about atmospheric C14 concentration, measured say as the molar fraction of the atmosphere. This is the quantity that you and Harde and Salby and a couple of others thought was the same thing as DeltaC14. I believe that is what you mean by “14C” in your Figure 10 plot. You don’t say what the units are but add it to DeltaC14. Real physicists don’t add apples and oranges.
• You do not understand what is meant by “Suess effect dilution”. If you did, you might have called your paper “A calculation of Suess effect dilution.” Seuss effect dilution is what causes the amount of industrial carbon in the present atmosphere to be much less than what would be naively calculated by ignoring disequilibrium isofluxes. Climate scientists are not naïve on this point. You are. To be a credible challenger of the consensus you must understand the consensus first. You do not.
A thought experiment to help you, and others who are uneasy with disequilibrium isofluxes, to understand:
Imagine a short (few decades) stable period in a pre-industrial world, where the atmospheric CO2 level is, say 280 ppm. Solar variability is nil, Milankovitch cycles don’t change much on a decadal time scale, the ocean CO2 content has reached equilibrium with the atmosphere as dictated by Henry’s Law, the Revelle factor, etc., and the biomass is stable. In this idealized world the carbon levels in the major reservoirs are stable except for seasonal variations, but there are still balanced two-way exchanges much like today. Oceans outgas CO2 in one place and absorb it in another. Plants grow by taking in CO2 from the atmosphere and return it when they die and decay. Human emissions are 0. Atmospheric CO2 growth is 0. Net global uptake is 0. Natural emissions are exactly balanced by natural absorption. Now aliens land and use this idealized world to test thermonuclear weapons in the atmosphere. The tests double the atmospheric C14/C12 ratio to 2 parts per trillion, twice the one part per trillion that existed before.
Questions:
1. What happens to the atmospheric CO2? Answer: nothing, unless you want to worry about the effects of a part per trillion increase.
2. How does the C14 /C12 ratio change over time? Answer: it returns to one part per trillion in about a decade, just as it did after 1965 in the real world.
I think this thought experiment is useful because it shows how isotope changes need not be linked to level changes. The real world is more complicated than the idealized world described, but real-world processes like the decay of the bomb pulse can be understood by simple insights.
Dave Burton July 10, 2025 at 4:37 pm
You wrote:
Dear Dave,
Did you read the Figure 6.1 Legend?
IPCC’s Fig 6.1legend reads:
So, it looks like you can’t read, as I assumed in my last comment.
Next you wrote:
Not valid, Dave. Your reasoning is circular.
You assume human carbon outflow is negligible because you already assumed human carbon caused all the CO2 increase. The IPCC assumes the same thing in its red numbers in its Fig 6.1.
The proper physics solution is to treat the human carbon cycle and natural carbon cycle independently but using the same rules. This is a lot easier and far more accurate than the way you are doing it.
The one thing I did, that no one else did, was to recalculate IPCC’s red numbers using the same rules that IPCC used for its black numbers. That’s my breakthrough. It proves H(1) is false.
Einstein said the most difficult part of a physics problem is usually its formulation. I did the correct formulation of the problem. Anyone can repeat my calculations.
Your formulation of the problem is invalid and wrong. That’s why your solution is wrong.
Of course. Human carbon flows into the same “sinks” as natural carbon flows. Total human carbon has added one percent to the carbon in the natural carbon cycle.
Do you honestly think there is a precise fixed limit on these sinks?
You have seen the photo of the four trees that grew up in different CO2 levels. Every tree on the planet will soak up more CO2 if there is more CO2.
Your focus on sinks rather than sources, inflows rather than outflows is unnatural. That’ not how things work.
Your way is like riding a bicycle backward, downhill. You go out of balance and crash.
In summary, you are wrong about the red numbers in IPCC’s Fig 6.1.
You are wrong about using sinks that have, at best, 10% accuracy, to arbitrarily make decisions about human carbon that is only 1% of the total carbon in the carbon cycle.
David Andrews July 10, 2025 at 6:41 pm
Dear David,
Thank you for your comment because you support a lot of what I am teaching.
You agree with my balance levels but do not understand that I consider the natural production of 14C as an “inflow of 14C.”
I claim the reason carbon dating works is because Delta14C has a balance level, which means 14C does not. 14C changes with 12C in a manner that keeps Delta14C at its balance level. Why do you think we disagree?
I, Harde, and Salby may have mis-labeled a chart way back in 2019. We corrected this in our following publications. Are you perfect? You have made a lot of physics errors in your publications.
David. You know I understand the Suess effect dilution. Even my draft paper above explains it. I think you are upset because the Suess effect has turned out to be minimal, proving H(1) is false.
You wrote, “In this idealized world the carbon levels in the major reservoirs are stable except for seasonal variations, but there are still balanced two-way exchanges much like today.” Thank you. That is exactly what my carbon cycle model explains. Please explain that to the CO2C authors.
You say, in your mental experiment, the C14 /C12 ratio returns to its original level in about a decade. That is incorrect. It would return at the same rate Delta14C has returned since 1970, which is with an e-time of 16.5 years. It cannot return to its original value in ten years.
Jim,
I have several times had trouble understanding your thought processes, but what on earth does this mean?
“Ironically the explanation of “fossil only” misses the fact that sink rate is calculated from Eh(t) – dC(t)/dt which is another way of saying “fossil carbon not removed” in violation of the equivalence principle.”
While once you helpfully explained to Ed his error in interpreting the “simple math” associated with carbon conservation, now you seem to suggest that carbon conservation violates the principle that industrial and natural should behave the same??!!?? One way to insure that these two types are treated the same is to just analyze total carbon as all mainstream scientists do. Did you know that Richard Courtney, whose praise Ed repeats over and over, for separating their analysis, had a career in the coal industry? That by itself does not disqualify his opinion, but certainly raises some flags.
You are on record as saying that “you are on Ed’s side.” Perhaps that should explain to me why your logic is so hard to understand.
Ed,
Do you really not understand that the Seuss effect is minimal only because it has been diluted by disequilibrium isofluxes? And that no reputable scientist disagrees with that? And that therefore the small amount of industrial carbon in the present atmosphere says nothing about the cause for the rise? To understand the cause of the rise you have to stop pretending that you don’t understand the mass-balance (carbon conservation) argument.