
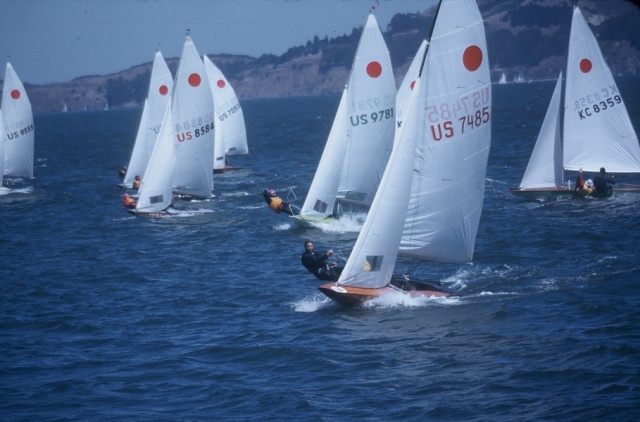
Valerie (on the trapeze) and I are sailing US 7485 a minute after the start of one of 5 races where we won the US National Championship in Austin, Texas, in 1975.
Ed Berry, PhD, Physics
As of September 1, 2020, Republican leaders in Washington admit they are losing. They say so in their emails. While Trump has closed on Biden’s lead, a Republican victory is far from assured.
The latest poll has Democrats LEADING, meaning that if the Election were held today, we’d LOSE our Senate Majority. – Mitch McConnell, September 5, 2020.
New reports have emerged revealing that Democrats are majorly outraising conservatives by MILLIONS — making the possibility of a liberal takeover of our states EXTREMELY LIKELY. – Trump’s State Majorities, September 5, 2020.
A liberal takeover isn’t inevitable – but it becomes more likely every day… If Schumer takes control of the Senate, he and Nancy Pelosi will have the Majorities they need to implement radical policies like The Green New Deal, socialized health care and open borders – oh and they’ll pay for all of it by taxing YOU. – Newt Gingrich, September 5, 2020
If Republicans lose in November, they will take down the hopes and dreams of good people in all free countries of the world. And you can kiss your economic and intellectual freedom goodbye.
Plus, the Democrat-socialist world is sure to bring much higher taxes, gun confiscations, and forced vaccinations. Your best hope then is to elect Republicans for governor and all other political offices.
I support President Trump and all Republicans. However, I think they may lose in 2020, unless they challenge the Climate Change Fraud.
“But Republicans will win on law and order.” – No, because Democrats see their lawlessness as a just means to achieve their end.
“But Republicans will win on economy and morality.” – No, because Democrats now have more rabid votes for socialism.
“But Republicans will win because they are enthusiastic.” – No, because enthusiasm does not vote. People vote.
How Republicans lost the demographic war.
In 2016, Trump won Michigan, Pennsylvania, and Wisconsin by a combined 77,000 votes.
Every day since America elected President Trump, another 10,000 students, brainwashed to vote Democrat, became eligible to vote. Meanwhile, millions of older Trump voters have died.
That demographic change gives the Democrats 15 million new voters in 2020. Distribute these 15 million new voters among the states according to a state’s electoral votes and Democrats can win every key state in the 2020 election.
Republicans ignored the climate issue.
Republicans thought the polls where climate took tenth place meant they could ignore the climate issue. Republicans thereby allowed the Democrats to use climate change to get more votes.
Republicans let the Democrats control education. This let the Democrats indoctrinate the Generation Z’s (those born after 1996) to believe (unscientifically) that human CO2 causes dangerous climate change. “Z” is for Zombies.
The Democrats used climate change to scare the Gen Z’s into voting Democrat to save the Planet. When you scare people into a belief, that belief controls how they think, how they act, and how they vote.
No one told the Gen Z’s that human CO2 is NOT the primary cause of CO2 increase. Recent polls of the Gen Z’s show the Democrat’s success. An overwhelming 83 percent of the Gen Z’s believe human CO2 causes dangerous climate change. Only 15 percent have no opinion. And 2 percent reject the Democrat’s version of climate change.
Congratulations Republicans. You let the Democrats get 83 percent of the Gen Z vote and you get only 2 percent.
Because Republicans ignored the climate issue, more Republicans now believe the Democrats are correct about climate. In 2020, a full 73 percent of America’s voters now believe the Democrats on climate change. The “squishy” Republicans think they must compromise with the Democrats on climate.
You can’t compromise on truth. That is how to lose the election. Republicans will get more votes if they stand firm for climate truth.
The Republican refusal to take a strong position on climate truth is why the Democrats won the House in 2018 and why they could win the presidency, senate, and house in 2020.
The Democrat’s “climate science” is a house of cards built on a foundation of sand.
The IPCC (United Nations Intergovernmental Panel on Climate Change) formalizes the Democrat’s “core theory” of climate change. They claim:
The level of natural CO2 in the atmosphere has remained at 280 ppm. Therefore, they conclude human CO2 caused all the CO2 increase above 280 ppm.
That “core theory” is the Democrat’s “climate science” foundation of sand.
True science now proves the Democrat’s “climate science” foundation is wrong. This means everything the Democrats claim about climate is wrong because everything they claim is based upon their foundation.
The Democrat’s house of cards has collapsed. To understand why, we must understand the scientific method.
Voters do not understand the scientific method. The Democrats never taught the Gen Z’s the scientific method. The voters think, incorrectly, that the side that has the most published papers and the most government, media, and professional support wins. But votes do not determine truth.
Albert Einstein described the scientific method. He said many experiments may prove him right, but it takes only one experiment to prove him wrong. That means it takes only one proof that a scientific theory is wrong to overpower all the evidence used to claim the theory is true.
Preprint #3 topples the IPCC-Democrat core theory of climate change.
My Preprint #3 follows the scientific method to prove decisively that the IPCC-Democrat core theory of climate change is wrong. IPCC’s science error is not in some minute calculation. Their error is in fundamental science. Stuff they should have learned in college.
My Preprint #3 is on my website. Top climate scientists worldwide have thoroughly reviewed and approved it. No scientist has found any error in its proof the IPCC-Democrat core theory of climate change is invalid.
Here are some comments by scientists:
Ed’s paper “quantifies the anthropogenic and natural contributions to changes in atmospheric CO2 concentration without need for knowledge of rate constants for individual mechanisms. This is a breakthrough in understanding which [other scientists] including myself all failed to make.” – Dr. Richard Courtney
“A proper model must address all CO2 in the atmosphere at once, without discrimination. You do that magnificently from first principles.” – Dr. Gordon Fulks
“Ed does not make mathematical mistakes in solving his rate equations.” – Dr. William Happer
“Dear Ed, Congratulations – a wonderful piece of work.” – Dr. Nils-Axel Morner
What does the failure of IPCC’s core theory mean to politics?
The demise of IPCC’s core theory makes all IPCC’s climate reports, climate models, and thousands of peer-reviewed scientific papers invalid because all these incorrectly assume IPCC’s core theory is true to derive their conclusions. Garbage in, garbage out.
All laws and all court rulings that assumed IPCC’s core theory was true are invalid. California’s AB 32, for example, has no science to justify its existence.
IPCC’s so-called 97 percent consensus – if it ever existed – is over. Their whole climate game is over because they now have no valid operating core theory of climate change.
“Don’t melting glaciers, rising sea levels, more hurricanes, species dying, floods, droughts, etc., prove human CO2 causes climate change?” No, events do not prove their cause.
What is the cause of a head ache or a stomach ache? Obviously, an effect does prove what caused it. If effects proved their cause, doctors would not have to diagnose an effect to find the cause.
Climate treaties and climate laws are useless because they cannot control nature.
What is the truth about climate change?
Data show the natural CO2 level was much higher than 280 ppm before and after 1750. So, natural CO2 in the atmosphere did not remain at 280 ppm as the IPCC claims.
Calculations with IPCC’s own data show, as of 2020, natural CO2 caused 75 percent of the increase above 280 ppm and human CO2 caused 25 percent. That is a long way from IPCC’s claim that human CO2 caused ALL the increase. And it changes the whole climate picture.
IPCC-Democrats claim human CO2 stays in the atmosphere for thousands of years while natural CO2 flows freely out of the atmosphere. This IPCC-Democrat claim is as anti-science as anyone can get.
Human and natural CO2 molecules are identical. Therefore, human and natural CO2 obey the same natural laws. Human CO2 flows out of the atmosphere as natural CO2 flows out of the atmosphere. Human CO2 does not stay in the atmosphere for thousands of years. Human CO2 is not a threat to the planet.
(This conclusion is an application of the Equivalence Principle of physics. Einstein used the Equivalence Principle to derive his General Theory of Relativity.)
Calculations using IPCC’s own data show if all human CO2 emissions were to stop in 2020, the human-caused increase would fall from 33 ppm in 2020, to 10 ppm by 2100, and to 5 ppm by 2200.
What if the natural CO2 level had stayed constant at 280 ppm as Democrat’s claim?
Then human emissions would have increased the CO2 level from 280 ppm to only 313 ppm. Even the Democrats admit that 313 ppm is of no consequence to climate change. So, the Democrats have no case for climate change.
What have the Republicans missed?
Put simply, Democrats have convinced voters that “Democrats represent true science and Republicans represent anti-science.” That view is incorrect but that is the prevailing public perception.
Voters want to be on the side of “true science.” Republicans have not challenged the Democrats on climate science. Therefore, the Republicans let the Democrats win the science issue by default.
Republicans argue that economy is more important than climate, which is true. But that argument admits the Democrats are correct on science, e.g., “IPCC’s core theory is true.” So, it helps Democrats get more votes.
Similarly, the argument that “warm is better than cold” is also true. But it also admits the Democrats are correct on climate science. So, it helps Democrats get more votes.
The Democrat’s climate politics breeds socialism. Democrats have convinced voters that only socialism and a world government can save the planet from a climate disaster. They have convinced the voters that socialism is necessary to save the world from the Republican conservative monsters.
The Democrat platform and candidates put the climate issue at the top of their concerns. The Republican platform and candidates do not even mention the climate issue. In politics, if you don’t fight, you lose.
Democrat climate voters are not fazed by the “Black Lives Matter” riots. Dedicated Democrats believe the end justifies the means. And their end goal is socialism and world government.
And socialism it will be unless Republicans do something to stop this threat … FAST.
How Republicans can win.
Some Republican leaders say, “I think Trump will win by a landslide.” Therefore, they think they can ignore the climate issue.
Such thinking on the part of leaders is irresponsible. What they “think” is not a valid basis for Republican policy because what they “think” may be wrong. No one knows how well President Trump will do in the 2020 election. He could, if the stars are properly aligned, win big time. He could also lose big time.
Here is what US Senator Mitch McConnell wrote:
With less than two months to go until Election Day, things aren’t looking good. Democrats are outraising Republicans in nearly a DOZEN battleground states, and, if that weren’t bad enough, they’re leading in the polls too, putting the future of our Republican Senate Majority in JEOPARDY.
Just 4 seats will determine control of the Senate, Fellow Conservative. Every contribution – no matter how big or small – will help us make sure that we protect these critical seats and DEFEND our conservative agenda.
– Mitch McConnell, September 7, 2020.
Does McConnell’s statement imply Republicans should ignore an issue that could win their elections?
More money is just one way to get more votes. But if voters are already decided, and there is no new issue to change their minds, more money will not carve out a win for Republicans. Republicans must do something else to change the polls. There is only one new issue that will get Republicans significantly more votes: Climate Truth.
To get significantly more votes, Republicans must change how the voters think about climate. If Republicans tell the people the truth about climate, they will win the 2020 elections, save the Republican Party, and save the world.
Republicans will not lose any votes by standing up for climate truth. They will likely gain 10 percent, which is enough to turn an election disaster into an overwhelming victory.
Voters want true science. Show voters you represent true science and you will get their votes.
No one has told President Trump he is correct on climate. No one! Why?
Isn’t it the responsibility of elected Republicans to tell the President?
President Trump tweeted on July 10, 2020:
“Too many Universities and School Systems are about Radical Left Indoctrination, not Education. Therefore, I am telling the Treasury Department to re-examine their Tax-Exempt Status and/or Funding, which will be taken away if this Propaganda or Act Against Public Policy continues. Our children must be Educated, not Indoctrinated!”
President Trump nailed it.
Scientists, teachers, and professors should have found IPCC’s fundamental scientific error. It is not that complicated. Instead, they lied to the public and indoctrinated their students on junk climate science.
Now, President Trump faces a problem like President Herbert Hoover faced in 1928 – a demographic change years in the making. President Hoover had no chance to beat FDR because of a demographic change. And when he lost, there was not another Republican president for 24 years.
The stakes are high in 2020.
If President Trump loses in 2020, it will end Republican control of the presidency and congress for a very long time. Maybe forever, because Democrats will flood America with immigrants to assure they control America forever, and they could hold a Constitutional Convention and change our Constitution to give them more power.
If Republicans lose the presidency and congress in 2020, they will be like Christians in China. Powerless and hunted.
Is that not reason enough to take a strong stand for climate truth?
President Trump must lead Republicans to declare the Democrat’s core theory of climate change is a scientific fraud of the highest order. That declaration will make the news. And it will open the door to explain why, in very simple term, why the Democrats are wrong about climate and science.
Climate truth makes President Trump the most pro-science president in recent history. The New York Times will not tell you that. So, Republicans must tell the people.
Who is going to tell President Trump he can win on the climate issue?
How Republicans can benefit from climate truth:
- Prove President Trump is correct on climate. (His advisors did not tell him this.)
- Show voters that Republicans support real science.
- Swing 10 percent of voters from Democrat to Republican before the election.
Democrats are guilty of climate malpractice. Republicans can demonstrate to the voters, the media, and the law that the Democrat represent anti-science and Republicans represent true science.
The Democrat climate claims as real as the Wizard of Oz. Republicans, like Toto, can pull back the curtain so everyone can see the Democrat’s fraudulent climate wizard.
Democrats wasted a half trillion America dollars on their false climate science.
The Democrat-IPCC climate fraud is the biggest fraud ever played upon the human population. The IPCC and its supporters have lost their scientific credibility. They failed the major climate science project in history.
They cost you money. They disrupt your economy. They damage your environment with their useless wind energy facilities. They block your access to low-cost reliable energy. They harm America’s national defense.
Perhaps most damaging of all, they distort your mind. They force you to believe your CO2 emissions damage the planet. They force you to do penance for your “environmental” sins. They force you to believe their alarmism – which is the polar-opposite of true science.
Republicans have two choices:
- They can ignore climate science and hope a November miracle will save them. Or,
- They can challenge the Democrats on climate and get at least 10 percent more votes.
If Republicans ignore climate science, they may lose the presidency, the senate, and the house.
If Republicans challenge the Democrats on climate FAST, they will get enough votes to assure they win.
If you want to preserve your American freedom, you had better fight smart now. Because if the Democrats win the presidency, the Senate, and the House in 2020, they are going to make the lives of conservatives living hell. They have openly promised as much.
Will Republicans be wimps or warriors?
What matters is not the size of the dog in the fight, but the size of the fight in the dog.
Let’s roll!
Ed Berry
Website: https://edberry.com
Email: ed@edberry.com
Cell: 406.471.1464
Dr Ed Berry:
You criticize the Republican politicians for not listening to you! True.
I criticize you for not listening to me and benefiting from my research.
Your mathematical proof of global warming makes my head hurt – John Doe does not read.
I bought tickets to go to a Republican fundraiser tonight – I will take your data with me.
Thanks!!!
This is what I learned.
CO2 is not the cause of the temperature rise after 1980.
There is much data to prove it;
– 100 years of industrial revolution and two world wars and zero temp increase till 1980
– Ice core data that shows the same CO2 level as temperature rose as when it fell – can’t be both.
– Arctic Ice melting along Russia’s shore in summer but not along Canada’s shore
– Arctic winter ice now near the area pre 1980.
– Antarctic ice shelfs are melting from warm ocean water, not warm air.
– Polar Bears, 25,000 and thriving instead of dying.
– Ameria’s glaciers are not ‘gone by 2020’, signs are being changed.
– West Antarctic glaciers are melting over active volcanoes; east Antarctic is gaining ice.
– 16 Global hot spots exist, they cannot be created by a uniform GHG blanket
– Each hot spot is above a uranium ore deposit!
– Where there is no uranium ore, there has not been any temperature rise.
– Why? Why? – Science says methane contains hydrogen which forms water on burning.
Water vapor – is a vey light gas which carries CO2 skyward.
– Sunspots cause uranium in the ore to fission; exactly like a nuclear reactor.
– Sunspots are almost zero now – the reactions have stopped – the planet is cooling
– The lates NOAA global temperature map shows all but one sunspot area has cooled off.
The planet is cooling – yet, as you say the Republican party is ignoring this and will lose.
Two heads are thicker than one.
The Republican Part has a thick head, and will probably lose.
We really should work together.
Art Krugler
125 Sparrow Circle.
Grass Valley, CA 95945
President – Krugler Engineering Group, Inc.
Registered Professional Engineer; ChE and Me 6 states.
Art Krugler says: “The planet is cooling – yet, as you say the Republican party is ignoring this and will lose”.
Art Krugler is correct on these two points as I will point out here. We know that the Republican party lost the last election due to irregularities in the voting process brought about by the so called COVID-19 pandemic. This information from 30 years of temperature records shows that the Earth’s temperature is cooling.
The Earth is cooling, not warming, while Eric Grimsrud’s devil in the sky, CO₂, is increasing. Does the ‘no fly’ professor have a valid explanation for that?
The Earth’s Temperature
Currently: 57.07°F/13.93°C
Deviation: -0.13°F/-0.07°C
Stations processed last hour: 54388
Last station processed: Malacca, Malaysia
Update time: 2021-10-06 08:11:32 UTC
Average (Jan 2015-Aug 2021): -0.336°C
Source: Temperature.Global
Data: NOAA global METARs 2015-current
NDBC global buoy reports 2015-current
MADIS Mesonet Data, NOAA OMOs
Temperature.Global API
Our API is free to use, no registration is necessary.
Global Temperature – Sample Request
http://temperature.global/api.php
Sample Response
Array
( [temp] => 57.01
[dev] => -0.19)
Response Format
temp – The current global temperature in degrees F
dev – The current global temperature deviation from 30 year global average in degrees F
Previous Years
The recorded global temperature for previous years:
2015 average: 0.98 °F (0.54 °C) below normal
2016 average: 0.48 °F (0.27 °C) below normal
2017 average: 0.47 °F (0.26 °C) below normal
2018 average: 1.33 °F (0.74 °C) below normal
2019 average: 0.65 °F (0.36 °C) below normal
2020 average: 0.00 °F (0.00 °C) below normal
http://www.temperature.global/?fbclid=IwAR2mvfvcL0od4e1OnVFh3EcNVd0on-CahKapSN1S7UCs1tnU2fHejTTlePA#twitter
I attempt to carry on discussions with the anthropogenic climate change crowd and I have found that, for the most part, they are a group that has no use, or regard, for the truth if that truth makes their position about the Earth’s climate changing and warming because of the trace gas CO₂ out to be no more than an unsubstantiated prevarication. When that occurs on such sites as Gavin A. Schmidt’s, Real Climate, then the evidence that is submitted that points out the lies that Schmidt, or his sycophants, have put forth as being the truth, it is censored out of the conversation.
The climate alarmist group certainly do not care to deal with this fact when it is presented to them when their whole premise is that the planet is about to be incinerated due to the trace gas, CO₂.
World Meteorological Organization Assessment of the Purported World Record 58°C Temperature Extreme at El Azizia, Libya (13 September 1922),
“On 13 September 1922, a temperature of 58°C (136.4°F) was purportedly recorded at El Azizia (approximately 40 kilometers south-southwest of Tripoli) in what is now modern-day Libya…………. The WMO assessment is that the highest recorded surface temperature of 56.7°C (134°F) was measured on 10 July 1913 at Greenland Ranch (Death Valley) CA USA.”
http://journals.ametsoc.org/doi/abs/10.1175/BAMS-D-12-00093.1?af=R&
This is a record that still holds after 108 years. Isn’t it the same WMO that said that this is the warmest time in earth’s history, or some other such nonsense?
I recently was made aware of this news, and I went to the rag that is called the ‘Washington Post’ to get this startling information on the record cold in Antarctica. For the far-left global warming zealots, the truth is like Dracula being struck by sun light.
South Pole posts the most severe cold season on record, a surprise in a so-called warming world. While the rest of the world sizzled, the South Pole shivered with an average temperature of minus-78 degrees over the past six months.
October 2, 2021 at 8:45 a.m. EDT
This story, first published Friday evening, was updated Saturday morning (obviously with more lies). Amid a record hot summer in large parts of the Northern Hemisphere, beset by devastating fires, floods and hurricanes, Antarctica was mired in a deep, deep freeze. That’s typically the case during the southernmost continent’s winter months, but 2021 was different. The chill was exceptional, even for the coldest location on the planet.
The average temperature at the Amundsen–Scott South Pole Station between April and September, a frigid minus-78 degrees (minus-61 Celsius), was the coldest on record, dating back to 1957. This was 4.5 degrees lower than the most recent 30-year average at this remote station, which is operated by United States Antarctic Program and administered by the National Science Foundation.
While impressive and unexpected, scientists characterized this record as a mere blip and curiosity as both Antarctica and the planet continue to rapidly warm amid escalating extreme weather. Scientists stressed that the record cold over the South Pole in no way refutes or lessens the seriousness of global warming. They say, Antarctica is notorious for its wild swings in weather and climate, which can run counter to global trends… Not only is Antarctica warming over the long-term, but its ice is rapidly melting, contributing to sea-level rise… The temperature at the South Pole at the time of publication of this article on Oct. 1 was minus-67 degrees with a wind chill of minus-101.
https://www.washingtonpost.com/weather/2021/10/01/south-pole-coldest-winter-record/
Where is the sea level rise that this rag is mentioning?
Relative Sea Level Trend, 999-001 Bahia Esperanza, Antarctica
• EXPORT TO TEXT | EXPORT TO CSV | SAVE IMAGE
The relative sea level trend is -4.82 millimeters/year with a 95% confidence
interval of +/- 2.45 mm/yr based on monthly mean sea level data from
1961 to 1993 which is equivalent to a change of -1.58 feet in 100 years.
https://tidesandcurrents.noaa.gov/sltrends/sltrends_station.shtml?id=999-001
This record for cold was never publicized as far as I know.
“New Record for Coldest Place on Earth, in Antarctica. Scientists measure lowest temperature on Earth via satellites… Using new satellite data, scientists have measured the most frigid temperature ever recorded on the continent’s eastern highlands: about -136°F (-93°C)—colder than dry ice. The temperature breaks the 30-year-old record of about -128.6°F (-89.2°C), measured by the Vostok weather station in a nearby location.
Although they announced the new record this week, the temperature record was set on August 10, 2010.”
http://news.nationalgeographic.com/news/2013/12/131210-coldest-place-on-earth-antarctica-science/
Test
Hi Ed, I have enjoyed your views on climate science and especially critique on climate scare mongoring as driven by accolytes of IPCC and AGW.
However, your current so-called president is outrages in his tweets and his complete inability to understand climate science reality (NOT IPCC propaganda.) The way he behaves as an idiot with no manners.
Regarding the democratic candidate, he is not much better because of the New Green Deal, which as you mention will drive America’s energy policy down a terrible slope ending in calamity that will be difficult to save back to reality.
Best regards from Finland
truly yours
Boris Winterhalter, a climateskeptic ever since the establishment of the IPCC
Dear Boris,
Thank you for your comment. You are correct, of course, in what you wrote.
My objective in this post should be clear. My intention is to try to achieve the only hope I think we have to bring climate truth not just to America but to the free world.
If Biden wins, we will have no hope to bring the truth about climate to the people. Climate truth will be relegated to an underground intellectual pursuit while the dominant political world goes in the opposite direction.
If Trump wins – which I think will happen ONLY if he wakes up and promotes climate truth – then climate truth will prevail in the future. IPCC will be overturned. Schools, colleges, and universities will begin teaching real climate science.
In politics, I am not as concerned about the people as I am about the policies that they will pursue.
boris Winterhalter says: “However, your current so-called president is outrages in his tweets and his complete inability to understand climate science reality (NOT IPCC propaganda.) The way he behaves as an idiot with no manners”, President Trump seemed to have had great manners when he announced that he was withdrawing the US from the bogus Paris Climate Accord that Barack Hussein Obama, Joe Biden and John Kerry tried to saddle the nation with.
Was Boris Winterhalter happy when Finland entered into this bogus agreement on 14 December 2016? This is how the person who he claims has a, “complete inability to understand climate science reality (NOT IPCC propaganda.)” handled this bogus trash that was put together in Paris; “On 4 November 2019 the United States notified the depositary of its withdraw from the agreement, which will be effective 4 November 2020”.
We have gone so far left on everything that Trump was the best thing we could do and what do you have to say now about his mean tweets?
COVID-19 is awful. Climate change could be worse.
But there are lessons from the current crisis that should guide our response to the next one.
By Bill Gates
August 04, 2020
https://www.gatesnotes.com/Energy/Climate-and-COVID-19
If you want to read something that is nothing but unsubstantiated conjecture & whose chief aim is to drive the fear of the future into all people who seem to be as uninformed, or dishonest, as what Bill Gates is, then this garbage that Gates put together should be read to understand that what the world was able to get away with over COVID-19 set the stage for what to expect from this new manufactured crises, climate change.
Gates must not know that in the United States, due to the use of fossil fuels, that 2% of the population is able to raise enough food to feed the other 98% and have enough left to send to many other countries on the Earth. I imagine that what follows is of no interest to him, given his desire to remove fossil fuels from the Earth’s energy supply.
Carbon based energy is what has produced the economy that allows these anthropogenic climate change fools to waste their time involved in this libelous campaign against it. It has caused 2% of the population in the US to be able to feed the rest and it has also caused the life expectancy to increase:
It is kind of hard to know just what to believe, for the disciples of this hoax, anthropogenic climate change. I have a few questions for them. Just which period in the past would have qualified for Bill Gates’ climatic “utopia” since he believes that things are so bad now?
Would it have been before 1900 when the life expectancy for men was 46.3 and 48.1 for women in the US; by 1998 according to a Berkeley study, that had improved to 73.8 for men and 79.5 for women.
http://demog.berkeley.edu/~andrew/1918/figure2.html
According to another study in 1930 the life expectancy for both sexes was 59.7 years. and in 2010 it was 78.7 years.
http://www.infoplease.com/ipa/A0005148.html
There isn’t enough time between now and November, but you’re right, Climate Truth will be the biggest redpill of them all…but the forces aligned against this are incredibly strong, institutionalized, international….
Got to agree with Sergio G. One of the biggest Liberal is Micheal Moore, he produced one of the best documentaries called The Planet Of The Humans it exposes the GREEN movement . Solar and wind do not work certainly not without subsidies. Do you see it anywhere? NO. both blue and red have blocked it from national MEDIA. Why the truth hurts. Its all money related, that documentary in itself would destroy the LIBERAL LEFT. I read the reactions people have after watching and so many leftists are awakened so why MUTE IT?
thanks for the info. I watched Mike Moore’s planet of humans. thought provoking. Who or what started the anti “fossil fuel ” non-science? USA is much much more clean than 40 years ago.. no smog
The sad state of play regarding the federal government and the loss of confidence in those elected to “represent the public”:
https://youtu.be/BQPJa6q9CCg?t=11m57s
It’s a major source of support for Trump.
Hi Dr. Berry,
In Equation (2) of your preprint 3, you assume that the outflow of carbon from one reservoir to another is proportional to the total mass of carbon in the first reservoir. In particular, you assume the amount of CO2 flowing from the surface ocean to the atmosphere is proportional to total carbon mass in the surface ocean. This assumption is critical for your results, as it sets the e-time used in your model.
My question is, given that the vast majority of carbon in the surface ocean is not in the form of dissolved CO2, but rather in bicarbonate and carbonate ions, how is this assumption justified? Clearly not all forms of carbon influence the outflow of CO2. For example, adding diamonds into the ocean would not influence carbon outflow into the atmosphere.
Granted, there is a chemical equilibrium between bicarbonate, carbonate, and dissolved CO2. But this equilibrium is certainly not linear in total carbon content, as it is a buffer system. So it seems difficult to justify the assumption that CO2 outflow depends linearly on total carbon content.
Dear Tim,
Thank you for your comment.
Nature is complicated, even as your partial description indicates. However, when scientists attempt to describe nature, we must use simplifications that approximate nature. We start with the simplest explanations and progress to the more complex explanations.
But notice my objective. I use my carbon cycle model not to simulate nature but to simulate IPCC’s carbon cycle that IPCC says simulates nature. So, your question about justification should be addressed to the IPCC.
Then, I test my model against IPCC’s natural carbon cycle data. On that test, my model does an excellent job of replicating IPCC’s natural carbon cycle data. In fact, IPCC itself does not have a model that does a better job of matching its natural carbon cycle data.
Finally, recognize that according to Occam’s Razor, the simplest model wins until such time as data favors a more complicated model. As of today, IPCC’s natural carbon cycle data is the best such data that we have. So, as of today, my Equation (2) is the best hypothesis we have to simulate that data.
Dear Dr. Berry,
I appreciate your thoughtful response. Indeed, a model should strive to explain observations with as few extraneous assumptions as possible.
Your model in preprint 3 is based on the IPCC model in that you use their numbers for carbon reservoir content, and present-day carbon fluxes. However, these alone do not set e-times for carbon flows. That requires your additional assumption that carbon flows are directly proportional to total carbon content. While your model makes this assumption, the IPCC model does not. Because this assumption fixes the e-times (and thus all dynamics of the model), I am directing my question to you, not the IPCC. The IPCC uses very different e-times, and thus the model you examine in preprint 3 is not reflective of the IPCC model.
To the credit of the IPCC’s Bern model, it does reproduce the observed rise in atmospheric CO2 concentration, without invoking any unknown carbon sources or changing e-times.
Dear Tim,
You are correct that my Equation (2) is responsible for the e-times I calculate for the IPCC natural carbon cycle data. A different equation for the hypothesis would produce different e-times.
However, what assumption does the IPCC make? IPCC assumes its data for its natural carbon cycle will keep the atmosphere CO2 at 280 ppm. My Equation (2) does that.
My e-times for T21 = 5.5 years and T23 = 9.8 years are similar to IPCC’s time constants. So, I am not sure what you mean by “very different e-times.” Please explain.
I don’t see how the Bern model contributes anything to science. It does not have a physical hypothesis. It is a curve fit to IPCC’s Airborne Fraction which itself is based on the assumption that IPCC’s core theory is true.
Further, IPCC’s core theory is not a physical theory. It is merely a statement of a result of an undescribed cause.
The Bern model puts human carbon into 4 arbitrary bins, each with different e-times. That is not physics.
The Bern model calculates the change in its level at any given time as a function of its starting level, not the present levels in its bins. So, the Bern model is a function of history rather than present levels. That is not physical.
Finally, IPCC does not apply its Bern model to natural carbon. This conflicts with physics by treating carbon from the two sources differently.
Dear Dr. Berry,
In fact, your model is closely related to the Bern model, just in a different form. If your model is expressed as an impulse response (as a physicist you probably know it as a Green’s function), it looks identical to the Bern model with different numbers. Specifically, your model predicts that, for anthropogenic emissions e(t), the amount of airborne carbon f(t) is:
f(t) = integral_{-infinity}^{t} dt’ e(t’) [A0 + A1 e^-(t-t’)/T1 + A2 e^-(t-t’)/T2 + A3 e^-(t-t’)/T3]
with A0=0.113, A1=0.085, A2=0.121, A3=0.782 and T1=2.84, T2=6.67, and T3=94.9. If you try this, it will produce the same results as your model.
The advantage of this form is there is no need to keep track of the carbon in all four reservoirs. The cost is that you must keep track of when the emissions occurred. As you can see, the model is not really history dependent, this is just an artifact of the simpler impulse response form.
Also, the time constants of the Green’s function are not the same as the e-times. So you cannot directly compare your e-times to the time constants in the Bern model. Rather, the Ai and Ti coefficients are derived in a nontrivial way from the e-times.
In summary, the Bern model expresses the same physics as your model. The e-times in the Bern model, as best as I can gather, are based on observations and models of ocean circulation. At least this is true for newer IPCC carbon cycle models.
Finally, I would like to address your claim that the IPCC treats natural and anthropogenic carbon differently. In fact, you have the answer to this in your preprint 3 already: “However, if outflow (2) were a ‘strictly increasing function’ of level other than level to the power of one, then the Physics model would not apply independently and in total to human CO2 and natural CO2.” This is exactly what occurs. For example, the outflow of CO2 from the surface ocean is not directly proportional to the total mass of carbon. This is because carbon is partitioned between dissolved CO2, bicarbonate, and carbonate ions in a nonlinear way.
Dear Tim,
You comment may be the most useful comment on my website. Thank you very much for pointing out that the Bern model is a Green’s Function solution to a (so-far unknown) carbon cycle model equation.
Also, I tested your suggested numbers and found – after I switch your values for T1 and T3 – it makes the Bern curve of my Figure 10B almost match the curve for the Physics model … good enough for government work, as they say.
Therefore, I will be updating my previous descriptions of the Bern model accordingly.
Now we need to find the original differential equation used to produce the Bern model solution. The key is to find what assumptions went into that differential equation. I found several references that I will review before I comment further in this.
As a general comment, I prefer numerical solutions to differential equations over Green’s Function solutions for many reasons. But that is not what we are discussing here.
Finally, regarding your “finally,” let’s suppose we find a different equation to replace my linear hypothesis (2) in any of the six nodes. The only change I would need to make would be to calculate the human and natural carbon flows and levels together, rather than being able to calculate human and natural carbon flows and levels independently.
However, I do not see that your final paragraph proves the IPCC treats human and natural carbon the same. To treat them the same means to apply the Bern model solution equation to natural as well as human carbon. But it is clear from the Bern model solution equation that this was not done because if 15 percent of all natural carbon inflow stuck in the atmosphere forever, our CO2 level would be out of sight.
Dear Dr. Berry,
I’m glad you found my comment useful. I would also be interested to know how the time scales in the IPCC’s carbon cycle models are determined. I examined a few papers that looked promising, but I must confess I didn’t have time to understand the cited ocean circulation models.
My last comment mostly pertained to linear systems, and explained how the e-times in a linear model may not coincide with the time constants of the Green’s function.
Regarding the apparent different behavior of natural and anthropogenic carbon, I believe the following simple model will explain it. It is not exactly realistic, but it will demonstrate the relevant mathematics. Also this model will show, at least in principle, how the lifetime of CO2 concentration perturbations can differ from the lifetime of isotopic tracers like carbon-14. For both of these questions, the key is nonlinearity.
Consider a system containing a mass m of some substance (maybe CO2). There is a constant inflow of 1 kg/s. The outflow is O=-C m^2 (we will just write C=1, but really C=1 kg^-1 s^-1). Then
dm/dt = 1-m^2 (1)
Clearly an equilibrium is reached when 1-m^2=0. This occurs at the value m=meq=1 kg. Also, the outflow is equal to 1 kg/s. Thus at equilibrium the e-time for a given molecule to leave is (1 kg)/(1 kg/s)=1 s.
What happens if we add a small amount of mass x? We could solve the full nonlinear equation (1), but nonlinear equations are difficult and unintuitive. Instead we write m=meq+x and examine the outflow term, m^2. The outflow becomes O=-(meq+x)^2=-meq^2-2 meq x-x^2. We can ignore the term in x^2 because x is small — of course this is just a Taylor expansion. Then O~-meq^2-2 meq x. The differential equation becomes
d(m0+x)/dt = 1-meq^2-2 meq x=0-2 meq x
dx/dt = -2 meq x
dx/dt = -2 x
Notice that the equilibrium inflows and outflows canceled out, leaving just the added mass x. Now, this equation looks like a decay of x with e-time 0.5 s. Here is the key point: we already said that the e-time for a given molecule to leave is 1 s. However, if we add a small perturbation from equilibrium, that perturbation decays with a different e-time of 0.5 s. There are two different sorts of e-times at play here! This only occurs in a nonlinear system. In a linear system, the two e-times are the same.
This already gives intuition for why natural and anthropogenic carbon may appear to be treated differently in the Bern model. Natural carbon dominates the total flows of carbon, and the total flows set the e-time for individual molecules to move between reservoirs. These are the e-times you have calculated from Figure 3 in your preprint 3. The equilibrium is perturbed only when new carbon is added, which is done by humans. Such a perturbation decays back to equilibrium with a different e-time.
The point of this was to show that, for nonlinear flows, there are two types of e-times. The story becomes a little more complicated when we go from this simple one-reservoir model to the full, 4-reservoir model. Then we also have the decay times in the Green’s function, which are different still!
But sticking with the simple model, there is one more interesting conclusion. If we add a few molecules of isotopic tracer like carbon-14, the total mass will decay back to equilibrium with an e-time of 0.5 s. But if we keep track of a given tracer molecule, it will leave with an e-time of 1 s. That is why the lifetime of an isotopic perturbation can differ from the lifetime of the mass perturbation. I have thought of a nice way to formalize this, but the post is already quite long.
This is far from a realistic model of the carbon cycle — I don’t pretend to know exactly what the flow rates are, or to have modeled the nonlinearities well. I would also like to connect these mathematics to an intutive picture of real oceanic carbon flows, maybe in a later post. But I believe this shows the important effects which are added by any nonlinearity. I hope it was somewhat clear.
Small typo: A0=0.0113 for your model.
Dear Dr. Berry,
I went back and checked my code to find the cause of the disparity you mentioned between the Green’s function solution and your numerical calculation. After fixing an error these are the proper coefficients for the Green’s function:
f(t) = integral_{-infinity}^{t} dt’ e(t’) [A0 + A1 e^-(t-t’)/T1 + A2 e^-(t-t’)/T2 + A3 e^-(t-t’)/T3]
A0=0.014, A1=0.758, A2=0.122, A3=0.106 and T1=2.84, T2=6.67, and T3=94.9
I would be very interested to know if you find a satisfactory explanation for the time scales in the IPCC’s carbon cycle models. It would be a great help to have a resource which translates the IPCC’s explanations into the simplest possible models, using the mathematical tools of physics.
“The equilibrium is perturbed only when new carbon is added, which is done by humans. Such a perturbation decays back to equilibrium with a different e-time.”
Your math is way beyond me but I have to question this statement in light of what I just read over on Thongchai Thailand (https://tambonthongchai.com/2020/09/23/emission-reduction-atmospheric-co2/ ). If the anthropogenic CO2 is too small to show with the uncertainty involved can it be considered “new”?
The so-call “e time” is determined by removal processes, which are entirely natural. Those processes have no way to distinguish between CO2 that was emitted by humans and CO2 that was emitted by countless natural sources.
A holy e time for humans, which the IPCC requires to make human CO2 artificially large, is an IPCC fantasy.
After carefully studying this issue of the trace gas, CO₂, that is 1.6 times heavier that the rest of the atmosphere, and whether or not it has an effect on the Earth’s temperature, I have concluded that it does not have any bearing, at all, on something that is at best difficult to measure, the Earths’ temperature. This idea of a greenhouse effect was put forth by a very intelligent scientist, John Tyndall in 1859. “Tyndall concluded that water vapour is the strongest absorber of heat in the atmosphere and is the principal gas controlling surface air temperature by inhibiting leakage of the Earth’s heat back into outer space. He declared that, without water vapour, the Earth’s surface would be ‘held fast in the iron grip of frost’ – the greenhouse effect”. That was great for when Tyndall discovered that CO₂ & H₂O were what he concluded to be gases capable of absorbing heat radiation and therefore able to ‘trap’ heat from exiting the Earth. The question regarding this hypotheses is; what has anyone ever been able to ‘trap’ with a gas?
There is no greenhouse effect caused by CO₂. The Earth is warmed due to the pressure of the gases in its atmosphere that is reflected in how much mercury that pressure will displace, which amounts to the barometric pressure at various altitudes and that is directly reflected in the temperature range at that altitude. I know much about this relationship between altitude and temperature from having went over the 17,769 ft Tharong-La pass on the Annapurna circuit in Nepal and also on my hike to Everest Base camp in Nepal & also when on Kilimanjaro in Tanzania. We have alarmist maintaining that; “This research has improved our understanding of how much the world will eventually warm if the carbon dioxide in the atmosphere is maintained at double the level of pre-industrial times”. Plus this nonsense; “There is much greater certainty that, if left unchecked, global warming would be high enough to bring very severe impacts and risks worldwide”, when, in fact, there is no evidence that CO₂ has anything to do with the Earth’s temperature or its climate. I enjoy seeing what other fable that someone who is so illogical and gullible to believe that the trace gas, CO₂, that is only .03-.04% of the total atmosphere of the Earth has the unbelievable ability to now do to the planet since it became a tool of the unscrupulous people to use to try to control the citizens of the world. In today’s world, who controls the energy controls the world’s population.
Altitude Above Sea Level Temperature Barometer In. Hg. Abs. Atmospheric Pressure
500 feet 57⁰F 14⁰C 29.38 17.48 PSI
15,000 feet 6⁰F -14⁰C 16.89 8.29 PSI
https://www.sablesys.com/support/technical-library/barometric-pressure-vs-altitude-table/
This You Tube presents a great visual example of just how much force, due to its weight, the atmosphere can have on a very substantial vessel, such as a railroad tank car.
Vacuum Implosion
https://www.youtube.com/watch?v=VS6IckF1CM0
Greenhouse Effect is Invalidated
https://www.youtube.com/watch?v=WfuafZbpyII
This link seems to not function like it should in this post I presented September 12, 2020 at 5:50 am.
Altitude Above Sea Level Temperature Barometer In. Hg. Abs. Atmospheric Pressure
500 feet 57⁰F 14⁰C 29.38 17.48 PSI
15,000 feet 6⁰F -14⁰C 16.89 8.29 PSI
https://www.sablesys.com/support/technical-library/barometric-pressure-vs-altitude-table/
This link shows what I intended to present.
https://www.avs.org/AVS/files/c7/c7edaedb-95b2-438f-adfb-36de54f87b9e.pdf
On September 10, 2020 at 10:16 am Dr. Ed said: “Nature is complicated, even as your partial description indicates. However, when scientists attempt to describe nature, we must use simplifications that approximate nature. We start with the simplest explanations and progress to the more complex explanations” and all of what Dr. Ed stated is true; but, what happens when untrained politicians attempt to deal with something that they know nothing about, the Earth’s climate and its temperature?
On September 12, 2020, 10:19 AM, this person that all people who are intelligent and are able to look at this issue in a logical manner would never think of buying a used car from, California Gov. Gavin Newsom, who had this observation about the fires burning in his mismanaged state.
SACRAMENTO, Calif. — California Gov. Newsom offered some of his most impassioned comments on climate change, denouncing the “ideological BS” of those who deny the danger and vowing Friday to accelerate the state’s already ambitious goals for reducing greenhouse gases.
Newsom spoke against a backdrop of ghost-like trees and ground covered in snow-like gray ash left by the deadliest of the record-breaking fires that have charred huge swaths of California in recent weeks.
“The data is self-evident, the experience that we have in the state of California just underscoring the reality of the ravages of climate change,” he said. “Mother Nature is physics, biology and chemistry. She bats last and she bats one thousand. That’s the reality we’re facing, the smash mouth reality — this perfect storm. The debate is over around climate change.”
https://abcnews.go.com/US/wireStory/amid-ashes-california-governor-fires-climate-change-72962966
At another opportunity to show his ignorance, Newsom made these comments.
“Newsom called these examples of how the state has been hit by the “smash mouth of reality.”
“The debate is over in terms of climate change,” said Newsom. “If you don’t believe that, just come to the state of California.”
As a result the governor announced, “We’re gonna have to fast-track our efforts in terms of meeting our [clean energy] goals much sooner.” He said he has asked key administration officials to “go down that list [of climate change initiatives] and to dust off our current processes and accelerate them across the board.”
Key among these would be to “adapt strategies to get more electric vehicles out on the street.” The state’s current goal of getting to 100% clean energy by midcentury will be “too late,” he said.
For those who worry about the economic consequences of such initiatives, “just ask the people here in Butte County,” Newsom said, noting it cost “$2 billion just to clean up the debris of the Camp Fire” in 2018.
“You want to know the cheapest way to deal with this?” asked the Governor. “It is to accelerate our low carbon strategies.”
https://deadline.com/2020/09/frustrated-california-governor-gavin-newsom-surveys-fire-zone-rips-ideological-bs-around-climate-change-absence-of-national-leadership-1234575502/
On September 12, 2020, 10:19 AM when Newsom was blabbering this nonsense out;
“The data is self-evident, the experience that we have in the state of California just underscoring the reality of the ravages of climate change,” he said. “Mother Nature is physics, biology and chemistry. She bats last and she bats one thousand. That’s the reality we’re facing, the smash mouth reality — this perfect storm. The debate is over around climate change.”, this was happening in an area to the east of his failed state:
SEPTEMBER 10, 2020 “In addition to the cold, many regions also received their most-ever snowfall this early in the season: seventeen inches of global warming goodness fell in Wyoming, New Mexico saw its earliest flakes on record, and parts of Colorado suffered their earliest snowfall in decades—these are just a few of the astonishing weather reports coming out of a record-setting September week.
Rapid City, SD, set a U.S. record for the fastest turnaround between 100 degree temperatures and measurable snow, after it hit 102 degrees on Saturday, only to then see an inch of snow on Monday. This two-day gap broke the record for shortest amount of time between those two weather observations — the previous record being Ardmore, SD, in Sept 1929 when a similar event took place over the course of approximately three days”.
https://electroverse.net/just-count-the-cold-records-that-have-fallen-over-the-past-24hrs/
This causes me to wonder just where, and how, does this CO₂ caused anthropogenic climate change is able to determine where to draw the line between warm temperatures and fires on the West coast and 17 inches of snow in parts of Wyoming?
California Gov. Gavin Newsom, without any evidence, as usual, blabbers this falsehood out for all to see how ignorant he is.
“Newsom called these examples of how the state has been hit by the “smash mouth of reality.”
“The debate is over in terms of climate change,” said Newsom. “If you don’t believe that, just come to the state of California.”
As a result the governor announced, “We’re gonna have to fast-track our efforts in terms of meeting our [clean energy] goals much sooner.” He said he has asked key administration officials to “go down that list [of climate change initiatives] and to dust off our current processes and accelerate them across the board.”
Key among these would be to “adapt strategies to get more electric vehicles out on the street.” The state’s current goal of getting to 100% clean energy by midcentury will be “too late,” he said”.
After I have read the dire warnings of the anthropogenic climate change folks, such as the ones below, I certainly do not think that I can take any of their predictions about the future of the climate as even remotely accurate and not based on an agenda to promote this global warming nonsense to gain money from propagating this hoax.
Below are a few examples of them predicting a 1000 drought for the United States.
“Worst Drought in 1,000 Years Predicted for American West
Global warming to cause historic “megadrought” by century’s end. FEBRUARY 12, 2015
Large parts of the U.S. are in for a drought of epic proportions in the second half of this century, scientists warn in a new study that provides the highest degree of certainty yet on the impact of global warming on water supplies in the region.”
http://news.nationalgeographic.com/news/2015/02/150212-megadrought-southwest-water-climate-environment/
California’s Drought May Be Worst in a Millennium
The record in trees suggests this drought is the worst to hit the Golden State in as much as 1,200 years December 5, 2014
https://www.scientificamerican.com/article/california-s-drought-may-be-worst-in-a-millennium/
Remember how they have predicted how the polar ice caps are melting and the sea level will increase by 100′ by the end of the century? This actual graph seems to show what a bunch of nonsense that little lie is.
9451600 Sitka, Alaska
http://tidesandcurrents.noaa.gov/sltrends/sltrends_station.shtml?stnid=9451600
The thousand year drought didn’t seem to last even three years; but, we will never see these charlatans ever mention all of their false, invalid predictions since this below is how the never ending drought situation in California played out in real time.
Northern California Could See Worst Flooding in 10 Years as State Braces for Major Storm This Weekend
JANUARY 6, 2017
http://ktla.com/2017/01/06/northern-california-could-see-worst-flooding-in-10-years-as-state-braces-for-major-storm-this-weekend/
At least 4 dead as fierce Southern California storm causes flash floods Feb 18, 2017
The massive Pacific storm swept into Southern California on Friday morning, bringing torrential rain and gusting winds to the region while also spreading precipitation north into the San Joaquin Valley and up to San Francisco.
Flash flood watches were in effect for Los Angeles, Ventura and Santa Barbara counties from Friday morning through Saturday morning. Forecasters said the weather system could be the strongest to pelt the region in years, if not decades.
http://abcnews.go.com/US/dead-flash-flooding-southern-california-storm/story?id=45578645
Once in a while the agencies charged with telling the tax payers what is going on with the climate get caught up telling the truth. Can we ever imagine that the day will come when California Gov. Gavin Newsom will be found to have actually discovered out one thing about the earth’s climate that is not a lie?
NASA Study Finds 1934 Had Worst Drought of Last Thousand Years
October 14, 2014
“It was the worst by a large margin, falling pretty far outside the normal range of variability that we see in the record,” said climate scientist Ben Cook at NASA’s Goddard Institute for Space Studies in New York. Cook is lead author of the study, which will publish in the Oct. 17 edition of Geophysical Research Letters.
https://www.nasa.gov/content/goddard/1934-had-worst-drought-of-last-thousand-years/
National Geographic & California Gov. Gavin Newsom, who has no idea about the basics of the Earth’s climate if he is stupid enough to believe that carbon dioxide causes it to acts like it does, need to make sure that they understand how nature works before waving the red flags of the anthropogenic global warming crowd whose cult they seem to have joined.
OROVILLE Note the date.
February 11, 2017 05:24 AM
Water began pouring over the emergency spillway at Oroville Dam early Saturday for the first time in its 48-year history. State officials continued to say they don’t expect the situation to result in flooding in Oroville or other communities downstream.
http://www.sacbee.com/news/local/article132154774.html
While CA politicians worried about climate change, they sat and did nothing to make sure that Oroville Dam was sound and functional.
Oroville Dam: What made the spillway collapse?
https://www.mercurynews.com/2017/02/17/oroville-dam-what-made-the-spillway-collapse/
This actual scientist, who also won the Nobel Prize, Ivar Giaever, does not agree with the hoax that dishonest alarmist politicians are promoting.
“In his resignation note, Giaever wrote: In the APS, it is ok to discuss whether the mass of the proton changes over time and how a multi-universe behaves, but the evidence of global warming is incontrovertible?
The claim (how can you measure the average temperature of the whole earth for a whole year?) is that the temperature has changed from ~288.0 to ~288.8 degree Kelvin in about 150 years, which (if true) means to me is that the temperature has been amazingly stable, and both human health and happiness have definitely improved in this ‘warming’ period.”
Dear all,
Thank you all for your comments. The reason I have not participated recently is because I am trying to finish my book as soon as I can, and that takes all my focus. I will be back when I have finished my book.