by Edwin X Berry, PhD, Theoretical Physics, CCM
Ed Berry LLC, Bigfork, Montana
To read key referenced papers:
- CO2 Coalition paper
- Dia Ato paper
- Bernard Robbins paper
- Eike Roth paper
Click here
Responsiveness of Atmospheric CO2 to Fossil Fuel Emissins
by Jamal Munshi
Ferdinand Engelbeen says Jamal Munshi has not proved absence of correlation.
What do you think? Add your comment below.
A Thermal Acid Calcification Cause for Seasonal Oscillations in the Increasing Keeling Curve
Download this Excel file here: https://edberry.com/Excel-File
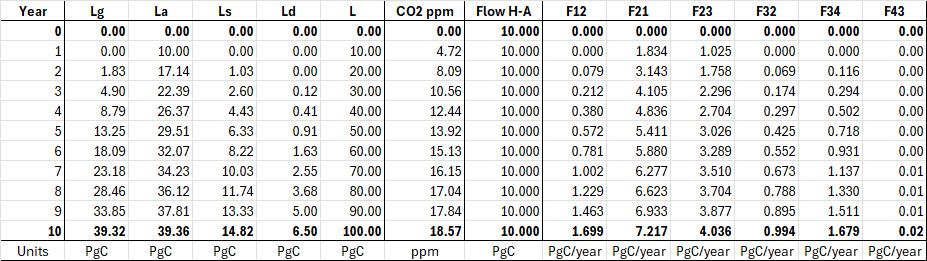
Here is table “Berry Carbon Flow Test” for discussion in our comments.
I request Ferdinand and anyone else who is contesting my calcuations to present your calculations for comparison.
We assume that the natural carbon cycle is at constant levels as shown in Figure 3.
With that information, we insert human carbon into the atmosphere at a constant rate of 10 PgC per year. Then we calculate annual time steps to see how much human carbon ends up in each reservoir each year.
This simple calculation is a way to compare our calculations because we keep human carbon inflow constant for each year.
The years run from zero to ten. All the L data are in PgC, and flow data are in PgC/Year.
Lg = land, La = atmosphere, Ls = surface ocean, Ld = deep ocean, L is the total PgC in the carbon cycle for each year. Ntice L increases by 10 PgC each year.
The CO2 ppm column simply converts the PgC in La to ppm.
Here’s how it works.
Year 0: 10 PgC is added to La, but you don’t see it until the beginning of Year 1.
Year 1: the 10 PgC in La produces outflows to Lg and Ls. We see the result in Year 2.
Year 2: the outflows from La have moved some carbon to Lg and Ls. Etc.
Notice that as La gets more PgC, its Outflow to Lg and Ls increase, etc.
While La increased by 7.14 PgC from Year 1 to Year 2, it increased by only 1.49 PgC from Year 9 to Year 10.
Also notice that as Lg and Ls get more carbon, they send carbon back to La.
Adjustment, Residence, E-time Compared
IPCC’s response times fail physics
Physics e-time has a precise definition. The IPCC times do not. In summary:
- Physics: e-time is the time for the level to move (1 – 1/e) of the distance to its balance level.
- IPCC: adjustment time is the time for the level to “substantially recover” from a perturbation.
- IPCC: residence time is the average time a CO2 molecule stays in the atmosphere.
IPCC defines “adjustment time (Ta)” as:
The time-scale characterising the decay of an instantaneous pulse input into the reservoir.
Cawley defines “adjustment time (Ta)” as:
The time taken for the atmospheric CO2 concentration to substantially recover towards its original concentration following a perturbation.
The word “substantially” is imprecise.
Cawley follows IPCC to define “residence time (Tr)” as:
The average length of time a molecule of CO2 remains in the atmosphere before being taken up by the oceans or terrestrial biosphere.
In summary, IPCC uses two different response times where it should use only e-time:
- When the level is far from its balance level (which can be zero), IPCC thinks e-time is an adjustment time because the level is moving rapidly toward its balance level.
- When the level is close to its balance level, IPCC thinks e-time is a residence time because “molecules” are flowing in and out with little change in level.
Figure A illustrates how e-time relates to IPCC’s adjustment and residence times.
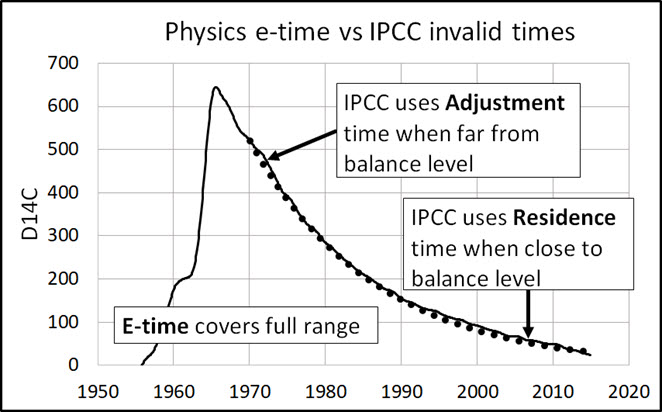
Figure A. E-time covers the full range of movement of level to a balance level. IPCC adjustment and residence times apply to only each end of the range.
IPCC, 2001: Working Group 1: The scientific basis. Appendix 1 – Glossary.
Lifetime
Lifetime is a general term used for various time-scales characterising the rate of processes affecting the concentration of trace gases. The following lifetimes may be distinguished:
Turnover time (T) is the ratio of the mass M of a reservoir (e.g., a gaseous compound in the atmosphere) and the total rate of removal S from the reservoir: T = M/S. For each removal process separate turnover times can be defined.
Adjustment time or response time (Ta) is the time-scale characterising the decay of an instantaneous pulse input into the reservoir. The term adjustment time is also used to characterise the adjustment of the mass of a reservoir following a step change in the source strength.
Half-life or decay constant is used to quantify a first-order exponential decay process.
The term lifetime is sometimes used, for simplicity, as a surrogate for adjustment time.
In simple cases, where the global removal of the compound is directly proportional to the total mass of the reservoir, the adjustment time equals the turnover time: T = Ta.
In more complicated cases, where several reservoirs are involved or where the removal is not proportional to the total mass, the equality T = Ta no longer holds.
→Carbon dioxide (CO2) is an extreme example. Its turnover time is only about 4 years because of the rapid exchange between atmosphere and the ocean and terrestrial biota.
However, a large part of that CO2 is returned to the atmosphere within a few years.
Thus, the adjustment time of CO2 in the atmosphere is actually determined by the rate of removal of carbon from the surface layer of the oceans into its deeper layers.
Although an approximate value of 100 years may be given for the adjustment time of CO2 in the atmosphere, the actual adjustment is faster initially and slower later on.
DMA, July 22, 2025 at 1:42 pm
That paper is discussed out at WUWT:
https://wattsupwiththat.com/2025/06/25/under-reported-old-carbon-is-not-the-source-of-increases-in-atmospheric-co2/
Ferdinand Engelbeen July 22, 2025 at 2:25 pm
Dear Ferdinand,
Your WUWT paper does not discuss this article that DMA referenced:
https://climatediscussionnexus.com/2025/07/16/matthew-wielicki-on-co2-isotopes/
Also, your WUWT paper does not dicuss these:
https://scitechdaily.com/scientists-were-wrong-plants-absorb-31-more-co2-than-previously-thought/
https://www.nature.com/articles/s41586-025-09023-w
https://www.nature.com/articles/s41561-024-01476-4?fromPaywallRec=false
Dr. Ed, July 22, 2025 at 12:56 pm
According to Munshi:
“A key relationship in the theory of anthropogenic global warming (AGW) is that between annual fossil
fuel emissions and annual changes in atmospheric CO2. The proposed causation sequence is that
annual fossil fuel emissions cause annual changes in atmospheric CO2 which in turn intensifies the atmosphere’s heat trapping property.”
Most of my statistics knowledge is from 60 years ago, but someone who writes that annual (!) emissions must correlate with annual (!) changes in atmospheric CO2 must never have heard of noise around a trend.
This is really stupid. 98% of the correlation between the variability of maximum 2 ppmv around a trend of over 100 ppmv is caused by temperature variability, but temperature gives less than 10 ppmv increase in the atmosphere from warming ocean surfaces since 1958 and zero trend in the derivatives. Temperature is responsible for all the temporal (2-3 years) variability, but not responsible for the bulk of the CO2 increase in the atmosphere…
Here the response for the trends since 1960 with temperature:
https://www.ferdinand-engelbeen.be/klimaat/klim_img/temp_co2_1960_2012.jpg
Compare that with the response to summed FF emissions:
https://www.ferdinand-engelbeen.be/klimaat/klim_img/acc_co2_1960_cur.jpg
Or since 1900 from ice cores – firn – MLO and FF emissions:
https://www.ferdinand-engelbeen.be/klimaat/klim_img/acc_co2_1900_1911.png
But of course there is no correlation between FF emissions and increase of CO2 in the atmosphere, according to a professional statistician.
Case closed.
Dr. Ed, July 22, 2025 at 3:05 pm
The second paper in following:
https://climatediscussionnexus.com/2025/07/16/matthew-wielicki-on-co2-isotopes/
is what is discussed at WUWT
And the text contains a grave error:
“devoid of 14C and depleted in 13C”
The “devoid of 14C” is right, “depleted in 13C” is just the opposite:
Most is carbonate rock at near zero δ13C. After dissolution in river water and release in the atmosphere, it is at about -6.5 per mil δ13C and still higher in δ13C than the current atmosphere at -8.2 per mil δ13C…
One can see these two as a positive feedback for the human influence on the isotopic changes for 14C and a negative feedback for δ13C.
Then the second of your references only shows that the human emissions probably were larger than estimated too: if the sinks in pants are greater than expected and the net sinks remains the same, then the sources also are underestimated…
The third reference again is the article discussed at WUWT
The fourth reference is about old 14C depleted carbon, which figures were used in the third reference.
In general: all these new findings are from CO2 flows that are already going on for thousands to many millions of years. These are already in the “basic” CO2 (isotopic) fluxes and only substantially changed when the natural environment changed.
For the 14C level that changed only with solar activity in very small steps over the past 60,000 years.
The 13C/12C ratio changed only with -6.5 +/- 0.4 per mil δ13C over the past 800,000 years
The 14C level dropped together with fossil fuel use, so that correction tables were needed for radiocarbon dating from 1870 on.
The 13C/12C ratio dropped to below -8.2 per mil in the atmosphere and similar in the ocean surface since 1850 in complete ratio to FF emissions.
It would be very remarkable that something in nature would mimic FF emissions in exact ratio and time…
Ferdinand Engelbeen
July 22, 2025 at 3:08 pm
You won’t understand Munshi’s work if you stop your study of it at making fun of what you mistakenly expected it to say. Briefly his work shows there is no correlation between the rate of change of FF emissions and the rate of change of temps proving that the correlations you demonstrate are spurious and no more meaningful that the correlation of FF emissions and shark attacks on nurses.
Dear Uncle Bert.
“if you can’t make a distinction between data as they are observed and the interpretation of these data, then we can’t have a real discussion about the data”
It is impossible to have a real discussion with you about anything. The data is the data. If that disagrees with your world view then. IYO, that data must be interpreted in a way that agrees with your world view. You start with an answer then devise specious constructs that agree with your answer.
“In several stations one has plotted the colorometric pH measurements and the calculated measurements together. That is the case for e.g. ALOHA (Hawaii) station”
Your reference once again used pseudoscience in the title. Can’t you produce real references from real scientists?
Your Figure 1 is a cherry picked short timeline of 18 years to show your confirmation bias, There are large gaps in the real measurements which were all from the DIC. That’s not the same as the oceans.
pCO2 is not concentration and it is misleading to use it to try and show atmospheric CO2 is being absorbed in the ocean. The DIC is different from the ocean. The d13C isotopic ratio for the DIC is -.5 to +2.0 per mil. The oceans are -10 per mil.
“CO2 dissolving in the oceans lowers its pH”
Where is your experimental data?
Warming oceans lowers the pH.
“the extra uptake by vegetation after Pinatubo, thanks to scattered sunlight, was much stronger than by the oceans”
You really are full of it aren’t you. As far as you’re concerned vegetation is the only thing that absorbs CO2 and you avoid the oceans like the plague. The oceans are a real inconvenient truth aren’t they? The oceans are far and away the largest emitter and absorber of CO2.That’s an inconvenient truth for you.
“DIC is simply the sum of dissolved CO2 + bicarbonates + carbonates”
The DIC is dissolved inorganic carbon. That is different from dissolved organic carbon which is different again from the oceans.
“give me the data where the CO2 levels in the atmosphere dropped, besides the “normal” drop in the NH spring/summer”
Perhaps you should read Bromley and Tamarkin’s paper.
Their experiment demonstrated that nature’s measured impulse absorbed 239 times the human-produced CO2 impulse. To be specific, this is the specific impulse calculation of CO2 that was removed from the atmosphere in 2 years after Pinatubo. Their experiment demonstrated that nature is controlling CO2 concentrations, not humans.
This comment will generate yet another page of specious waffle which is endless. I don’t have time to wade through all your nonsense, I have a life to live. This dialog started with me responding to David Andrews. He has either asked you to reply because he lacked the knowledge himself, or you have just barged in. Socialist political activists are 24/7 devoted to their cause. Normal people have lives to live.
Ferdinand Engelbeen
July 21, 2025 at 2:49 pm
In response to Stephen, you asked, “…if the increase is partly natural [emissions], and part of the FF [emissions] increases the total carbon mass in other compartments, where does that extra CO2 in the atmosphere comes from?”
It’s a seminal question. If natural emissions have not remained roughly the same as in preindustrial times, then what changed to introduce the extra carbon, other than FF emissions? I previously suggested some increase was caused by the expanding population which continues to plow fields, cut down trees, and dig holes to build homes and bury garbage. The other likely increase comes from the deep ocean mixing with the warmer surface. In addition to being warmer than 300 years ago, the CO2 content may be greater than what is being sinked these days.
Your math, your model, and your mind set is committed to defending your position which depends on no biosphere expansion other than what results from sinking FF carbon. What does your math and model predict, if FF continues to add 10 Pg/year and the natural emissions continue with a constant 200 Pg/year? What will the subsequent CO2 concentration be in twenty years? And what will the increase from the previous year be?
Ferdinand,
Dr. Ed is not required to explain why natural CO2 is increasing to falsify the human-caused CO2 theory. He isn’t one to guess. That’s not how science works. Maybe if all the money that had been spent supporting this fraudulent science had been spent toward objective research, then maybe we would know the answer. One thing I will say is that nothing about this world is constant other than nature constantly varies. So the idea that Mother Nature was in perfect balance at 280ppm doesn’t make much sense.
To Everyone,
I added a new paper by IvanR. Kennedy, John Runcie, Angus N. Crossan, Raymond Ritchie, and Jennifer Marohasy.
It is now the third PDF file above.
Their paper offers a new unique alterative hypthesis to explain how nature may increase the CO2 level.
In an ongoing email conversation, Gregory R. Wrightstone, Executive Director, CO2 Coalition, wrote to Jennifer Marohasy about this paper:
“If we accept all that you have just provided, you must explain why and how this abiogenic CO2 source suddenly began increasing and continues to increase. This is contrary to how geologic processes work. Increases or decreases to any mantle-derived CO2 or CO2 from weathering would occur over much larger time scales.
And the increase just happens to mirror human emissions.”
Jim,
“What makes you think that the FF emissions make a “relatively minor” contribution to CO2 growth compared to natural emissions? Is it the present composition of the atmosphere, or is it the ~20x larger gross number, or is it something else?”
You were fooled by the present composition of the atmosphere, weren’t you. Just like Mr. Ed.
DMA, July 22, 2025 at 4:00 pm
Even in my rusted knowledge of statistics, I remember that one need to be aware of spurious correlations between variables that have a similar trend. That is the reason that in many cases the correlations are taken from de-trended data.
That goes good in many cases, but fails completely, if the bulk of the trend is caused by a variable with hardly any variability and a huge trend. As is the case for human emissions and the increase in the atmosphere.
In the case of the increase in the atmosphere, indeed the variability in rate of change is fully caused by the variability in rate of change of temperature. But we know from the formula of Takahashi for the influence of temperature on the ocean surface pCO2 per Henry’s law, that the pCO2(aq) increased with less than 10 μatm, while the observed increase is 100 μatm and the supply of FF by humans some 170 μatm over the same period.
So the question then is if the extreme good correlation between FF emissions and increase in the atmosphere is plausible or not and if another (known or unknown) cause may be involved.
As FF emissions are 1.7 times the observed increase in the atmosphere, there is a huge possibility that they are the cause of the increase, simply based on the carbon mass balance.
The two other main probable sources, oceans and biosphere, are proven net sinks for CO2, thus can’t be the cause of the increase and all other known sources are either too small or too slow.
Remains some unknown sources as recently the discovery of extra 14C-free CO2 releases from rivers.
The point is that such releases are already going on for millennia (like coal seam fires) to as long as the earth has liquid water and some solid land. These CO2 emissions, including their 14C and δ13C “fingerprints” are already included in the pre-industrial CO2 levels and isotopic compositions.
Only if they changed completely in parallel with human emissions, then they are of interest, which is partly the case for the river emissions, where they act as a feedback to the human caused increase in the atmosphere.
What I don’t accept of Munshi is that he only looked at yearly (!) variability, that is looking at the noise around de-trended data and then concluding that there is no correlation, implying that there is no correlation between the trends.
If he had looked at e.g. 5 year intervals (or 5 year moving averages), he would have seen that the effect just fades away and only leaves a very small trend for temperature.
Brendan Godwin, July 22, 2025 at 5:19 pm
Brendan, I am only interested in the data, no matter who did measure them or the titles they use to describe them.
“Your reference once again used pseudoscience in the title. Can’t you produce real references from real scientists?”
Thus if you don’t like the title, then the data are pseudoscience?
And again, they don’t measure the pH of DIC, they measure the pH of seawater, even as it passes continuously from the intake of (commercial) sea ships, fully automatically:
https://www.mdpi.com/1424-8220/18/8/2622
“pCO2 is not concentration and it is misleading to use it to try and show atmospheric CO2 is being absorbed in the ocean. The DIC is different from the ocean. The d13C isotopic ratio for the DIC is -.5 to +2.0 per mil. The oceans are -10 per mil.”
Brendan, this only shows that you have not the slightest knowledge of ocean chemistry…
The deep oceans are near zero per mil δ13C and ocean surface between +1 and +5 per mil δ13C and carbonate rocks (dropped by coccoliths out of DIC) also are near zero per mil.
It is at the ocean-atmosphere border that δ13C changes dramatically with -10 per mil δ13C from ocean water to air and -2 per mil from air into ocean waters. Net change -8 per mil δ13C if both flows are in equilibrium.
Or a near constant -6.5 +/- 0.4 per mil δ13C over the past 800,000 years in the atmosphere:
https://www.ferdinand-engelbeen.be/klimaat/klim_img/co2_d13C_lgm_cur.png
And a near constant +4.95 +/- 0.2 per mil δ13C over the past 600 years in coralline sponges (~DIC):
https://www.ferdinand-engelbeen.be/klimaat/klim_img/sponges.gif
Until humans started their significant use FF from 1850 on.
“As far as you’re concerned vegetation is the only thing that absorbs CO2 and you avoid the oceans like the plague”
I only look at what the data say:
On short term vegetation is dominant:
Seasonally: -5 ppmv/°C (negative!)
Year-by-year: 3.5 ppmv/°C (positive)
Long term, the oceans are dominant: 4.2%/°C (both directions)
“Their experiment demonstrated that nature’s measured impulse absorbed 239 times the human-produced CO2 impulse.”
I have read their paper and did see Figure 11, which contradicts what they say in the same paper.
Ans 239 times the the human CO2 impulse during a few days has an immeasurable effect on the CO2 increase in the atmosphere…
Bye bye (as long as it lasts)
Dr. Ed, July 22, 2025 at 8:44 pm
Besides what Gregory Wrightstone writes, several items in that paper just don’t add up.
From the abstract:
“Our findings reveal that warming waters absorb atmospheric CO2 by promoting calcium carbonate formation, acidifying seawater and boosting CO₂ release to the atmosphere in late autumn and winter, when atmospheric CO₂ becomes highest”
As far as I know, seawater gets warmer in spring/summer, releasing some 50 PgC CO2 in a few months. Reverse in fall/winter. Kennedy’s findings just do the opposite…
Then we have the oxygen balance: this new find doesn’t involve any interaction with oxygen. Only biological processes do involve huge O2 changes and these show that the biosphere is the main cause of the decrease of CO2 in the atmosphere in spring/summer and increase in fall/winter.
Processes like found by Kennedy et al. only can have a very small influence.
https://www.ferdinand-engelbeen.be/klimaat/klim_img/bender_dO2.jpg
The measurements at Barrow give the clearest indication of the seasonal changes in CO2 and O2
And last, but not least, one can never deduce a long term trend from the variability within a year or a few years, until the trend is significantly larger than the noise…
Stephen P Anderson, July 22, 2025 at 8:42 pm
“Dr. Ed is not required to explain why natural CO2 is increasing to falsify the human-caused CO2 theory. He isn’t one to guess. That’s not how science works. ”
No, but he must explain as a scientist how an increase of CO2 of about half the FF emissions in the oceans and biosphere can have increased any CO2 in the atmosphere, as his model only allows for a (small) part of the increase due to human FF emissions. That is while the CO2 sinks in both oceans and biosphere exceed sources from the same reservoirs. His carbon mass balance doesn’t fit the observed increase in the atmosphere…
“Maybe if all the money that had been spent supporting this fraudulent science had been spent toward objective research, then maybe we would know the answer.”
Still most of all field research is of high quality, but the interpretation of the data is manipulated by a small group of “scientists” with an agenda…
“One thing I will say is that nothing about this world is constant other than nature constantly varies. So the idea that Mother Nature was in perfect balance at 280ppm doesn’t make much sense.”
Nobody says that Nature is constant: for the current SST, the CO2 in the atmosphere should be around 295 ppmv. Only that the change in CO2 ánd isotopic composition nowadays is much faster than in the far past, up to at least 800,000 years (ice cores) or several millions of years (foramins).
Jim Siverly, July 22, 2025 at 7:22 pm
“What does your math and model predict, if FF continues to add 10 Pg/year and the natural emissions continue with a constant 200 Pg/year? What will the subsequent CO2 concentration be in twenty years? And what will the increase from the previous year be?”
The Excel sheet with the calculations for all 20 years is here:
https://www.ferdinand-engelbeen.be/klimaat/klim_xls/Jim_fluxes.xlsx
Starting conditions:
905 PgC in the atmosphere, 200 PgC/year cycling in and out (only natural), 628 PgC equilibrium in the atmosphere for the current SST and 50 years Te for net removal.
Assumption: cycles increase in ratio with the increase in the atmosphere (as mix of natural + FF) . Natural remains 200 PgC, difference is FF “caused”, but does not indicate the ratio of FF/natural within the cycle.
Several starting conditions can be changed, including a small increment per year in the FF emissions.
The calculations are based on a fixed equilibrium and a fixed Te. I still am working on a “floating” equilibrium and the full database since 1850…
Results:
Year 0:
Atmosphere: 905 PgC
In: 200 PgC + 10 PgC = 210 PgC
Atmosphere: 915 PgC (temporarily)
Net out: (915 – 628) / 50 = 5.7 PgC
Out: 210.0 – 5.7 = 204.3 PgC
Atmosphere: 909.3 PgC
Increase in atmosphere: 4.3 PgC
Year 1:
Atmosphere: 909.3 PgC
In: 200.9 + 10 PgC = 210.9 PgC
Atmosphere: 919.3 PgC (temporarily)
Net out: (919.3 – 628) / 50 = 5.8 PgC
Out: 210.9 – 5.8 = 205.1 PgC
Atmosphere: 913.4 PgC
Increase in atmosphere: 4.2 PgC
Year 10:
Atmosphere: 944.0 PgC
In: 208.6 + 10 PgC = 218.6 PgC
Atmosphere: 954.0 PgC (temporarily)
Net out: (954.0 – 628) / 50 = 6.5 PgC
Out: 218.6 – 6.5 = 212.1 PgC
Atmosphere: 947.4 PgC
Increase in atmosphere: 3.5 PgC
Year 20:
Atmosphere: 975.8 PgC
In: 215.6 + 10 PgC = 225.6 PgC
Atmosphere: 985.8 PgC (temporarily)
Net out: (985.8 – 628) / 50 = 7.2 PgC
Out: 225.6 – 7.2 = 218.5 PgC
Atmosphere: 978.6 PgC
Increase in atmosphere: 2.8 PgC
As one can see, the net sink rate increases with the distance to the (old) equilibrium and a new equilibrium will be reached when extra output = extra input with extra CO2 in the atmosphere at extra input * Te
That is at Lnew = 628 + 10 * 50 = 1128 PgC
When the extra input stops, the extra output will exponentially go back to zero and the level in the atmosphere back to the “old” equilibrium of 628 PgC.
Why search for a reason that atmospherc CO2 is increasing? It is staring us in the face. Human emissions are two times larger that atmospheric accumulation.
David Andrews
July 22, 2025 at 9:23 pm
What does your math predict, if FF emissions continue to add 10 Pg/year and the natural emissions continue with a constant 200 Pg/year? What will the subsequent CO2 concentration be in twenty years? And what will the increase from the previous year be?
Ferdinand,
His model does explain that human CO2 is about 20-30 ppm of L which is 430ppm.
David,
Your assumptions are not evidence.
Jim,
The best prediction I can make, assuming constant human emissions of 10 Pg/yr for the next 20 years, would be to also assume that the “airborne fraction” remains around 45% as it has for 75 years. That is, each year the atmosphere would gain 4.5 Pg, so after 20 years it would be up by 90 Pg. Notice that the constant natural emission rate assumed (your 200) doesn’t matter since, by my assumption of a constant airborne fraction, I have guaranteed that net natural absorption is a constant 5.5 Pg/yr. (Note that once again you have focused on natural emissions, forgetting about natural absorption.)
One could certainly be concerned that, going forward, the natural processes that have until now been mitigating the atmospheric CO2 rise might saturate, causing the CO2 growth rate (and airborne fraction) to increase. That is a legitimate concern motivating some research. But for the PAST 75 years the data on the airborne fraction are in. They leave no room to argue that the natural processes are causing the increase.
I am glad you phrased the question in terms of steady rates. You have often referred to “exponentially increasing” rates with no justification except to make your model work. Indeed the human emission rates have been increasing, and that accounts for the positive second derivative of the Mauna Loa curve. But all it takes is steady human emissions to maintain steady growth in atmospheric CO2.
Jim,
I see that my response and Ferdinand’s are different. That is probably the outcome you wanted. His model effectively has the airborne fraction decreasing with time quite dramatically in 20 years, with constant human emissions. While I recognize that “airborne fraction” is only a convenient summary of data and represents nothing fundamental, I am skeptical that it could fall to 28% in 20 years.
Ferdinand Engelbeen
July 23, 2025 at 1:26 am
FE says “If he had looked at e.g. 5 year intervals (or 5 year moving averages), he would have seen that the effect just fades away and only leaves a very small trend for temperature.”
Munshi in fact followed his first work with another that did the same analysis for different time intervals and came to the same conclusion as he had on this referenced paper. I will look for that paper and get a link. I think it is likely already cited in Dr. Ed’s work.
I found Munshi’s work on other time intervals:
https://chaamjamal.wordpress.com/2018/12/19/co2responsiveness/
David Andrews
July 23, 2025 at 7:25 am
DA’s question “Why search for a reason that atmospherc CO2 is increasing? It is staring us in the face. Human emissions are two times larger that atmospheric accumulation.”
Because all the policies recommended to cure the “Climate Crisis” are based on the assumption that we can control atmospheric CO2 by ending our use of fossil fuels. I don’t think there is a “Climate Crisis” but am convinced there is a Climate Policy Crisis that costs dearly in coin and life.
If you and EF are correct will ending the use of fossil fuels end the rise in atmospheric CO2?
DMA,
Yes. Solid science says that ending the use of fossil fuels would end the rise in atmospheric CO2. There is some disagreement on the rate of fall after “net zero”. Ed’s opinions are very much outliers.
To Everyone:
Today, I took some time to review our progress in these debates. This comment is a result of this review. I will make this part of my rebuttal paper as well.
I will appreciate your suggestions on how I can improve this explanation.
A major source of confusion is between those who follow my calculation of the human and natural carbon independently, and those who do not. There is a precedent in physics my method. It is the Partition Principle.
The Partition Principle is used in Statistical Mechanics and Quantum Physics, but it also applies to classical physics. In many cases, including this one, it is the only way to calculate the corrrect answer.
The way I calculate the carbon cycle by separating human carbon atoms from natural carbon atoms follows the Partition Principle of physics.
This separation is necessary to correctly calculate the human carbon cycle and thus the effect of human carbon atoms on the CO2 level as distinct from the effect of natural carbon atoms on the CO2 level.
All calculations made without this separation are fundamentally wrong.
Therefore, In the manner that I defined the “Climate Equivalence Principle,” I now define the “Climate Partition Principle.”
The Climate Partition Principle is a special case of the Partition Principle … an extremely simple case.
There are only two parts to the partition. The variables are continuous. Human carbon atoms and natural carbon atoms are identical. They follow the same rules. There are no substitutions between the partitions. Human and natural carbon atoms do not interact or replace each other.
Neither carbon cycle interferes with the other. Their levels and flows are independent.
Human and natural carbon cycles have their own equilibriums, which represent the maximum entropy for the number of carbon atoms in each partition.
Each carbon cycle has continuing flows from each reservoir to adjacent reservoirs. At equilibrium, these counter flows are equal, but the flows continue.
IPCC defines its natural carbon cycle at equilibrium. This equilibrium results in certain percents of the total atoms residing in each of the four defined reservoirs: land, air, surface ocean, and deep ocean. This equilibrium also allows the calculation of the Te for each outflow node, using Te = Level / Outflow (at equilibrium).
Because human and natural carbon atoms follow the same flow rules and have the same Te’s, their equilibrium percentages are equal.
If either carbon cycle gets new carbon atoms, this adds to the total mass and lowers the entropy in this carbon cycle.
When a carbon cycle is not at its maximum entropy, the carbon cycle will change its flows in a manner that allows the carbon cycle to approach equilibrium as fast as possible.
This is the correct way to calculate the changes in each carbon cycle and to calculate the effect of human carbon on the CO2 level.
All calculations so far presented by the CO2 Coalition representatives are wrong because they have not properly formulated their carbon cycles.
In my opinion, most of the disagreement in these discussions is because the CO2 Coalition reps do not use correct physics. Until the CO2 Coalition reps wake up to proper physics, we will never agree.
Ferdinand Engelbeen
July 23, 2025 at 7:20 am
Thank you for your spreadsheet showing the twenty year future. It’s great. I think I deciphered your formula correctly, but I would like you to confirm it. Meanwhile, I will update my dropbox app so that I can show you the result of back calculating your formula to earlier years.
La_end = (La_begin + Ff_start) – F_netout
F_netout = [ (La_begin + Ff_start) – La_base ] / Te
F_in = Fn_start + Ff_start
F_out = F_in – Fnetout
DMA, July 23, 2025 at 10:25 am
Thanks for the link…
The first point that immediately did attract my attention, is his use of different scales for the different graphs.
For the emissions, the same scale for the 1 to 5 year trends.
For the increase in the atmosphere, smaller scales, so that it is not directly visible that the variability gets smaller.
The same for the “airborne fraction”, to a lesser extent.
And why not plotting emissions and increase in the atmosphere together?
The same visual trick was used for the de-trended data, with a difference in scale of a factor 3.
Nevertheless, as already said: there is absolutely no correlation between the variability of the FF emissions and the variability around the trend of CO2 in the atmosphere, for the simple reason that the FF emissions have hardly any variability. Thus looking at the (temperature caused) variability gives a completely spurious answer.
Just the opposite of the warning that one must be aware of spurious correlations between two similar up going variables…
I am pretty sure that Munshi’s approach would fail with my test of 20 years ago with two variables, one with a slope and no variability at all and another with a double sinus and no slope at all…
And again, in this case, it is entirely possible ánd plausible that the trend of FF emissions is the cause of the increase in the atmosphere, as these emissions are fully added directly into the atmosphere and only can be removed into other reservoirs.
His work does contain a link to another of his works, where he explains why one must use detrended data to avoid spurious correlations. That link doesn’t work, but I probably have found the paper:
https://download.ssrn.com/16/10/12/ssrn_id2851418_code2220942.pdf
That contains following sentences:
“In this kind of empirical evidence, the theoretical time scale at which the proposed causation works must match the time scale of the correlation (Box, 1994). Thus a correlation between emissions and changes in atmospheric and oceanic carbon dioxide must exist at an annual time scale and a correlation between emissions and warming must exist at a decadal time scale.”
Wow. I never have heard of such short time scales.
Because of the relative huge temperature induced noise, one need at least 5 years of data to have certainty about the CO2 trend and as far as I know, climate is at least over a period of 30 years…
With that kind of definitions, one never can obtain any sea level change observation, as there is absolutely no correlation per minute, day, year or even 20 years (only a statistical one) between the real sea level and the observations…
David Andrews
July 23, 2025 at 10:05 am
Thank you for your prediction, as I’m hoping it will get us on the same page. In other words, understanding why we insist on our positions, as I expect we will.
July 23, 2025 at 10:17 am
No worries about not having the same answer as Ferdinand. There are no certainties about the future, because no one has been there yet.
im Siverly, July 23, 2025 at 2:45 pm
Completely right…
Ff_incr eventually can be added each year to make it even more realistic…
and the increase in inflow each year is in ratio to the increase in the atmosphere, but plays no role in our calculations, which is based on the net outflow.
Dr. Ed
July 23, 2025 at 2:30 pm
Thanks for hosting this educational debate. So often do new concepts get introduced that I never realized would apply to this discussion.
I have trouble with this statement, “Because human and natural carbon atoms follow the same flow rules and have the same Te’s, their equilibrium percentages are equal.”
First, there will never be equilibrium as long as inflows and outflows continue to evolve.
Second, why is it necessary for percentages to be equal, even if some type of pseudo equilibrium could be defined? Take a simple reversible chemical reaction. At equilibrium, it would be some coincidence if the percentage of the product turned out the same as the reactant. I’m pretty sure you meant something different than what you wrote.
It’s clear to me that choice of models cause the main disagreement of the two camps participating in this discussion. Your model is linear. Maybe that’s implied by the Partition Principle. That’s a new concept for me to review.
Ferdinand and others use non-linear models. What makes them non-linear is assuming a constant atmosphere concentration in the past as what determines the rate of mass transfer. For example, one model says,
Outflow = (pCO2now – pCO2then) / Tau or ==> 2.8 ppm/year = (420 ppm – 280 ppm) / 50 years.
Linear models use mass transfer proportional to absolute concentration. Those model’s solutions require solving differential equations, not simple math.
Jim,
Let me build on the little model you suggested. (You understand that the numbers I use are nominal only.) That model was:
10 Pg/yr human emissions (measured)
4.5 Pg/yr atmospheric accumulation (measured)
5.5 Pg/yr net global uptake (deduced)
200 Pg/yr natural emission (guesstimated)
205.5 Pg/yr natural absorption of ALL carbon types (deduced from guesstimate)
Thus 200 Pg/yr of carbon is counter-flowing in both directions and COMPLETELY BALANCED. The only imbalance between natural inflow to the atmosphere from land/sea reservoirs and outflow from the atmosphere to land/sea reservoirs is the 5.5 Pg/yr “net global uptake” that mitigates the rise is atmospheric carbon and increases the land/sea reservoir levels. The 200 Pg/yr balanced flow does NOTHING to the levels in the atmosphere or land/sea reservoirs. But it is 20x bigger than human emissions and it does do something. It mixes the atmospheric carbon with the land/sea carbon. Anthropogenic emissions into the atmosphere mean “human carbon” concentrations are higher there than in the land/sea reservoirs. So the mixing moves “human carbon” from the atmosphere to the land/sea reservoirs. While these balanced mixing flows move exactly zero net carbon, they change the composition of the atmosphere by reducing the “human carbon” therein.
The positive net global uptake tells you where the atmospheric CO2 rise is coming from: us. The mixing (which you will recognize either as a “disequilibrium isotope flux”, or what I have been calling the mechanism that dilutes the Seuss effect) hides the evidence that we are responsible. Balanced exchanges just scramble the atmospheric carbon composition without changing the overall carbon levels. The net flow of “human carbon” out of the atmosphere does not correspond to a net flow of carbon. That is why hardly anyone besides Ed bothers to track “human carbon”. Its concentration in the present amosphere does not tell you what Ed thinks it tells you.
Ed,
Your proclamations, which appeal only to the authority of yourself, are just plain silly.
“All calculations made without this [human/natural] separation are fundamentally wrong.” This is nonsense. You are certainly free to do the calculation your way. The 99% of scientists who didn’t do it your way are still correct and gained insights that you missed. In particular you missed the “mass balance” (carbon conservation) argument. Physicists appreciate analyses that use conservation laws, whose elegant simplicity can sometimes appear “Magical”.
“Because human and natural carbon atoms follow the same flow rules and have the same Te’s, their equilibrium percentages are equal.” (?) I don’t think this is what you meant to say, but I have no idea what you did mean to say.
“All calculations so far presented by the CO2 Coalition representatives are wrong because they have not properly formulated their carbon cycles.” The total carbon cycle envisioned in invoking carbon conservation is well formulated. There is no need for a lot of detail. Inputs of carbon to the atmosphere come from human and natural emissions, with the human emissions adding long sequestered carbon to the fast cycle. Natural processes remove carbon from the atmosphere and put it in land/sea reservoirs without any bias on the source of that carbon. Human processes that remove carbon of any type from the atmosphere are negligible. You know the consequences of this simple formulation.
Jim Siverly July 23, 2025 at 4:20 pm
Dear Jim,
IPCC’s model has four main carbon reservoirs. Such a model will have an equilibrium if no new carbon is added to any reservoir. Equilibrium has constant levels and constant outflows. At equilibrium, the carbon will be distributed among the reservoirs with certain percentages.
Human carbon will try to move to these same percentages. If the inflow of human carbon stopped, the human carbon cycle will flow to these same percentages. Then the levels will be constant.
Imagine four ponds connected by tubes. Pour water into one pond and the water will flow to the other ponds until the system is at equilibrium.
IPCC defined its natural carbon cycle at equilibrium, with atmospheric CO2 at about 280 ppm. These flows and levels let us calculate the six Te for this model. Once we know these Te, we can calculate how human carbon flows through the carbon cycle. Human and natural carbon will have the same Te because their carbon atoms are identical.
This model may not apply to chemical reactions. However, I do know that pharmacological models follow the same model that I use
My equation (2) makes my model linear. Outflow is proportional to the first power of the level. Double the level and we double the outflow.
The Climate Partition Principle is an addition to the above description. It means that we must do our carbon cycle calculations by putting natural carbon in one partition and human carbon in another partition, and carbon does not flow between these partitions.
Just for completeness to all with an interest, excluding the argumentative one. Although this will be treated with the usual distain, denial ignorance wrapped up in another specious waffle argument.
Carbon Isotope Ratio Formula 17Jun25 https://www.researchgate.net/publication/392822758_Carbon_Isotope_Ratio_Formula_17Jun25
Further at Page 767-2, https://www.researchgate.net/post/The_physical_processes_of_global_warming_and_climate_change–How_can_alternative_viewpoints_be_resolved/767
Philip Mulholland explains how NOAA measured -10‰ δ¹³C CO2 in the oceans.
DMA, July 23, 2025 at 10:25 am
In addition to what I have already said about Munshi’s work:
Munshi only looked at the difference between the variability one independent variable (FF emissions) with the dependent variable (CO2 increase in the atmosphere).
In the real world, there are two independent variables which influence the CO2 increase in the atmosphere: FF emissions and temperature, the latter can be huge over long periods like ice ages.
As there is a huge (mostly) short-time correlation between temperature variability and CO2 rate of change variability in the atmosphere, all what Munshi did prove is that there is no correlation between FF emissions and temperature…
Brendan Godwin, July 23, 2025 at 9:24 pm
“These two groups are separated by δ13C values of -8.7 0/00 (Air) and -10 0/00 (Ocean) measured for atmospheric and oceanic mobile carbon dioxide gas respectively.”
Mulholland uses following link of NOAA for the -10 per mil for CO2 from the oceans:
https://gml.noaa.gov/outreach/isotopes/mixing.html
That doesn’t contain any direct measurements of CO2 in the ocean waters, but it is known from physics that at the water-air border (and reverse) the heavier isotopes escape slower from one medium to the other medium, which makes that there is a discrimination of about -10 per mil δ13C for CO2 going from the oceans to the atmosphere and about -2 per mil δ13C in opposite direction. Or in average -8 per mil if both flows are in equilibrium.
See: https://scope.dge.carnegiescience.edu/SCOPE_16/SCOPE_16_1.5.05_Siegenthaler_249-257.pdf
“Now the fractionation factors can be computed numerically from eqs. (2):
α(as) = 0.9984= 1 – 1.6‰
α(sa) = 0.9905= 1 – 9.5‰”
I can’t make much of the second link as that discussion is mainly about the influence of the sun on climate, not the topic here.
And I see that you are a Postma believer. Maybe of interest for you:
https://climateofsophistry.com/2023/01/31/ferdinand-engelbeen-another-zeta-5th-columnist/
And that second link does contain some very good advise:
“It is also surprising how emotional this subject has become for many people. Pejorative name-calling and labeling abound within many internet forums. Please — such things are not welcome here. Pejorative language is not conducive to successfully resolving alternative viewpoints.”
Maybe Brendan can learn something of that advise?
Dr. Ed, July 23, 2025 at 2:30 pm
“This separation is necessary to correctly calculate the human carbon cycle and thus the effect of human carbon atoms on the CO2 level as distinct from the effect of natural carbon atoms on the CO2 level.
All calculations made without this separation are fundamentally wrong.”
Sorry, but here we do completely disagree. There is no fundamental difference in any way between human induced and natural CO2 in any process where amounts, pressure or temperature are involved. Only a small (!) differentiation in isotopic composition for biological processes and at physical borders.
Once human FF emissions are supplied to the atmosphere, in all following processes of mass transfer they behave in exact the same way as natural emissions, thus there is not the slightest need to separate them in “natural” and exact the same “human” parts. That “separation” can be theoretically done, but is only of academic interest and makes everything more complicated without purpose.
“Human and natural carbon cycles have their own equilibriums, which represent the maximum entropy for the number of carbon atoms in each partition. ”
This sentence doesn’t make any sense.
The equilibrium level must be exactly the same, or you violate the equivalence principle. In the following texts, you do confirm that principle.
“All calculations so far presented by the CO2 Coalition representatives are wrong because they have not properly formulated their carbon cycles.”
We didn’t use any carbon cycle in our work, as that was not necessary for the overall calculations of the carbon mass balance, the O2 balance, the 13C/12C balance and the 14C balance: we only used the differences between ins and outs, as what goes in must remain in the atmosphere or go out. No matter the source or height of what goes in and or where it goes.
How much carbon cycles between the different compartments is not of the slightest interest for the changes in the atmosphere or any other reservoir: only the difference between ins and outs is what changes the carbon mass in a reservoir and that is quite exactly known for the atmosphere from atmospheric and FF emission data. That shows that more FF CO2 is coming in than as difference is going out as net sink and that difference is exactly known, but of no interest where that goes or how it is partitioned between oceans and vegetation.
Our approach matches the carbon mass balance and doesn’t violate any observation. Your calculations violate the carbon mass balance, as the calculated increase in the atmosphere is much smaller than observed and the main reservoirs that should supply the extra “natural” CO2 also increased in carbon, while they should have decreased…
Ferdinand Engelbeen July 24, 2025 at 2:42 am
Dear Ferdinand,
Thank you again for your comments. It is clear that we disagree on the fundantals of physics.
You have made your points clear. There is no more to discuss. I appreciate your participation in this debate.
I trust that you feel like you have had the opportunity to freely make your points.
Ed
David Andrews July 23, 2025 at 8:35 pm
It is surprising that you taught Thermodynamics and yet you have no appreciation of how and when to use the Partition Principle.
Ferdinand,
It isn’t about agreeing or disagreeing. The math isn’t on your side.
David Andrews,
I thought it was 97% of scientists. Is it now 99% of scientists? You chastise Dr. Ed for appealing to his authority, but then you invoke the authority of the 99%. The problem is that Dr. Ed is correct, and your 99% are wrong. You and your 99% haven’t made one salient point.
Jim,
Dr. Ed is stating that the human carbon cycle is independent of the natural carbon cycle. Human carbon cycle doesn’t affect the natural carbon cycle and vise versa. Nature treats them both the same. I think the Partition Principle is another way of looking at the Equivalence Principle. We would not be here if nature didn’t conform to those two Principles.
David,
Yes, humans are adding about 5PgC to the atmosphere every year, but that causes only about 20PgC of the total carbon in the atmosphere. We’ve shown you the solution to the continuity equation. I think you stopped being a scientist a long time ago and became a politician. I think many of your 99% fit that bill.
Brendan Godwin, July 23, 2025 at 9:24 pm
I have looked at the references in Philip Mulholland’s work: NOAA did only say in that reference that the CO2 out of the oceans (not IN the ocean waters!) is at -10‰ δ¹³C.
That indeed is the case: with an average near zero δ¹³C in the ocean waters, at the water – air border, the lighter (and faster) 12CO2 escapes faster than 13CO2, which gives a change of -10‰ δ¹³C between CO2 in the water and CO2 in the atmosphere. The same happens in opposite direction with a difference of -2‰ δ¹³C, thus leaving +2‰ δ¹³C behind in the atmosphere. Average -8‰ δ¹³C, if the flows are equal.
Calculated here:
https://scope.dge.carnegiescience.edu/SCOPE_16/SCOPE_16_1.5.05_Siegenthaler_249-257.pdf
From the abstract:
“Isotopic fractionation factors for the CO2 transfer between atmosphere and ocean are calculated, taking into account equilibrium and kinetic fractionation. Diffusion of CO2 into the water, which is rate limiting for mean oceanic conditions, fractionates the carbon isotopes only little. 13C/12C fractionations are found to be -1.8 to – 2.3‰ for atmosphere-to-ocean transfer, and -9.7 to -10.2‰ for ocean-to-atmosphere transfer.”
Stephen P Anderson, July 24, 2025 at 7:10 am
Stephen, even the nicest math and fancy formula’s fail on simple facts like adding 10 PgC/year to the atmosphere and looking at the result, which only shows a 5 PgC/year increase, that proves that the 10 PgC/year is the cause of the 5 PgC/year…
Dr. Ed, July 24, 2025 at 4:40 am
Indeed we are at the point to agree that we disagree on the fundamentals of this discussion like the carbon mass balance.
As I have a lot of other problems to solve for the moment and need to prepare for a (similar!) debate in Oslo, I stop here with my reactions, but still are working on the “split” CO2 flows…
Thank you indeed for your hospitality, which indeed is quite rare nowadays…
Ferdinand Engelbeen
July 23, 2025 at 1:26 am
FE says “If he had looked at e.g. 5 year intervals (or 5 year moving averages), he would have seen that the effect just fades away and only leaves a very small trend for temperature.”
The Munshi paper cited above says:
A rationale for the inability to relate changes in atmospheric CO2 to fossil fuel emissions is described by Geologist James Edward Kamis in terms of natural geological emissions due to plate tectonics [LINK] and by Viv Forbes in terms of the natural Henry’s Law equilibrium with much larger store of CO2 in the ocean [LINK] . The essential argument is that, in the context of much larger natural flows of carbon dioxide and other carbon based compounds, it requires circular reasoning to describe changes in atmospheric CO2 only in terms of fossil fuel emissions. It is shown in a related post, that in the context of large uncertainties in carbon cycle flows, it is not possible to detect the presence of fossil fuel emissions without the help of circular reasoning [LINK] .
Carbon cycle flows cannot be directly measured and they must therefore be inferred. These inferred carbon cycle flows contain large uncertainties. The essence of this argument is that the in climate science mass balance of the carbon cycle with and without fossil fuel emissions, the declared uncertainties in carbon cycle flows are ignored. In the related post cited above [LINK] it is shown that when the declared uncertainties are taken into account, the much smaller fossil fuel emissions cannot be detected net of uncertainties in the much larger carbon cycle flows because the carbon cycle balances with and without fossil fuel emissions within its uncertainty bounds.
I believe these quotes and others in Munshi paper address the criticism you mentioned. Do you have an answer to Munshi’s claim or a refutation of his work? I just can’t see how if FF emissions are the cause of ALL of the increase there is not a correlation id the detrended data.
FE
I apologize for this last post. I think you have addressed it above but none of todays comments came into my view until I posted it.
DMA, Brendan, Ed, Stephen, etc.
I don’t think I can do better than my explanation to Jim (on 7/23 at 8:16pm) on why the low level of “human carbon” in the present atmosphere does not tell us human emissions are unimportant. Indeed, the explanation is somewhat more subtle than the other one you are all unable to understand: that a positive net global uptake unambiguously means we, not nature, are the source of the CO2 rise.
So I will move on. Your inability to understand is your problem, not mine.
DMA, July 24, 2025 at 1:25 pm
No problem at all. I think there is some delay if one doesn’t use the refresh button (Ctrl+F5) and only sees the changes after a restart and there is a delay for (too long?) replies which need moderation…
As a final comment, the main point of disagreement:
There is no fundamental difference between our and Dr. Ed’s ideas of the fundamental physics involved.
The main difference is at the process side:
Dr. Ed assumes that all outputs of all reservoirs involved are directly proportional to the CO2 levels/pressures in the different reservoirs. Therefore one can use output = level / Te where Te = RT, the turnover/residence time.
In that case, the small extra input from fossil fuels use has little influence on the CO2 level in the atmosphere.
We assume that the largest parts of the outputs are not proportional to the CO2 levels/pressures in the different reservoirs, but depend mainly of temperature, sunlight and biological processes, both for the outputs as for the inputs, which makes that a large part of the outflows of the atmosphere into other reservoirs are simply recycled in reverse and have little influence on the CO2 level/pressure in the atmosphere.
In that case, the small extra input from fossil fuel use is the main driver for the increase of the CO2 level in the atmosphere.
The correlation coefficients between atmospheric CO2 and climate (and atmospheric CO2 change and climate change) demonstrate these factors are uncorrelated over the most recent 550 million years of evidence.
550 million year correlation coefficient (CO2 and climate): 0.29
550 million year correlation coefficient (CO2 change and climate change): 0.10
No correlation means causation is impossible!
Therefore, changing CO2 cannot be the cause of climate change.
Fact: Oceans are the greatest storehouse of carbon dioxide on the planet.
Science: A warming global climate will raise ocean temperatures which, as a consequence, will outgas relatively more CO2 to the atmosphere, thus climate change CAN cause increasing atmospheric CO2.
Q.E.D.
End of story.
Bob,
End of story? I don’t think so. If ocean outgassing was dominant, CO2 atmospheric accumulation rates would exceed human emission rates. They don’t. Measured carbon levels in the ocean are increasing; that is a probem if you think oceans are a net source rather than a sink. Higher atmospheric carbon levels push carbon INTO the oceans, especially in the cooler polar regions.
Ferdinand Engelbeen
July 25, 2025 at 12:27 am
“There is no fundamental difference between our and Dr. Ed’s ideas of the fundamental physics involved.” And “We assume that the largest parts of the outputs are not proportional to the CO2 levels/pressures in the different reservoirs.…”
Those statement are hugely contradictory. However, the disagreement between your camp and Dr. Ed’s will go on ad infinitum I’m afraid. That is sad, because it’s not an either-or situation. There is only one set of true physical principles at play. One cannot pick and choose what “processes” one wants to use to make the data fit to one’s idea of reality.
I’m on dropbox again and I finished working on back calculating your model, Dr. Roy Spencer’s, and my spreadsheet based on Spencer’s model. I added the natural emissions missing from the former two models. Spencer’s model back calculates perfectly. Your model seems to have a bug, because I expected it to back calculate ok, as well, but it didn’t. Maybe you can explain my error.
https://www.dropbox.com/scl/fi/hckovmziez0g1rpzvu97c/Jim_fluxes.xlsx?rlkey=jxl8bnq5tpwd9wt3r32rqy7d5&dl=0
My spreadsheet was modified from my original upgrade of Spencer’s. I used the Mauna Loa data to back calculate the 1959-2018 years using the formula NEn = Cn – Cn-1 * ( 1 – 1/Te ) – HEn where NE and HE are natural and human emissions, respectively. Astute observers will notice that as a form of Magic Math:
D = Eh + En – Sn.
From 1750 to 1958, I used my original estimate of exponentially increasing natural emissions. That was simply a process of extrapolating the fit to Mauna Loa data assuming there was a constant e-time (or residence, turnover, etc.). Because the Mauna Loa data is confined to a relatively narrow time interval, the extrapolation can be made to end at 280 +/- ? ppm without deviating much from a best fit. I also used a best fit to the Mauna Loa values to do the back calculation for the 1959 – 2018 years.
The takeaway from this exercise is to notice both the Spencer model and my model fit the data. Therefore, the question is, which model most likely represents a physical realistic process? It makes no sense to me that the net amount of carbon sinked annually is proportional to the difference between what the pCO2 is now versus what is was in 1750. That’s what the Spencer model says and does. My model says the amount sinked is proportional to the current atmosphere content. Period. That is standard physics and a fundamentally different concept than the one Spencer’s model is based on.
You can play around with different scenarios of net zero, net natural or various increasing amounts of both in future years. More data from 2018 on can be added as a check on how well my model performs.
David Andrews
July 23, 2025 at 8:16 pm
Your description of the human flow supplementing a constant inflow of natural carbon seems like a good first-glance explanation of what’s going on. Magic Math confirms it. Here’s the problem. Look at Ferdinand’s “Jim’s fluxes” spreadsheet that I amended and linked to below. In Spencer’s model, I tabulated the Te values for the whole period 1750 to 2018. Those values gradually increase from 3.14 years to about 4.3 years. What physical processes were changing during the past three centuries that would cause residence time to increase that much?
You wrote, “The net flow of ‘human carbon’ out of the atmosphere does not correspond to a net flow of carbon.” What does that mean and what difference does it make, even if you could support it with some model more explanatory than simple math?
I showed how increasing natural emissions supplement FF emissions and enable correlating the Mauna Loa data with a physically realistic constant e-time. I proposed various sources for where the extra carbon comes from. Now where is your evidence that there is no extra carbon and natural emissions have remained the same for centuries?
David Andrews
July 25, 2025 at 8:55 am
You never stop do you.
“Measured carbon levels in the ocean are increasing”
Why because you have cherry picked MLO data showing that. One location is not the world. MLO is surrounded by volcanoes that are constantly spewing CO2 into the oceans.
CO2 in the oceans at Grays Reef is falling.
https://www.pmel.noaa.gov/co2/story/Grays+Reef
Jim,
None of my arguments have been about time constants, and you give me no reason to start looking at them now. Getting them right is important, but they have no bearing on the question of where the atmospheric carbon rise is coming from. They are a distraction.
Carbon conservation plus data on human emissions and atmospheric accumulation tell us WITHOUT DOUBT that natural processes are removing carbon from, not adding it to, the atmosphere. You thought you saw a loophole in that argument but have failed to identify it. All you have been able to do is to reproduce Ed’s (and Hans Suess’s, Skrable’s, mainstream science’s, and my own) conclusion that what Ed calls “human carbon” is but a minor component of the carbon in the present atmosphere. That by no means implies that human emissions are but a minor contributor to atmospheric carbon rise. That is Ed’s biggest conceptual error, and you seem to be all-in with it.
I don’t think I need to again go through the arithmetic of my 7/23 post. My statement “The net flow of ‘human carbon’ out of the atmosphere does not correspond to a net flow of carbon” should be self-explanatory. In my analysis I separated the natural exchanges between atmosphere and land/sea reservoirs into the (unbalanced) net global uptake component removing carbon from the atmosphere, and the remaining EXACTLY BALANCED exchanges that homogenize the carbon composition of the various reservoirs but don’t affect AT ALL the total carbon levels in any of them. Why does that matter you ask? The simple “net global uptake” analysis shows that human emissions are responsible for the increase. The mixing represented by exactly balanced exchanges (aka “disequilibrium isotope flues, aka as “Seuss effect dilation mechanism”) changed the composition of the reservoirs without changing levels and fooled you, Ed, and Skarble into naively thinking that “human carbon fraction in the present atmosphere” equals “human contribution to the atmospheric CO2 rise.”
Nowhere in the above is there any need to invoke “extra carbon” or changes in natural emissions over the past few centuries. I don’t need to respond to whatever fudge-factors your undocumented model requires to agree with Mauna Loa data.
What do you find difficult about the consensus view? I could say that it wins by Occam’s razor, but the case is much stronger than that. But I know that the notion of “consensus” is red meat to those who have declared themselves to be on Ed’s side.
Jim Siverly, July 25, 2025 at 10:54 am
Jim, the essence in this case is in the model, in that sense that Ed (and you and many others) assume that all outflows are only CO2 level/quantity/pressure dependent in the different reservoirs.
That is a fundamental error, as at least half of the total yearly outflow, the one into vegetation, is near completely independent of the actual CO2 level/pressure in the atmosphere.
Only depends of temperature and sunlight. Even so much, that it goes from minimum to maximum within a few months, sucks so much CO2 out of the atmosphere, that the CO2 level in the atmosphere drops, despite the opposite extra supply of CO2 from the warming oceans.
Of the (1750, natural) 108 PgC and (2000, human caused extra) 14 PgC that all bio-life releases over a year, mainly in fall and winter, only 2 PgC is stored in more permanent vegetation and soils. The net difference, which is the result of the 240 PgC (human caused) increase in the atmosphere thus only caused a very meager 2 PgC extra uptake by the total biosphere…
That makes that your back-calculation, which is based on the absolute CO2 pressure in the atmosphere is completely at odds with the real world.
In both my and Spencer’s series, you use a fixed in/decrease of CO2 based on the original level of 628 PgC and the calculated 50 years adjustment time.
The real net removal rate of some extra CO2 above the 628 level is in ratio to the difference between the actual CO2 level and the original equilibrium, which makes that in back-calculation the removal rate reduces to zero when the 628 PgC is asymptotically reached again.
Brendan Godwin, July 25, 2025 at 6:27 pm
Congratulations Brendan. You were able to find a negative (?) trend of the pCO2 in seawater within corals which show a seasonal change in pCO2 of the oceans between 250 and 750 μatm.
Can you show me how large that trend is?
It’s time the waffleator packed his bags for Oslo and spread his propaganda to a different audience. He said:
July 24, 2025 at 9:02 am
As I have a lot of other problems to solve for the moment and need to prepare for a (similar!) debate in Oslo, I stop here with my reactions
And
July 25, 2025 at 12:27 am
As a final comment
Yet here is he still waffling on. He just can’t help himself.
Brendan Godwin, July 26, 2025 at 4:41 am
If I have five minutes time in between the preparations for Oslo, it always is a joy to tease Brendan to see how he reacts…
BTW, what is the trend in ocean pCO2 in these Greys Reef? I didn’t find any trend data, only a lot of extreme (seasonal) noise…
Ferdinand Engelbeen
July 26, 2025 at 2:03 am
You claim assuming “that all outflows are only CO2 level/quantity/pressure dependent in the different reservoirs…is a fundamental error, as at least half of the total yearly outflow, the one into vegetation, is near completely independent of the actual CO2 level/pressure in the atmosphere.”
This contradicts CO2 Coalition’s own anecdotal evidence of four trees growing faster as a function of CO2. I say anecdotal, because you will claim it is the difference in CO2 today than 280 ppm then. But you would only be an assertion without scientific experimental evidence.
AI says, “Photosynthesis rate is the speed at which plants convert light energy into chemical energy, typically measured by the rate of carbon dioxide uptake or oxygen release. Factors like light intensity, carbon dioxide concentration, and temperature significantly influence this rate.”
Notice that it doesn’t say, “factors like carbon dioxide concentration difference between now and preindustrial time.” Plants don’t know what CO2 was centuries ago. If you want to make a convincing argument, then do or show an experiment that shows vegetation growth more proportional to the concentration difference than to the absolute CO2 concentration.
“[My gobbledygook] makes your back-calculation, which is based on the absolute CO2 pressure in the atmosphere, completely at odds with the real world.”
That speaks for itself, no further comment needed.
Dr. Spencer’s model, while applying the same physically wrong science you use, back calculates perfectly in the same manner as his forward calculation does. He used what you mistakenly call the “real net removal rate.” You have never shown how the difference between the actual CO2 level and the original equilibrium is the true rate determining mechanism. Other than the climate community, no other scientific community agrees with you. Examples to the contrary are welcome.
I wish you all the best in Oslo.
David Andrews
July 25, 2025 at 7:58 pm
In an earlier note to Ferdinand I said “I’m working on a way to demonstrate how the simple math you and David Andrews rely on can give ambiguous results based on somewhat arbitrary choices of variables.”
You responded July 8, 2025 at 7:44 pm with, “You seem to have been distracted from that goal or maybe have given up. My goal here is to keep you focused on it.”
Well, I put up the spreadsheets comparing Ferdinand and Spencer’s simple math models with my model demonstrating that one can arrive at the same results using different variables, i.e., removal rate constants and emission inputs.
Now you are saying I gave you no reason to look at time constants, “they are a distraction.” I really should stop beating my head against the wall, eh? [a reference to an old Bazooka Joe Gum joke]
You claim, “The net flow of ‘human carbon’ out of the atmosphere does not correspond to a net flow of carbon” should be self-explanatory. I’m sorry, but that seems like a denial of the equivalence principle.
Moving on, I’ll try to follow your logic. You categorize (separate) natural exchanges between atmosphere and land/sea reservoirs into two situations, (1) the preindustrial case where EXACTLY BALANCED exchanges homogenize the carbon composition of the various reservoirs without affecting AT ALL the total carbon levels in any of them, and (2) the present case where human emissions cause unbalanced exchanges resulting in net global uptake removing carbon from the atmosphere. Then you conclude, “[this] simple ‘net global uptake’ analysis shows that human emissions are responsible for the increase.” Voila!
That model is Magic Math, because it assumes no change in carbon levels, despite evidence to the contrary, and applies non-standard physical principles. My model needs to invoke “extra carbon” and changes in natural emissions to explain the known data and remain consistent with standard physical principles. Fortunately, the potential for finding evidence of extra carbon exists. Where is your evidence that carbon levels haven’t increased and how would you explain any evidence they have?
Jim Siverly, July 26, 2025 at 9:03 am
One need to make a differentiation between the seasonal and longer term fluxes between the atmosphere and the biosphere.
If the CO2 level in the atmosphere instantly doubles, the output in the biosphere hardly increases and needs decades to catch up with the extra CO2 in the atmosphere and even then doesn’t double.
With 50% extra in the atmosphere over the past 175 years, the increase of the fast cycle (thus the amount of extra living vegetation) only increased with 13%, that is all and only 25% of the extra FF of each year emitted in the atmosphere is absorbed into more permanent vegetation and soils as extra mass for longer periods.
“Dr. Spencer’s model, while applying the same physically wrong science you use, back calculates perfectly in the same manner as his forward calculation does.”
My calculations match these of Spencer within 1 PgC when you shift the 20 years start to 2022. It is your faulty interpretation that gets wrong, both in the future as in the past…
“Plants don’t know what CO2 was centuries ago.”
Plants adapt to temperature and the amount of CO2 that is in the atmosphere: when temperature and the CO2 level increased from an ice age to an interglacial, from about 190 to 290 ppmv, plant and animal life did expand and reversed when a new ice age arrived. Thus vegetation did “remember” its original CO2 level…
If one would stop all FF emissions, then the world will stop “greening” and instead will start “browning”, as the CO2 levels drop to the original atmospheric CO2 levels of around 280-300 ppmv which is the equilibrium with the ocean surface today. As they did over ice ages and interglacials: there is zero impact of plant life on the δ13C level over 800,000 years, while the CO2 levels increased and decreased with 90 ppmv, completely dominated by the slow changes in ocean surface temperatures and related pCO2.
“Other than the climate community, no other scientific community agrees with you.”
Dietze, already in 1997 and heavily against the IPCC’s Bern model, Spencer, Lindzen, and many others all use the same “real removal rate”, based on the difference in pCO2 between the two main reservoirs: atmosphere and oceans. The latter dominates the CO2 level in the atmosphere, except when humans add more CO2 than oceans and biosphere can remove.
As far as I know, that are not members of the “climate community”.
David Andrews
At July 25, 2025 at 6:27 pm I replied to your comment at July 25, 2025 at 8:55 am re: “Measured carbon levels in the ocean are increasing”. You failed to reply. Instead you let the waffleator respond for you. You did the same the previous time as well. You obviously don’t have the intellectual capacity or knowledge to reply on your own.
David Andrews.
At JULY 25, 2025 AT 7:58 PM you yet again cited a reference to consensus. Anyone who cedes to consensus as a reference is not a scientist.
On JULY 14, 2025 AT 5:43 PM you attacked Murry Salby’s science by reference to his employment. Whoever does this is not a scientist.
You continually taint your comments with these anti-science political statements. All this does is prove that you are not a scientist but a political activist. This renders your comments worthless. To be taken with a grain of salt. You are not in this discussion to find a scientific pathway to the truth, you are here to push your political agenda.
Brendan Godwin July 26, 2025 at 7:59 pm
Dear Brendan,
Well put. I agree with you.
Ed
Ferdinand Engelbeen
July 26, 2025 at 12:45 pm
No, one doesn’t need to do any differentiation with my model. I will make two modifications to it with 1) 50% pulse and 2) net zero with a continuing gradual natural emission increase. You can freeze the natural emissions at any point. In all cases, CO2 will return to a new equilibrium level according to a four-year e-time.
1) https://www.dropbox.com/scl/fi/g6zj3et0vs3o9pfk0jzim/Jim_fluxes1.xlsx?rlkey=kz95m7zhp7ohflh209x84niuy&dl=0
2) https://www.dropbox.com/scl/fi/603gxxzkdk3l5mw43slxo/Jim_fluxes2.xlsx?rlkey=b23hjfhdhpakttqeemy5wjtbc&dl=0
“…from about 190 to 290 ppmv, plant and animal life did expand and reversed when a new ice age arrived. Thus vegetation did “remember” its original CO2 level…”
That is speculation based on anecdotal data completely devoid of proof, Ferdinand.
Roy Spencer is the climatologist who publishes the monthly UAH temperatures chart. Richard Lindzen has been called “an expert on climate change for four decades.” In no way can they be considered outside the climate science community.
The reference to Peter Dietz is quite interesting. I previously ignored it (to my great regret), because I considered it an appeal to authority from another one of the 50-year Tau, not 4-year Te, proponents. I reviewed about a third of the discussions with fellow IPCC contributors Dietz documented in his open review comments relating to his Carbon Model Calculations paper. I will finish reading those comments before providing a more detailed analysis. Suffice for now to say Dietz assumes removal is proportional to the difference between pCO2 now and 280 ppm, the preindustrial pCO2, without any confirming evidence that it is based on sound physics. The 50-year Tau, 55-year in Dietz’s case, is based on the pCO2 now – 280 ppm difference. [(408-280)/50 = 2.56 ppm/year, the approximate average removal rate in 2018] That makes it a circular reasoning argument. The same one you make.
You referenced Dietz over a dozen times here. Many of those times Dr. Ed noted the circular reasoning. I tried asking about A B reactions hoping you would see the relevance to the rates being proportional to actual concentrations, not differences between now and some original level. The Feely equation is proportional to delta pCO2, meaning d(pCO2)/dt – k * dCO2aq/dt now, not a preindustrial difference. If you continue to promote the 50-year Tau, you really should come up with some scientific evidence of the underlying physics.
Jim,
Thanks for your excel work. Excellent. I guess David and Ferdinand can keep arguing but math is hard to argue with.
Ferdinand Engelbeen July 25, 2025 at 12:27 am
Dear Ferdinand,
You wrote:
So, if I understand you correctly, you are saying that these extra processes increase, not decrease, the flows between the reservoirs compared to my (2) which says Outflow = Level / Te.
If so, then you are simply arguing that the real Te are smaller than the Te I derived from IPCC’s own data. And it in that case, we agree.
That is because Delta14C data show the IPCC Te are too large because they would have reduced the balance level of Delta14C to near -300. (Ignore David Andrews’ objection to this because he is irrational.)
Your argument that these extra processes increase the flow argues for smaller Te to explain the Delta14C data.
This blows your argument that your Tau is 50 years or more.
Jim Siverly July 26, 2025 at 12:45 pm and July 26, 2025 at 11:57 pm
Dear Jim,
Thank you for your excellent Excel calculations.
I have one question that maybe indicates I do not follow your use of “back calculations.”
That is because we cannot start with any distribution of carbon among the carbon reservoirs and from that determine what a prior distribution may have been.
This is because the carbon flows between the reservoirs always move the carbon distribution closer to their equilibrium percentages. Since all distributions flow toward their equilibrium distributions, it is impossible to determine a prior distribution.
Or perhaps I misunderstand what you mean by back calculations.
Jim,
I advised you to understand disequilibrium isotope fluxes a few weeks ago. You flunked that assignment. I see you also have borrowed one of Ed’s favorite tricks. When you don’t have an answer to an argument, misrepresent that argument and argue against the misrepresentation. The balanced exchanges I am talking about have nothing to do with pre-industrial times and you know that. I fear you are purposely wasting my time, but I will give it another shot.
Remember: Natural Absorption(NA) = Natural Emissions(NE) + Net Global Uptake (NGU) by simple math, and NGU has been positive over the last century by data and carbon conservation. From the nominal numbers we have been using, NGU is only 2-3% of NA. Of course NGU mitigates the atmospheric carbon rise from human emissions by removing carbon from the atmosphere and adding it to land/sea reservoirs. NGU changes carbon levels in reservoirs. But the remaining 97-98% of NA is, call it NAb, is exactly equal to NE. Three questions for you.
1. If NE = NAb, and NE is the quantity of carbon moving from land/sea reservoirs to the atmosphere, and NAb is the quantity of carbon moving from the atmosphere to land/sea reservoirs, how much do these exchanges together effect carbon levels? (You may study this question with a spreadsheet if you need to.)
2. If the atmosphere is rich in “human carbon” compared to the land/sea reservoirs because that is where smokestacks and exhaust pipes put it, do the same balanced two-way exchanges move net “human carbon” in one direction or another? Which way?
3. Does your answer to 2. “violate the equivalence principle”?
You can vary assumptions about natural emissions all you want. To match the data you must then also vary natural absorption to fit the measured NGU. Have fun beating your head against the wall with that “extra carbon”.
I don’t know why you think I assume “no change in carbon levels”. They are indeed changing because previously sequestered FF carbon is being put in the atmosphere and from there spreads to other fast-cycle reservoirs. The mass balance argument is corroborated by an observed expansion of the biosphere and carbon increases in the ocean. (Note that I avoided saying “ocean acidification”; I don’t want to wake up Brendan.)
Which of my physical principles is nonstandard in your opinion? Note that I still haven’t linked my argument to time constants, not that they are unimportant.
I have not seen your spreadsheet, but I think I know what your problem is. You think ”human carbon” leaving the atmosphere implies level changes, because you didn’t do your disequilibrium isotope flux homework. So you add extra natural emissions to match the Mauna Loa data, then you need extra natural absorption … Pretty soon you have “exponentially” increasing natural emissions and a headache
Jim Siverly, July 26, 2025 at 11:57 pm
There is an error in your calculation of my return to the equilibrium, which makes part of the problem in the back-calculation: you calculate the net outflow from the FF emissions from the previous year, while for Spencer’s calculation you use the FF emissions for the same year. Makes some difference, but still not what it should be, if you use the “real” decay rate.
In both cases, you don’t reflect what Spencer, me and others have done, as we calculated the 50 years Te/Tau from the CO2 level in the atmosphere and the net outflow as calculated from known human inputs and observed increase in the atmosphere. While you calculated the one-way outflow only for the atmosphere out, based on the (roughly observed) total outflows, not the back-flows from the other reservoirs. These are implied in your calculation as increasing together with the overall outflow, as that is the difference with the
The main difference still is that you assume a constant ratio between output flow and total amount of CO2 in the atmosphere, no matter the change in Te/Tau with the CO2 increase.
Moreover, you use some “self fulfilling” prophecy’s by calculating the “natural” inflows from I don’t know where before 1958 and calculate them from the CO2 level in the atmosphere after Mauna Loa measurements started.
How do you know these inputs? Dr. Ed uses the levels in the oceans and biosphere to calculate the inputs to the atmosphere, but you calculate them with the same turnover time…
I don’t think that many will disagree with the fact that the biosphere expanded and did shrink together with temperature and CO2 levels over the ice ages and interglacials. The point is that this had no measurable effect on the δ13C levels, until humans started to emit fossil fuel CO2:
https://www.ferdinand-engelbeen.be/klimaat/klim_img/co2_d13C_lgm_cur.png
That is a definitive proof that the oceans are the dominant cause of the CO2 changes in pre-industrial times.
And as you may know, the oceans at the “edges” (poles and equator) have near-constant temperatures and thus pCO2(aq), where the ocean waters sink in the deep or are upwelling and that is the dynamic “memory” for the pCO2 in the atmosphere…
“In no way can they be considered outside the climate science community.”
Come on Jim, you know as good as I know, that these are not supporting the mainstream science about the “catastrophic” GH effect. Neither do they support the hundreds or thousands years “life time” of our extra CO2 in the atmosphere from the Bern model. But they all recognize the about 50 years “adjustment” time and reject the 4 years residence time or Te as completely irrelevant for the decay rate of any extra CO2 in the atmosphere, of whatever source.
“The 50-year Tau, 55-year in Dietz’s case, is based on the pCO2 now – 280 ppm difference. [(408-280)/50 = 2.56 ppm/year, the approximate average removal rate in 2018] That makes it a circular reasoning argument. The same one you make.”
That is where you are completely mistaken. Peter Dietze indeed used the “historical” CO2 level in the atmosphere as equilibrium, but the current equilibrium was calculated from the net removal rate over different years by Spencer, myself and David Burton, because we now have the net removal rates at different CO2 levels in the atmosphere. That makes that it is easy to back-calculate the “real”, current, equilibrium level where the net removal rate is zero.
https://sealevel.info/Global_Carbon_Budget_2023v1.1_with_removal_rate_plot2.png
Only the net removal rate is plotted against the CO2 level in the atmosphere, without any assumption of Te/Tau. That shows an equilibrium of between 280-300 ppmv and thus a Te/Tau of around 50 years as result. Not reverse.
Jim,
Half way you can see that my text doesn’t fit: that was when I saw that you used the output data to calculate the inputs to the atmosphere. Can you elaborate on that, where the input data to the atmosphere are based on?
David Andrews July 27, 2025 at 9:16 am
David, your so-called explanation is unnecessarily complicated, so much so that you can get pretty much any result you wish to promote.
The only way you can make a valid point is to use my equation (2) for human and natural carbon independently because they include all the flows we are talking about.
Then show how you get from these equations to your equations. We need that connection to evaluate your equations.
If you can’t do that, then you are wasting everyone’s time with pseudo-science.
Dr. Ed, July 27, 2025 at 8:26 am
“So, if I understand you correctly, you are saying that these extra processes increase, not decrease, the flows between the reservoirs compared to my (2) which says Outflow = Level / Te.”
Indeed the extra processes increase the flows between the different reservoirs in both directions: while the increase in the atmosphere is about 50% since 1750, the in/outflows with the oceans increased about 33% and with the biosphere about 13%. Thus not in ratio to the increase in the atmosphere.
Moreover, the absolute height of the flows is of zero interest for any changes in any reservoir, only the difference between inflows and outflows changes the CO2 mass in any reservoir.
That difference is directly proportional to the distance with the equilibrium, which for the current SST is between 280-300 ppmv, as can be back-calculated from the different CO2 levels over time and the observed net removal rate,
That makes that the calculated Te (or Tau) is around 50 years, not the 4 years of the turnover time.
The 14C and 13C/12C ratio’s are “thinned” by the return of deep ocean waters which contain relative more 13C and 14C than fossil fuel emissions. That makes the Tau of both 14C and the 13C/12C ratio are a lot shorter than for the extra 12C/13C removal out of the atmosphere.
Jim Siverly, July 26, 2025 at 11:57 pm
Some part where I didn’t react on:
“The Feely equation is proportional to delta pCO2, meaning d(pCO2)/dt – k * dCO2aq/dt now, not a preindustrial difference. If you continue to promote the 50-year Tau, you really should come up with some scientific evidence of the underlying physics.”
The Feely equation shows the different delta pCO2’s for different parts of the oceans. For 90% of the sea surface, that difference only leads to a very small uptake by the ocean surface layer of about 10% of the increase in the atmosphere. That is because of physical and chemical restrictions in uptake. That is known as the Revelle/buffer factor. And measured as increase of DIC in the ocean surface waters.
The IPCC uses the total ocean surface as limiting factor for the CO2 access to the deep oceans, with as result the long residual uptakes of part of the current increase of hundreds to thousands of years.
Far more important is where the ocean waters sink into the deep oceans.The temperature there is year-round around freezing near the floating ice, which makes that the pCO2 of the ocean waters can be as low as 150 μatm( ~ppmv). The same for the upwelling places near the equator, where year-round high SST is measured and as high as 750 μatm for pCO2(aq).
That makes that a lot of CO2 (and oxygen) is taken from the atmosphere and directly moved into the deep oceans, without the physical and chemical restrictions of the rest of the sea surface.
My own estimate, based on the “thinning” of the δ13C “fingerprint”, is around 40 PgC/year that goes directly into the deep oceans (mainly in the N.E. Atlantic) and comes back some 1,000 years later near the coast of Peru/Chile.
What does that make when CO2 increases in the atmosphere? The extra pressure will increase the output into the polar sink places and reduce the emissions at the upwelling sites. For the current pCO2 difference with the atmosphere, the estimated (to close the “gap” with atmosphere, ocean surface and vegetation) is about 20% of the human emissions as carbon mass. Again in complete ratio with the “old” equilibrium.
The carbon increase in vegetation also is calculated, based on the O2 balance since about 1990. That is about 25% of human emissions as carbon mass. Even with large year-by-year variability in uptake by vegetation, in average all three reservoirs do sink CO2 in ratio to the “old” equilibrium.
Dr. Ed
July 27, 2025 at 8:41 am
“My” idea of a back calculation is just reversing the forward calculation. Dr. Spencer’s model makes it easy because he has a simple formula Cn = Cn-1 + EHn – ( Cn-1 – C0 ) / 50 where EHn is the industrial emissions added in the current year. Notice the removal is NET removal of only 2%/year based on fitting the Cn results to the Mauna Loa data. So the 50-year figure is an artifact of the assumption that the removal process is proportional to difference between now and way back when. It never seemed right to me.
Now back to answering back-calculation question. One can solve Spencer’s simple formula for Cn-1 and get
Cn-1 = [ Cn – Ehn – C0/50 ] / ( 1 – 1/50 )
Since the Cn, EHn, and C0 are known, you just work back from there to C0 = 1750 or wherever you want to start. With my model, back calculating is only possible with the known CO2 values from 1959 on. I can estimate the natural emissions, ENn, from ENn = Cn – EHn – Cn-1 * ( 1 – 1/Te ). Before that I don’t know what Cn-1 is. That’s when I extrapolate back using exponentially-derived estimates of ENn from a fit to the Mauna Loa data. So both my model and the Spencer model fit data to a formula. But I argue my formula, dare I say your formula, makes more physical sense.
The bottom line is a back calculation is, at best, only as good as the forward one from which it is derived. While Spencer’s model is wrong, in my opinion, it is consistent. Ferdinand’s has a bug which may or may not be my error. His formula seems to be different than Spencer’s somehow.
The overall point I’m making and only one that really interests me is what the true science dictates. I’m OK being wrong, I just want to be wrong for the right reason.
“…we cannot start with any distribution of carbon among the carbon reservoirs and from that determine what a prior distribution may have been.”
I agree that we can’t know the exact past distribution. That’s why I always call my back calculation an estimate. The fact that it is based on a simple exponential function and nails the Mauna Loa data gives me confidence that the estimate is pretty darn close to accurate. I think I remember finding other ways to fit the data, but not both using constant Te and extrapolating back to around 280 in 1750.
David Andrews
July 27, 2025 at 9:16 am
“I fear you are purposely wasting my time…”
Sir, no one demands you comment here. If you feel compelled to respond, that’s on you.
Answer to 1. From year 2018, I estimate NE was 91.9 ppm and NAb was less than 89.5, therefore they were not the same. It was a typical year with natural contributing 2.5 ppm more than the year before.
2. In 2018, I estimate at least 4.5 ppm of human-sourced carbon was removed, almost as much as was emitted that year. I haven’t estimated how much human-sourced carbon returned to the atmosphere, but it’s a relatively small amount. That’s because human-sourced carbon in the ocean is diluted and the return is proportional to that diluted concentration.
3. My answer in 2 perfectly follows the equivalence principle. It’s what Dr. Ed’s article is all about.
I am pleased to find you are OK with a biosphere expansion. Your physical principles are based on Magic Math, not laws of nature. That may be why you avoid time-constants.
I think my problem is your problem accepting the consequences of biosphere expansion, because “Pretty soon you have “exponentially” increasing natural emissions.”
Ed,
Gosh, I thought the two points I have been making were pretty simple.
1. Since the atmosphere has been accumulating carbon at a rate slightly less than half the rate we have been adding it, natural proccesses must on balance have been removing carbon to the land/sea reservoirs, not adding it to the atmosphere.
2. The continual mixing between reservoirs homogenizes their content. That makes it incorrect to assume, as you do, that the small “human carbon” content of the present atmosphere implies only a small contribution to the rise from human emissions.
Which of these points do you find too complicated? You have had a few years to study them.
David Andrews July 27, 2025, at 2:34 pm
David, it is your duty show how your equations derive from my (2). Without that connection, all your claims and questions are without a foundation.
Is that too complicated for you to do?
Ferdinand Engelbeen July 27, 2025 at 11:38 am
Dear Ferdinand,
You wrote:
Your admission (1) is all that is needed. Thank you. Therefore, your model supports a shorter Te, which corresponds with the shorter Te revealed by the Delta14C data.
Your argument (2) is invalid because the Delta14C data show the Delta14C balance level was unaffected by the bomb tests, and the Delta14C balance level shows the proportion of the human carbon balance level to the natural carbon balance level.
For example, if human carbon caused all the CO2 increase, that would have lowered the Delta14C balance level to -333. Clearly, this has not happened.
The Delta14C balance level is between zero and -8. That means Te is much smaller than 4 years. This proves your Tau of 50 years is invalid.
Remember, the balance levels are determined by the present (not past) inflows of natural carbon and human carbon. There is no “replacement” argument that affects the balance level argument. Pure natural carbon has a Delta14C of zero.
Therefore, your arguments (1) and (2) converge to two simple conclusions: Te is smaller than 4 years and human carbon has a negligible effect on the level of atmospheric CO2.
Ed,
The topic is whether human emissions cause the CO2 increase, i.e, your H1. Carbon conservation and the measured positive net global uptake prove that they do.
Your C14 analysis is a joke.
David Andrews July 27, 2025 at 7:15 pm
David, you have just proved what I suspected.
You cannot connect your so-called argument with my equation (2).
Therefore, you have no argument. You are not even in the game.
You have been an imposter acting as if you knew something about this subject.
I asked you a very simple question related to the core of this discussion, which is equation (2).
This is simply physics, David.
Your unstated answer is that you don’t know how to connect your ramblings to equation (2).
Thanks for this revelation.
Ferdinand Engelbeen
July 27, 2025 at 9:25 am
Hopefully, something from my response to Ed at July 27, 2025 at 12:46 pm helps explain some of the confusion. It’s ironic that you cite self fulfilling prophecy while your whole model is based on self-fulfilling prophecy. At least I know why it is, as I’ve explained.
I’ll skip your real decay rate paragraph until I study the spreadsheet.
You claim, “you don’t reflect what Spencer, me and others have done….” I don’t understand how you can say that when I duplicated Spencer’s spreadsheet fully and exactly as he published it. I even downloaded an original version when he posted it on his website five years ago. His model is one-way outflows. If you have a problem with that, take it up with him. My model has both natural and human emission inflows, I just don’t assume a constant natural inflow as you do. I will add graphics for both our data and see which does a better job correlating Mauna Loa data.
My model doesn’t have a change in Te. Of course there’s a constant outflow/level. Nature is increasing its outflow as it strives to reach its new balance level, to put it in Dr. Ed’s vernacular.
“How do you know these inputs?” As explained to Ed, from fitting the Mauna Loa data assuming constant Te. It makes sense, because it goes to the likelihood that human activity, such as burning and growing stuff, increases CO2 output exponentially.
You may have “definitive proof that the oceans are the dominant cause of the CO2 changes in pre-industrial times,” but I don’t see how that rebuts anything I have proposed.
Not supporting not supporting the mainstream “catastrophic” science does not make one outside the climate community. Spencer complains about being boxed in on either side.
I’m not “completely mistaken.” Dietze calculated 55 years, because he didn’t have a quarter century more data that we have. But he got it the same way, a plot of CO2 versus deltaCO2 and assumed the same wrong formula you and the rest use. Again, I say wrong only happy to be shown otherwise. By the way, I have a scientific reason for assuming a constant Te: what physical processes have changed that warrant a variable Te?
Jim Siverly, July 27, 2025 at 8:19 pm
“His [Spencer’s] model is one-way outflows”
Spencer’s and many other’s and my model is about NET outflow, not one-way outflows…
“Cn = Cn-1 + EHn – ( Cn-1 – C0 ) / 50”
That is about the same formula that I used in my calculations:
La(n) = La(n-1) + Ff_start – (La(n-1) + Ff_start-La_base)/Te
I used the “In between” La(n-1) + Ff_start to calculate the net flow, Spencer used the “old” C(n-1).
Further, my calculations were asked to use a fixed 10 PgC/yr FF supply and not the real figures for Mauna Loa and the real supply.
Both Spencer’s and my approach doesn’t involve inflows or outflows at all, only net flows. Dr. Ed wanted to see what the in- and outflows do. That I did extra by looking at what the inflows and outflows could be.
So Spencer and I agree with each other. And you don’t agree:
“Notice the removal is NET removal of only 2%/year based on fitting the Cn results to the Mauna Loa data.”
Here we still agree.
“So the 50-year figure is an artifact of the assumption that the removal process is proportional to difference between now and way back when.”
Here again, we strongly disagree: The 2%/year figure is the observed (!) decay rate for every CO2 level increment in the atmosphere since Mauna Loa started its measurements. Thus not based on any past known or unknown “old” equilibrium.
“Observed” in that way that human emissions are quite accurately known from taxes on sales and burning efficiency and the increase in the atmosphere is very accurately known from measurements.
To the contrary, one can back-calculate the current equilibrium from the observed decay rates since 1958 as Spencer and many others and I and David Burton have done.
“As explained to Ed, from fitting the Mauna Loa data assuming constant Te. It makes sense, because it goes to the likelihood that human activity, such as burning and growing stuff, increases CO2 output exponentially.”
I didn’t talk about the outputs which are based on Te. I was talking about the inputs to the atmosphere, which have nothing to do with Te from the atmosphere, but with the Te from the oceans and the Te from the biosphere.
You used the Mauna Loa data to calculate the total input as a fit for the net removal of CO2 out of the atmosphere, while you don’t have any idea what the real inputs are. That is just curve fitting…
Moreover, for the mass balance: even in your calculations, the new inputs are less than the old outputs, thus nature NET removed CO2 mass out of the atmosphere, about half what humans as FF mass added in the previous year. Any bookkeeper will confirm you that the FF addition is the cause of the increase, no matter how much FF “labeled” CO2 returns to the atmosphere within the next season or next year(s).
Human activity increased the CO2 levels in the atmosphere with about 50%. The overall outputs into the oceans increased with 33% and in the biosphere with 13%. Not 50%. Thus Te, based on the 4 years La/F(out) was not constant and increased over time. The Te of 50 years, based on the NET outflow remained more or less constant.
Dr. Ed, July 27, 2025 at 7:03 pm
“Therefore, your model supports a shorter Te, which corresponds with the shorter Te revealed by the Delta14C data.”
I am not that familiar with the delta 14C data, but as far as I know the delta Te for 14C after the nuclear bomb tests is between 12 and 20 years, far beyond the 4 years Te that you use for the bulk CO2 output…
“Your argument (2) is invalid because the Delta14C data show the Delta14C balance level was unaffected by the bomb tests”
To the contrary, the 14C level before the bomb test was already affected by the zero-14C human FF supply, so that correction tables for radiocarbon dating were needed and after the bomb tests, the drop in 14C was way faster than calculated without FF emissions. In the coming decades, the 14C level will further drop to below the historical levels:
https://www.ferdinand-engelbeen.be/klimaat/klim_img/graven_14C.png
I have done calculations on the “thinning” of the δ13C human “fingerprint” in the atmosphere and that shows that about 2/3 of the human FF CO2 input directly into the atmosphere is replaced by CO2 from other reservoirs, mainly by deep ocean exchanges. Replaced, not removed as CO2 mass. One can calculate how much deep ocean water is needed to do that replacement: about 40 PgC exchange with the 1,000 year old deep ocean waters is sufficient.
https://www.ferdinand-engelbeen.be/klimaat/klim_img/deep_ocean_air_zero.jpg
0 PgC/year is the δ13C drop if all human FF emissions remained in the atmosphere…
And last but not least, as already explained to Jim, your Te of 4 years for the bulk CO2 in the atmosphere increased over time, because the total level of CO2 in the atmosphere increases with 50%, but the in/outflows with the oceans increased only 33% and with the biosphere only 13%…
Jim,
What you derisively call “Magic Math”, and Ed calls “too complicated”, I call “carbon conservation” and dead simple. Conservation principles are the bedrock of physics.
I looked for your spreadsheet on Ed’s site and didn’t find it, so I will continue to have to guess what you are up to. Your 7/27 9:16AM post, and talk of “extra carbon”, suggests that you are postulating a new category of carbon in addition to “human” and “natural”. (Demetris Koutsoyiannis tried the same thing. After I labeled his new category “super-natural carbon” he dropped it.) Perhaps you think some source like deep-sea volcanos is important and underestimated. Like FF, it would be an uncompensated transfer into the fast carbon cycle from a previously sequestered stock. But such a source is already included in the mass balance calculation. You might want to check your spreadsheet to see if human emissions are 2x atmospheric carbon growth as in the real world.
Your insistence that the equivalence principle does not allow balanced exchanges to move net “human carbon” from the atmosphere where it is dense to land/sea reservoirs where it is sparse is bonkers.
Ferdinand Engelbeen July 28, 2025 at 3:41 am
Dear Ferdinand,
I’m sorry but your explanation does not save your failed hypothesis.
You admit that you are not familiar with the Delta14C data. Therefore, you are not in a position to argue that it does not prove your hypothesis is wrong. You have not studied my papers and my rebuttal above to your CO2 Coalition paper.
When you understand the Delta14C level, you will see that we are not talking about the Te of Delta14C, which happens to be 16.5 years, and all your (and Dave Burton’s) calculations of this value are incorrect.
The key feature of the Delta14C data is that it proves its balance level has remained and still is less than about 8% below its historic balance level upon which all carbon dating is based.
You wrote:
“To the contrary, the 14C level before the bomb test was already affected by the zero-14C human FF supply, so that correction tables for radiocarbon dating were needed and after the bomb tests, the drop in 14C was way faster than calculated without FF emissions. In the coming decades, the 14C level will further drop to below the historical levels:
https://www.ferdinand-engelbeen.be/klimaat/klim_img/graven_14C.png.”
Indeed, human CO2 has lowered the Delta14C balance level a small amount below its long-term balance level. No problem with that. But that supports my calculations that show human CO2 has had only as small effect on the CO2 increase above the reference level of 280 ppm.
The key is that the present Delta14C balance level DOES NOT support your claim that human CO2 is a significant cause of the CO2 increase. It shows that natural CO2 is the dominant cause of the CO2 increase. There is no way you can deny this.
You wrote:
“I have done calculations on the “thinning” of the δ13C human “fingerprint” in the atmosphere and that shows that about 2/3 of the human FF CO2 input directly into the atmosphere is replaced by CO2 from other reservoirs, mainly by deep ocean exchanges. Replaced, not removed as CO2 mass.”
Sorry, but the Delta14C proves your calculations are wrong. Your hypothesis predicts an incorrect result. Therefore, your hypothesis is wrong.
You wrote:
“And last but not least, as already explained to Jim, your Te of 4 years for the bulk CO2 in the atmosphere increased over time, because the total level of CO2 in the atmosphere increases with 50%, but the in/outflows with the oceans increased only 33% and with the biosphere only 13%…”
Sorry, but the Delta14C data prove your above conclusions are wrong.
David Andrews July 28, 2025 at 9:03 am
David,
I can’t believe you are back with more of your math-deficient, hand-waving declarations that have no connection to real physics or to the issue under discussion.
You wrote to Jim:
“What you derisively call “Magic Math”, and Ed calls “too complicated”, I call “carbon conservation” and dead simple. Conservation principles are the bedrock of physics.”
But you have not shown anywhere that you are following conservative principles.
I asked you to derive your physics and math from my equation (2), which I connect with (1) to assure carbon mass conservation. So, all my work is based on carbon mass conservation because all my equations are derived from (1).
You can make no such claim legitimately. So, you resort to hand-waving statements. Maybe you should go into politics and forget physics.
You wrote toJim:
“You further claim that the climate equivalence principle does not allow balanced exchanges to move net “human carbon” from the atmosphere where it is dense to land/sea reservoirs where it is sparse is bonkers.”
Your argument is invalid, David, because you have no physics equations to even follow how carbon flows between the carbon reservoirs.
Please, next time you come back, please show us how you derive your imaginary model in terms of equations that derive from my (1) and (2).
Ferdinand Engelbeen
July 27, 2025 at 9:31 am
I will try to catch up and not duplicate too much. I was working on dropbox and Windows issues.
“Can you elaborate on that, where the input data to the atmosphere are based on?”
I think I answered this already in response to Dr. Ed. I’ll repeat with a better explanation, hopefully. I could see from Spencer’s original spreadsheet that he had no contribution from natural emissions. By default, his model assumes them to be whatever they are. Whether he started with a Dietz/Burton/Engelbeen-derived Tau and then found the Mauna Loa fit or first tweeked the fit and then found the same Tau as you and others, I don’t know. It’s a question for Dr. Spencer that I was too ignorant to ask at the time. What is clear, is that he assumed the removal rate was proportional to the difference between the pCO2 now and whatever it was in 1750. Just as Deitz, you, and others do.
Sensing this was wrong, I added natural emissions of about twenty times the human emissions and assumed the removal rate was directly proportional to whatever the pCO2 was in the current year. Then I had to figure out what the natural emissions would have to be to get a fit to the Mauna Loa data. That took a while, but was enabled by assuming the formula was exponential. I didn’t put the equation in the “Jim fluxes” spreadsheets, because it was originally in terms of ppm and I didn’t take time to convert it to PgC. So I just copied and pasted the ppm values and then converted to PgC. Call me lazy, but actually I was pressed for time. Now with all your questions, I’m even more pressed for time because I want to finish reading the Dietz comments.
With the appearance of your 20-year spreadsheet, I was able to attempt a back calculation, but failed. However, back calculation on Spencer worked perfectly. Next, I used the same approach to back calculate my spreadsheet. Because I had the extra variable, natural emissions, I could only do 1959 to 2018 where I had both Cn and Cn-1. So prior to 1959, I just used natural emissions from my original data fit. The formula to back calculate the Mauna Loa era natural emissions is
ENn = Cn – Ehn – Cn-1 * ( 1 – 1/Te )
I amended my spreadsheet to show the exponential equation and a graph of the fit. I noticed the exponential estimate at 2019 (cell AA274) was off by about 1 PgC. That’s not bad, considering my fit was an eye-ball one. Also, there was an error at cell AA214, which was corrected by replacing the wrong back-calculation formula with the exponential formula.
https://www.dropbox.com/scl/fi/ojyikq5ds5wgl6g5b0jsp/Jim_fluxes3.xlsx?rlkey=9lzxmuc33j6qs1hcgngy5mxtd&dl=0
July 27, 2025 at 12:19 pm
“…Again in complete ratio with the “old” equilibrium… all three reservoirs do sink CO2 in ratio to the “old” equilibrium.”
You continue to apply anecdotal data to validate your preconceived notions. Unscientific and unsatisfactory. This may fly at climate conferences, but I suspect you will continue to get pushback from anyone outside the Tau camp.
To be continued…
Dr. Ed, July 28, 2025 at 9:24 am
“You admit that you are not familiar with the Delta14C data.”
I didn’t say that I don’t know anything about the Δ14C data, but I haven’t looked at it with the same depth as for the δ13C data… David Burton did a lot of work on it and I am pretty sure that he has done a good job in our common work.
But here a graph I made already 20 years ago to show how the Δ14C data from the bomb tests are “diluted” by the deep ocean waters, making the bomb tests peak decay rate a lot faster than for an extra input of bulk 12/13CO2:
https://www.ferdinand-engelbeen.be/klimaat/klim_img/14co2_distri_1960.jpg
Of all CO2 as mass in 1960, about 97% returned back as mass from the deep oceans in the same year as absorbed. From the bomb tests, only 45% of 14C as “mass” returned in the same year, the rest did just begin their ~1000 year journey…
That makes that your calculation of the “fixed” 14C balance is completely at odds with reality, because you haven’t taken into account the ~1000 years delay between the extra 14C uptake and the current 14C “old” release.
Thus the decay rate of Δ14C from the bomb tests is much faster than the decay rate of about 50 years for an extra input of FF CO2 and moreover has absolutely nothing to do with the 4 years turnover time, which is the base for your Te…
The same happens with the 13C/12C ratio, which is “diluted” by 13C rich (compared to FF) deep ocean returns.
Thus looking only at 14C and 13C/12C ratio’s give you an underestimate of the real cause of the CO2 increase in the atmosphere, for the simple reason that an exchange in isotopes without a change in total mass has nothing to do with the decay rate of an extra CO2 mass (of whatever composition) in the atmosphere.
“Therefore, you are not in a position to argue that it does not prove your hypothesis is wrong. You have not studied my papers and my rebuttal above to your CO2 Coalition paper. ”
Wow. I have studied your papers in depth and that was a reason to react here. I still wonder why a clear explanation of the current scientific knowledge does stir so much controversy and hostile comments from some in the skeptic community… Maybe because one doesn’t like the result?
Take you stance against our graph nr 11 of the uptake/release of O2 as proof that nature is a net sink.
https://www.ferdinand-engelbeen.be/klimaat/klim_img/bolingraph.gif
You say:
“Figure 11 assumes H(1) is true. On that basis it plots O2 concentration as a function of CO2 concentration, assuming human CO2 causes all the CO2 increase”
Which is a complete false accusation. Nowhere is “assumed” that humans cause all the CO2 increase. All what was plotted is the calculated O2 use and CO2 increase from burning fossil fuels at the right side, based on sales (taxes) and burning efficiency, the observed decrease in O2 and increase in CO2 at the left side and the calculated O2 production of the biosphere to fill the gap between calculated and observed O2 use. When plants absorb CO2, they release O2 in equivalent amounts, thus plants also reduced the CO2 increase in the atmosphere. The oceans filled the remainder of the CO2 uptake.
Nowhere is there a NET natural release of CO2. None. All based on observations and direct calculations from observations.
Jim Siverly
July 28, 2025 at 11:47 am
“What is clear, is that he assumed the removal rate was proportional to the difference between the pCO2 now and whatever it was in 1750. Just as Deitz, you, and others do.”
Jim, again… Neither Spencer, or I or most other skeptics of the alarmist “catastrophic” global warming used the old equilibrium as base for the 50 years decay rate of extra CO2 in the atmosphere. Only Dietze did that, because the time period to calculate Te/Tau over a longer period was rather short.
As you have calculated yourself, the Te of the NET removal rate during the Mauna Loa time indeed is 2% of the increase, over any time period that you want (beyond the year-by-year noise). That points to a exponential decay rate, where the response is linear in ratio to the increase of CO2 in the atmosphere.
One then can calculate back to the zero net decay, where the true equilibrium is. Again: we didn’t use that in reverse.
Here the plot in real order:
https://www.ferdinand-engelbeen.be/klimaat/klim_img/acc_decay.png
A is the sum of all emissions, the observed increase in the atmosphere and the influence of T on the pCO2 of the oceans. That is a small change in ΔpCO2. If you don’t like it, just drop it. If you want the absolute sinks, be my guest and do the same calculations with a full ΔpCO2 from the atmosphere to zero pCO2. Gives you either some 16 PgC/year pressure dependent CO2 output flow (with the 50 year Tau plus 195 PgC/year non-pressure dependent outflows) or a lot longer Te/Tau…
B is the calculated net sink rate per year from A: increase minus emissions. Independent of the absolute height of CO2 in the atmosphere, only dependent of the difference between increase in the atmosphere and increase in emissions.
C is the calculated Te/Tau from A and B.
The order of calculation is from A to C. Not reverse…
No need to know or calculate or estimate any (uncertain) out- or inflow from or to the atmosphere, as we have much more accurate net outflow calculations…
Ferdinand Engelbeen
July 28, 2025 at 2:55 am
“Both Spencer’s and my approach doesn’t involve inflows or outflows at all, only net flows.”
I consider that a confession. Let’s examine net flows. I claim the 50-year figure is an artifact of the assumption that the removal process is proportional to difference between now and way back when. That doesn’t sound like net flow to me. Yet the removal (decay) rate both you and Spencer use is ( Cn-1 – Co ) / 50.
How is that a net flow? That basically says net flow is the amount of annual FF emissions that nature couldn’t remove, because she only removes a fiftieth of the difference of what’s in the atmosphere now and what she remembers it was in 1750. Unbelievable.
“The 2%/year figure is the observed (!) decay rate…Thus not based on any past known or unknown “old” equilibrium… “Observed” in that way that human emissions are quite accurately known…and the increase in the atmosphere is very accurately known from measurements.”
Your “not based on any past known or unknown “old” equilibrium” is contradicted by your use of ( Cn-1 – Co ) / 50. Can’t you see that? It’s circular logic. You observe the 2% rate from the slope of the plot of delta C vs C. Then you all use the intercept as the 1750 Co value Spencer, for example, used to produce his Mauna Loa data fit. To do that you have to assume no change in natural emissions and ignore e-time for the “no change in natural emissions” scenario changing from 3.14 to 4.86 years.
“That is just curve fitting…” Of course. What do think Spencer was doing using 0.02/year and 294 ppm to fit the Mauna Loa data? One makes certain assumptions to formulate a model. One can use the wrong assumptions and formulas and still get a good fit. Which assumptions are more physically correct is the question to be answered.
Finally, for your two last paragraphs, Magic Math bookkeeping is not scientific and even if your 33% and 13% numbers were accurate to the PgC, 46% is darn close to 50%.
Ferdinand Engelbeen
July 28, 2025 at 12:42 pm
Do you deny that your spreadsheet uses “the old equilibrium as base for the 50 years decay rate of extra CO2 in the atmosphere” after you just acknowledged both you and Dr. Spencer use ( Cn-1 – C0 ) / 50 as your decay rate in your formulas?
Please don’t use e-time Te when you mean adjustment time Tau, as in, “the Te of the NET removal rate.” The jargon is confusing enough as it is. While we are on the subject, “decay” is not appropriate for the current situation with increasing FF emissions and quite possibly increasing natural emissions, as well. As I have shown, there is no need to use anything but Te of about 4 years. Furthermore, there is no data that definitively proves that the atmosphere will decay to preindustrial times with an e-time of 50 years. That is a purely speculative model-based assertion of the Tau camp.
You have shown the acc_decay.png diagram with plots A, B, and C maybe a dozen times and I never really understood how you calculated the e-folding times. Would it be possible to show the formulas? Otherwise I have no idea how you “calculate back to the zero net decay, where the true equilibrium is.”
Ferdinand Engelbeen July 28, 2025 at 11:59 am
Dear Ferdinand,
1. Dave Burton does not correctly explain the Delta14C data.
2. Your old graph does not show the information that my plot shows.
3. The return of the Detla14C to its original zero-balance level after the bomb tests proves the Delta14C balance level remained near zero even as the bomb tests increased Delta14C.
4. The bomb tests had no effect on the natural inflow of Delta14C or its balance level of zero.
5. Since 1950, increased human 12C emissions caused an inflow of carbon with a Delta14C of -1000. This sets a balance level that reflects this inflow and this human carbon balance level mixes with the natural carbon balance level of zero.
6. Your hypothesis that “about 97% returned back as mass from the deep oceans in the same year as absorbed” is neither relevant nor backed by data.
7. Your hypothesis that “From the bomb tests, only 45% of 14C as “mass” returned in the same year, the rest did just begin their ~1000-year journey…” is imaginative.
8. The natural Delta14C inflow before the bomb tests continued during and after the bomb tests. The is no basis in data to claim that this natural inflow changed.
9. Your comment that my “calculation of the “fixed” 14C balance is completely at odds with reality” is incorrect. First, I do not consider the 14C balance level. Second, I use the Delta14C balance level that exactly matches excellent data.
10. Your comment that I “haven’t taken into account the ~1000 years delay between the extra 14C uptake and the current 14C “old” release” is irrelevant and ridiculous. I use the natural and human inflows since 1950, which is all that matters.
11. You wrote, “the decay rate of Delta14C from the bomb tests is much faster than the decay rate of about 50 years for an extra input of FF CO2.”
Indeed, it is. We can measure its Te at 16.5 years with a balance level of zero, proving your 50 years is imaginary.
12. The rate return of Delta14C back to its original balance level is set by its Te. A longer Te would have slowed the outflow of carbon from the atmosphere and extended the time for Delta14C to return to its balance level.
The Te of the return (16.5 years) rules out your hypothesis that Te (or Tau) is 50 years.
13. You commented that Delta14C “and 13C/12C ratio’s underestimate of the real cause of the CO2 increase in the atmosphere, for the simple reason that an exchange in isotopes without a change in total mass has nothing to do with the decay rate of an extra CO2 mass (of whatever composition) in the atmosphere.”
Your comment is not true. The Delta14C balance level is the combined balance level set by the Delta14C inflow with a balance level of zero and the human carbon inflow with a balance level of -1000. Delta14C data show the contribution of human carbon is very small.
You bring up an additional point separate from the above discussion:
This regards your Figure 1.4.2:O2-CO2trends 1990–2000, figure from the IPCC TAR (2003), that is also my draft Figure 11.
You wrote, “Nowhere is it “assumed” that humans cause all the CO2 increase.”
Well, this figure has an arrow titled “fossil fuel burning” that goes from 352 ppm to 382 ppm, and an arrow titled “atmospheric increase” that goes from 352 ppm to 367 ppm.
These arrows assume human CO2 emitted between 1990 to 2000 caused the CO2 level to increase from 352 ppm to 367 ppm.
Without this assumption, the figure should have named the arrows to, say, “total human CO2 inflow” and “net human CO2 inflow.”
The figure does not allow that natural CO2 might have caused some of the CO2 increase.
Jim Siverly, July 28, 2025 at 2:19 pm
“I claim the 50-year figure is an artifact of the assumption that the removal process is proportional to difference between now and way back when. ”
Sorry, my fault. Indeed figure C of the graph I sent is the calculation relative to the “old” equilibrium plus a small increase in equilibrium, due to the increased SST since 1850.
1. Let us begin with clearing some confusion about the differences in definitions…
Te (Berry) and τ/Tau (general) and Ta (IPCC) meanings are exactly the same: all assume an exponential decay rate for any change in one of the reactants of a process in equilibrium. That is the time needed to reduce the change to 1/e of the original disturbance in all three definitions. Only the exact figures are quite different.
In the case of Te, Berry and several others and you use the 4 years turnover/residence time, where a one-shot extra CO2 in the atmosphere follows the same decay speed as the overall output rate, which only is allowed if (and only if!) all outflows are unidirectional and no back flows are involved ánd if (and only if!) all outflows are driven by the CO2 pressure in the atmosphere. In that case Te = C/Fout and thus Fout = C/Te (equation 2 of Berry).
For any single CO2 molecule in the atmosphere, the turnover/residence time is always applicable, but only in that case the CO2 mass transfer is the same as the CO2 molecule transfer and both Te and Tau are equal:
https://www.ferdinand-engelbeen.be/klimaat/klim_img/mass_fluxes_classic.jpg
In the case of τ/Tau, that is the time needed to remove 1/e of the disturbance relative to the (“original”) equilibrium for a one-shot impulse.
If (and only if) the net (important: net!) output is in exact ratio to the change in disturbance, it doesn’t matter over what time frame Tau is calculated, even if the equilibrium is not known at all.
That is the case for both the oceans and vegetation (up to over 1,000) ppmv. Thus one doesn’t need the “original” equilibrium to know Tau.
Only in the case that all flows are unidirectional and all outflows are CO2 pressure related, then Tau = Te. In all other cases, Te and Tau are completely independent of each other:
https://www.ferdinand-engelbeen.be/klimaat/klim_img/mass_fluxes_real.jpg
The Ta of the IPCC’s Bern model is model based and assumes saturation of all reservoirs for CO2, which is only the case for a large part of the ocean surface. Not to over 1,000 ppmv for vegetation and not for the next thousands of years for the deep oceans, even if we burn lots of coal, oil and gas…
In all cases, it doesn’t matter that the input is a one-shot amount of FF CO2 or a continuous, increasing, supply of FF CO2. The (net) removal rate is a function of the total amount of CO2 in the atmosphere (for Te) or the difference between the total amount of CO2 in the atmosphere and the (old) equilibrium, thus the total increase over time, not only the extra input of one year.
2. The calculation of Tau.
If (and only if!) the net (!) output is directly proportional to the extra level in the atmosphere, then the formula for Tau is quite simple:
Tau = disturbance / effect
Or in the case of the atmosphere and what I used in graph C for each year:
Tau = [pCO2(atm) – pCO2(eq)] / net output
Where net output = outputs – inputs = FF emissions – increase in the atmosphere (= graph B).
As we know the FF emissions and the increase in the atmosphere quite exactly, there is no need to know any inputs or outputs or the sum of these, to know the net output with high accuracy.
Indeed I used the “old” equilibrium, but because the net outputs in this case are in exact ratio to the height of the change, one can use the current changes to obtain the current Tau.
That makes that one can calculate Tau from the accurate data from 1958 on.
Here the “old” equilibrium based Tau’s compared to the 10-year moving “modern” Tau’s.
Calculated with Tau(n) = [C(n) – C(n-9)] / [Fnetout(n) – Fnetout(n-9)]:
https://www.ferdinand-engelbeen.be/klimaat/klim_img/decay_10.png
The modern Tau seems to be somewhat higher (~55 years) in average than the “old” Tau, based on the old equilibrium. The old Tau was calculated on the polynomial through the net sink rates, that gets of course a lot less noise…
This calculation of Tau doesn’t involve any knowledge of CO2 in- or outfluxes or “old” equilibrium or natural/FF CO2 ratio…
Even if the atmospheric in- and outflows doubled over time (halving the turnover/residence time and thus your Te), that has zero influence on the net removal rate of CO2 out of the atmosphere, because only the difference between inflows and outflows is what changes the total mass of CO2 in the atmosphere, not how much comes in and goes out. The latter only determines the net outflow in the case that all outflows are CO2 pressure related, which for 95% is not the case in the real world…
As the 50-55 year Tau is clearly working over the full 170 years of human emissions, up to now, I don’t see any reason to assume that without human emissions the CO2 levels will not return back to the old equilibrium.
Except if you accept the hundreds to thousands years of the IPCC’s Bern model…
Dr. Ed, July 28, 2025 at 5:11 pm
1. “Dave Burton does not correctly explain the Delta14C data”.
There is some discussion with David Andrews, but David Andrews completely rejects your calculations. So, who is right? I am more confident in Andrews’ calculations than in yours, because of my past experiences…
2. “Your old graph does not show the information that my plot shows”.
It shows information that is not in your plot: that a large inflow of ~1,000 year old CO2 from the deep oceans returns today to the atmosphere. That CO2 is not contaminated by atomic bomb tests and fossil fuel emissions and thus is an important input that “dilutes” the δ13C and Δ14C input from the current FF input.
3.-5. “The return of the Detla14C to its original zero-balance level after the bomb tests proves the Delta14C balance level remained near zero even as the bomb tests increased Delta14C.”
The return is not yet ended and will go to below zero for Δ14C.
6.-7. “Your hypothesis that “about 97% returned back as mass from the deep oceans in the same year as absorbed” is neither relevant nor backed by data.”
The data for 1960 show a net uptake by oceans and vegetation, of which about 25% is absorbed by the biosphere, 5% by the ocean surface and 20% by the deep oceans.
The “dilution” of the δ13C data (and estimates from deep ocean sinks) shows a deep ocean-atmosphere flux of about 40 PgC/year. The level of Δ14C some 1,000 years ago was about 50% of the bomb tests and with a 10% radioactive decay that gives a 45% return of what did go into the deep oceans in 1960.
These were not exact worked-out figures, but give an indication of why the decay rates of δ13C and Δ14C are much faster than of the bulk mass removal of any extra CO2 injected in the atmosphere.
8.-10. Not relevant.
11.-12. “The rate return of Delta14C back to its original balance level is set by its Te. A longer Te would have slowed the outflow of carbon from the atmosphere and extended the time for Delta14C to return to its balance level.
The Te of the return (16.5 years) rules out your hypothesis that Te (or Tau) is 50 years.”
Again, you are mixing the decay of an isotopic ratio with the decay of the CO2 mass. The isotopic ratio is “thinned” by deep ocean returns, which you (and the IPCC) have not in your (or their) calculations. That makes that the Te for the isotopic ratio’s of δ13C and Δ14C are faster than for the total extra mass of CO2 in the atmosphere. The faster decay of the isotopic ratio’s in no way rules out the observed decay of 50-55 years of the extra CO2 mass in the atmosphere, but it rules out the 4 years Te, which has no bearing at all in the net (!) removal rate of any extra CO2 injected in the atmosphere.
13. “Your comment is not true. The Delta14C balance level is the combined balance level set by the Delta14C inflow with a balance level of zero and the human carbon inflow with a balance level of -1000”
And an input of ~1,000 year old pre-industrial CO2 with higher δ13C and lower Δ14C than in the current atmosphere…
Then we have figure 11 as example how your comments are at odds with what we did write:
“Well, this figure has an arrow titled “fossil fuel burning” that goes from 352 ppm to 382 ppm, and an arrow titled “atmospheric increase” that goes from 352 ppm to 367 ppm.
These arrows assume human CO2 emitted between 1990 to 2000 caused the CO2 level to increase from 352 ppm to 367 ppm.
Without this assumption, the figure should have named the arrows to, say, “total human CO2 inflow” and “net human CO2 inflow.”
The figure does not allow that natural CO2 might have caused some of the CO2 increase.”
“fossil fuel burning” and “total human CO2 inflow” are equivalent. So far so good.
“atmospheric increase” is what is measured at Mauna Loa and is “net human CO2 inflow.” as mass, as that is what remains as human “caused” CO2 mass in the atmosphere.
“The figure does not allow that natural CO2 might have caused some of the CO2 increase.”
That would be quite difficult: if FF CO2 is already larger than what is measured as increase in the atmosphere, then the natural flows only can net (!) remove CO2 out of the atmosphere.
What doesn’t imply that all human FF molecules still reside in the atmosphere. Even if all FF CO2 molecules were exchanged with “natural” CO2 molecules, that doesn’t change the fact that the increase in CO2 mass is fully caused by the FF emissions…
Thus we didn’t “assume” that FF emissions are the cause of the increase. The data show that the increase (as mass!) in the atmosphere is caused by the addition (as mass!) of more FF CO2 than is observed as increase in the atmosphere…
Ferdinand Engelbeen
July 29, 2025 at 4:23 am
I appreciate your interpretation of the e-time terminology. I would prefer and recommend we make a distinction between Te which is based on absolute concentrations, as I and Dr. Ed use, and Tau based on net flows proportional to century-long concentration differences. Can we agree on that for the purposes of these discussions?
My second request is that you explain where you find the rule that my 4-year e-time is only “allowed if (and only if!) all outflows are unidirectional and no back flows are involved?” A standard two-compartment model of a one-time pulse will always have bidirectional flows between the compartments. My model doesn’t show the second compartment, but that is where the “mostly” natural inflow to the atmosphere is coming from. If you like, I will link to a website demonstrating how the equations are derived.
Next, do you have an experimental evidence of “Classic view 2020” shown in your first link?
Can we agree that saturation of any reservoir is irrelevant because surface ocean CO2 goes to the deep and from there to the ocean floor? Nothing stops those processes continuing to infinity, if you apply realistic physical-chemical processes.
Also, can we agree that your hypothesis of net removal rate being a function of the difference between the total amount of CO2 in the atmosphere and the (old) equilibrium has never been experimentally verified?
Thank you for the calculation of Tau details. I will work on that and respond back soon.
Ferdinand Engelbeen
July 29, 2025 at 4:23 am
I previously and mistakenly assumed your smooth curve generating old Tau came from the linear fit you showed in graph B. Now you say it comes from a polynomial regression. Is that of Fnetout values? I was not able to duplicate your modern Tau data in your second link. What are the formulas for Fnetout(n) and Fnetout(n-9)?
I am trying to verify your claim, “This calculation of Tau doesn’t involve any knowledge of CO2 in- or outfluxes or “old” equilibrium or natural/FF CO2 ratio…” Until then, I prefer not to respond to the rest of your comment.
Ed,
Even the Trump Administration disagrees with you:
“The annual increase in concentration is only about half of the CO2 emitted because land and ocean processes currently absorb “excess” CO2 at a rate approximately 50 percent of the human emissions. Future concentrations, and hence future human influences on the climate, therefore depend upon two components: (1) future rates of global human CO2 emissions, and (2) how fast the land and ocean remove extra CO2 from the atmosphere. We discuss each of these in turn.”
Climate Working Group (2025) A Critical Review of Impacts of Greenhouse Gas Emissions on the U.S. Climate. Washington DC: Department of Energy, July 23, 2025
releasesd 7/29/25
Jim Siverly, July 29, 2025 at 10:42 am
Sorry, my fault: graph B indeed shows the linear fit, not the original polynomial that was used for the calculation. Doesn’t make much difference, except at the start and end of the calculations. Here the right one with the polynomial formula:
https://www.ferdinand-engelbeen.be/klimaat/klim_img/acc_decay.jpg
just replace the .png of the previous one with the .jpg of this one. I didn’t think about it, because the former one had the A/B/C marks and this one not…
That was used for the calculations of the “old” Tau’s, relative to the original equilibrium + the pCO2(eq) increase caused by the increase in SST since 1850, per formula of Takahashi.
The new Tau’s are based on the change in pCO2 of the atmosphere at Mauna Loa over a period of 9 years (not 10, was too much in a hurry, I suppose):
Tau(n) = [C(n) – C(n-9)] / [Fnetout(n) – Fnetout(n-9)]
Where C(n) and C(n-9) are the CO2 levels at Mauna Loa of the current year and 9 years back, thus the increment of CO2 in the atmosphere.
Fnetout(n) and Fnetout(n-9) are the calculated (raw) differences between increase in the atmosphere and human emissions for the current year and 9 years back in time, thus the net increase in absorption of CO2 mass, somewhere in other reservoirs, caused by the increase in concentration of CO2 in the atmosphere.
If the net removal of CO2 is directly proportional to the increase of CO2 in the atmosphere, then it doesn’t matter over what period one calculates Tau, even without any knowledge of the “old” equilibrium or the exact in- and outflows. One need only the observed increase of the pCO2 in the atmosphere and the calculated net uptake…