
by Dr. Ed Berry
Abstract
The above-ground atomic bomb tests in the 1950s and 1960s almost doubled the level of 14C, in the form of CO2, in the atmosphere. The D14C data show how the 14CO2 returned to its natural level after the termination of the bomb tests in 1963. A simple physics model accurately simulates how the level of 14CO2 returns to its natural level. However, there is some confusion among climate scientists about the meaning the units of D14C and PMC used to measure the 14C content. This note intends to clarify the meaning of these units.
Introduction
The atomic bomb tests of the 1950s to 1960s almost doubled the concentration of D14C in the atmosphere. After the above-ground tests were terminated in 1963, the D14C gradually decreased toward its natural value.
The 14C atoms were in the form of CO2, hereafter called 14CO2. The rate and manner of the decrease provides a useful measurement of how 14CO2 exits the atmosphere.
The 14C Data
Manning and Melhuish (1994) provide the D14C data taken at Wellington, New Zealand, from 1954 to 1993. Levin et al. (1994) provide the D14C data taken at Vermunt, Austria, from 1959 to 1983. We do not use their data because the following two papers include their data.
Hua et al. (2013) processed 14C data for both hemispheres from 1954 to 2010. We use the data in their “Table S2c – Global Δ14C for boreal summers (May-Aug).”
Turnbull et al. (2017) processed 14C data for Wellington, New Zealand, from 1954 to 2014. We use the data in their table “BHDCGO_MONTHLY_SMOOTH_CURVE, Output from bhd_smoothcurve.pro 2016112, D14C_trend.”
Kristina Eriksson Stenstrom et al. (2011) explain the units D14C per mil and percent Modern Carbon (pMC) used to measure 14C content in their equations (27) and (31) as follows:
D14C = ((Asn / Aon) -1) 1000% (1)
pMC = (Asn/Aon) 100% (2)
The activity ratio, Asn/Aon, represents the “natural” activity ratio before 1950 as 100 percent. To convert D14C data to pMC data, we replace the activity ratio in Eq. (2) with the activity ratio from Eq. (1). This gives:
pMC = (D14C / 1000) +1 (3)
The specific activity, Asn, is the count of radioactive decays per unit time and mass, expressed as counts per minute per gram C (cpm/g C). Aon is the count for a standard normalized sample that represents the count before the bomb tests.
Stenstrom et al. explain in their summary Table 2 that both D14C and pMC measure the “14C content” without reference to 12C.
The D14C data are in the form of D14C per mil. We will transform the D14C data into percent Modern Carbon (pMC) data.
Stuiver and Polach (1977) note that the “8th International Conference on Radiocarbon Dating” (Proceedings, 1972) accepted the replacement of D14C per mil by “percent Modern”.
Since pMC is merely a coordinate transformation of D14C, the Physics model replicates the 14C content the same for both units.
Fig. 1 shows the Hua et al. (2013) 14C data in pMC.
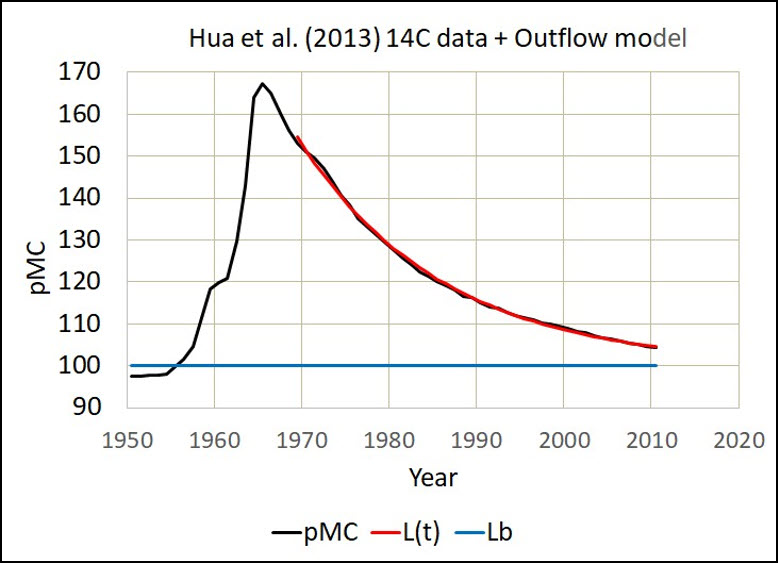
Fig. 2 shows the Turnbull et al. (2017) 14C data in pMC. The 100 line (blue) represents the normal level. The smooth red line beginning about 1970 is calculated by the Physics model.

Fig. 3 shows the Turnbull et al. (2017) 14C data in D14C. The normal level is zero. The smooth red line beginning about 1970 is calculated by the Physics model. The point of Fig. 3 is to show how the Physics model replicates the D14C outflow.

The red line in Figs. 1, 2, and 3 is the same model with the same residence time equal to 16.5 years. Clearly, the red line replicates the outflow of D14C.
References
Hua,Quan, Mike Barbetti, Andrzej Z Rakowski (2013): Atmospheric radiocarbon for the period 1950–2010. RADIOCARBON, Vol 55, Nr 4, 2013, p 2059–2072. 2013. https://doi.org/10.2458/azu_js_rc.v55i2.16177
Levin, I., B. Kromer, H. Schoch-Fischer, M. Bruns, M. Munnich, D. Berdau, J.C. Vogel, K.O. (1994): Atmospheric 14CO2 measurements from Vermunt, Austria Munnich, Institut fur Umweltphysik, Universitat Heidelberg, Im Neuenheimer Feld 366, 69120 Heidelberg, Germany. 1994. http://cdiac.ess-dive.lbl.gov/trends/co2/cent-verm.html
Manning, M.R., and W.H. Melhuish (1994): Atmospheric 14CO2 measurements from Wellington, New Zealand. National Institute of Water and Atmospheric Research, Ltd., Climate Division, Lower Hutt, New Zealand. http://cdiac.ess-dive.lbl.gov/trends/co2/welling.html
Stenstrom, K. E., Skog, G., Gerogiadou, Genberg. J., Johansson, A.(2011): A guide to radiocarbon units and calculations. Lund University, LUNFD6(NFFR-3111)/1-17/(2011). https://www.hic.ch.ntu.edu.tw/AMS/A%20guide%20to%20radiocarbon%20units%20and%20calculations.pdf
Stuiver, M. and Polach, H. (1977): Discussion Reporting of 14C data. Radiocarbon, Vol. 19, No. 3, 1977, P. 355-363. https://journals.uair.arizona.edu/index.php/radiocarbon/article/viewFile/493/498
Turnbull, Jocelyn C., Sara E. Mikaloff Fletcher, India Ansell, Gordon W. Brailsford, Rowena C. Moss, Margaret W. Norris, and Kay Steinkamp (2017): Sixty years of radiocarbon dioxide measurements at Wellington, New Zealand: 1954–2014. Atmos. Chem. Phys., 17, 14771–14784, 2017. https://doi.org/10.5194/acp-17-14771-2017
Ed,
Rather than clarify C14 analyses you confuse it by thinking of “pMC” and “D14C” as simply proportional to the C14 concentration, without reference to the rest of the carbon in a sample. See my comments elsewhere. If I were you I would take this post down now before others see it.
Dave
Ed,
I’m confused about residence time of human CO2 in the atmosphere. This article says that it is 16.5 years. (https://edberry.com/blog/climate/climate-physics/carbon-14-data-for-climate-research/). I understand your physics analysis to arrive at 16.5 years. What I don’t understand is that if the oceans are off-gassing, how can they be absorbing the human CO2?
We agree that human CO2 behaves the same as natural CO2.
We agree that for more than 200 years the oceans have in general been releasing CO2 because of natural global warming after the Little Ice Age.
We agree that the shallow and deep oceans are the major reservoir of CO2.
If the oceans are releasing CO2 due to natural global warming over a period of several hundred years, how can they be absorbing human CO2 as suggested in this article? Fluids flow only one way at a time.
Thanks for helping us understand the carbon dioxide cycle so we don’t let anti-fossil fuel alarmists wrongfully take away our fossil fuels.
Dear John,
The easiest way to understand how the oceans can do two things at once is to realize we can separate the flow of human CO2 from the flow of natural CO2 in our analysis.
So, since human CO2 enters the atmosphere, it flows from the atmosphere to land, surface ocean, and deep ocean.
Meanwhile, if the natural carbon cycle is at equilibrium, and the natural CO2 in the ocean increases because of a natural cause, then natural CO2 will flow from the ocean to the atmosphere.
Although we cannot distinguish between human and natural CO2 molecules, we can still analyze the human and natural carbon cycles independently. Their sum is the total carbon cycle.
Regarding “‘Fluids can flow only one way at a time,” that is true only for “net” flows. In the carbon cycles, carbon atoms flow rapidly between the reservoirs in both directions simultaneously. If the carbon cycle is at equilibrium, the net flows are zero.