Ed Berry, PhD, Theoretical Physics, CCM
Click here to read Ed Berry’s 2023 paper and debate.
Copyright (c) 2022 by Edwin X Berry. Permission granted to republish with link to Berry (2021). Download pdf.
Introduction
Climate change: myth or reality.
This summary of Berry (2021) shows the main points without the math.
1. How CO2 flows out of the atmosphere.
The Intergovernmental Panel on Climate Change (IPCC) correctly assumes the outflow of CO2 from the atmosphere is proportional to the CO2 level divided by a time constant.
This time constant – that the IPCC calls “turnover time” and we call “e-time” – describes how fast CO2 flows out of the atmosphere.
IPCC (2007, p. 948) defines “turnover time” equal to the first power of the carbon level divided by the outflow of carbon from the reservoir,
“Turnover time (T) is the ratio of the mass M of a reservoir (e.g., a gaseous compound in the atmosphere) and the total rate of removal S from the reservoir: T = M / S. For each removal process, separate turnover times can be defined.”
IPCC (2007, p. 948) says the turnover time (T) for natural CO2 is about four years.
“Carbon dioxide (CO2) is an extreme example. Its turnover time is only about four years because of the rapid exchange between the atmosphere and the ocean and terrestrial biota.”
IPCC’s data for its natural carbon cycle (IPCC, 2013, p. 470-471) show the e-time for atmospheric CO2 is 3.5 years, supporting IPCC’s statement of “about four years.”
Simple physics shows when outflow is proportional to the first power of level, natural and human carbon cycles are independent. So, we can calculate these carbon cycles independently and then add them up to get the total. We need only to calculate the human carbon cycle over time to see how human CO2 changes atmospheric CO2.
2. The first approximation conflicts with IPCC claims.
IPCC’s data show the inflow of human CO2 into the atmosphere is about 5% of the total CO2 inflow and natural CO2 is about 95%.
Since human and natural CO2 molecules are identical, their e-times are identical. Therefore, to the first approximation, the composition of today’s atmospheric CO2 is about 5% human and 95% natural.
Yet, IPCC (2013, p. 467, Executive Summary) says,
“With a very high level of confidence, the increase in CO2 emissions from fossil fuel burning and those arising from land use change are the dominant cause of the observed increase in atmospheric CO2 concentration.”
IPCC (2013, pp. 470-471) assumes the natural CO2 level remained at 280 ppm after 1750 and, therefore, human CO2 caused all the CO2 increase since 1750. This would make human CO2 about 32% of 415 ppm as of 2020.
How can a 5% inflow cause 32% of the CO2 level?
It can’t. Even the IPCC realizes this problem. So, to support its claim that human CO2 causes dangerous climate change, the IPCC incorrectly claims human CO2 stays in the atmosphere longer than natural CO2.
IPCC (2013, p. 469) incorrectly claims:
“The removal of human-emitted CO2 from the atmosphere by natural processes will take a few hundred thousand years (high confidence). … about 15 to 40% of emitted CO2 will remain in the atmosphere longer than 1,000 years. This long time required … to remove anthropogenic CO2 makes climate change caused by elevated CO2 irreversible on human time scale.”
This IPCC claim violates IPCC’s own data-based e-time and ignores that human and natural CO2 molecules are identical, and therefore their e-times are identical.
3. The second approximation proves the IPCC is wrong.
The first approximation considered only the atmosphere. The second approximation uses IPCC’s four-reservoir carbon cycle model. The physics model, using outflow proportional to level and IPCC’s e-times, replicates IPCC’s natural carbon cycle, shown in Figure 1.
Then, this same model calculates a human carbon cycle compatible with IPCC’s natural carbon cycle, using recursive, annual time steps from 1750 to 2020, shown Figure 2.
This compatible human carbon cycle shows human CO2 has added only 33 ppm (8%) while nature has added 100 ppm (92%) to IPCC’s 280 ppm level in 1750, as of 2020.
According to the scientific method, the physics model has proved IPCC’s claim – that human CO2 caused all the CO2 increase above 280 ppm – is false.
Good high-school students can learn how the physics model works.
4. IPCC’s natural carbon cycle
Figure 1 shows IPCC’s natural carbon cycle at equilibrium with atmospheric CO2 at 280 ppm (589 PgC). The boxes show reservoirs and arrows the flows between reservoirs.
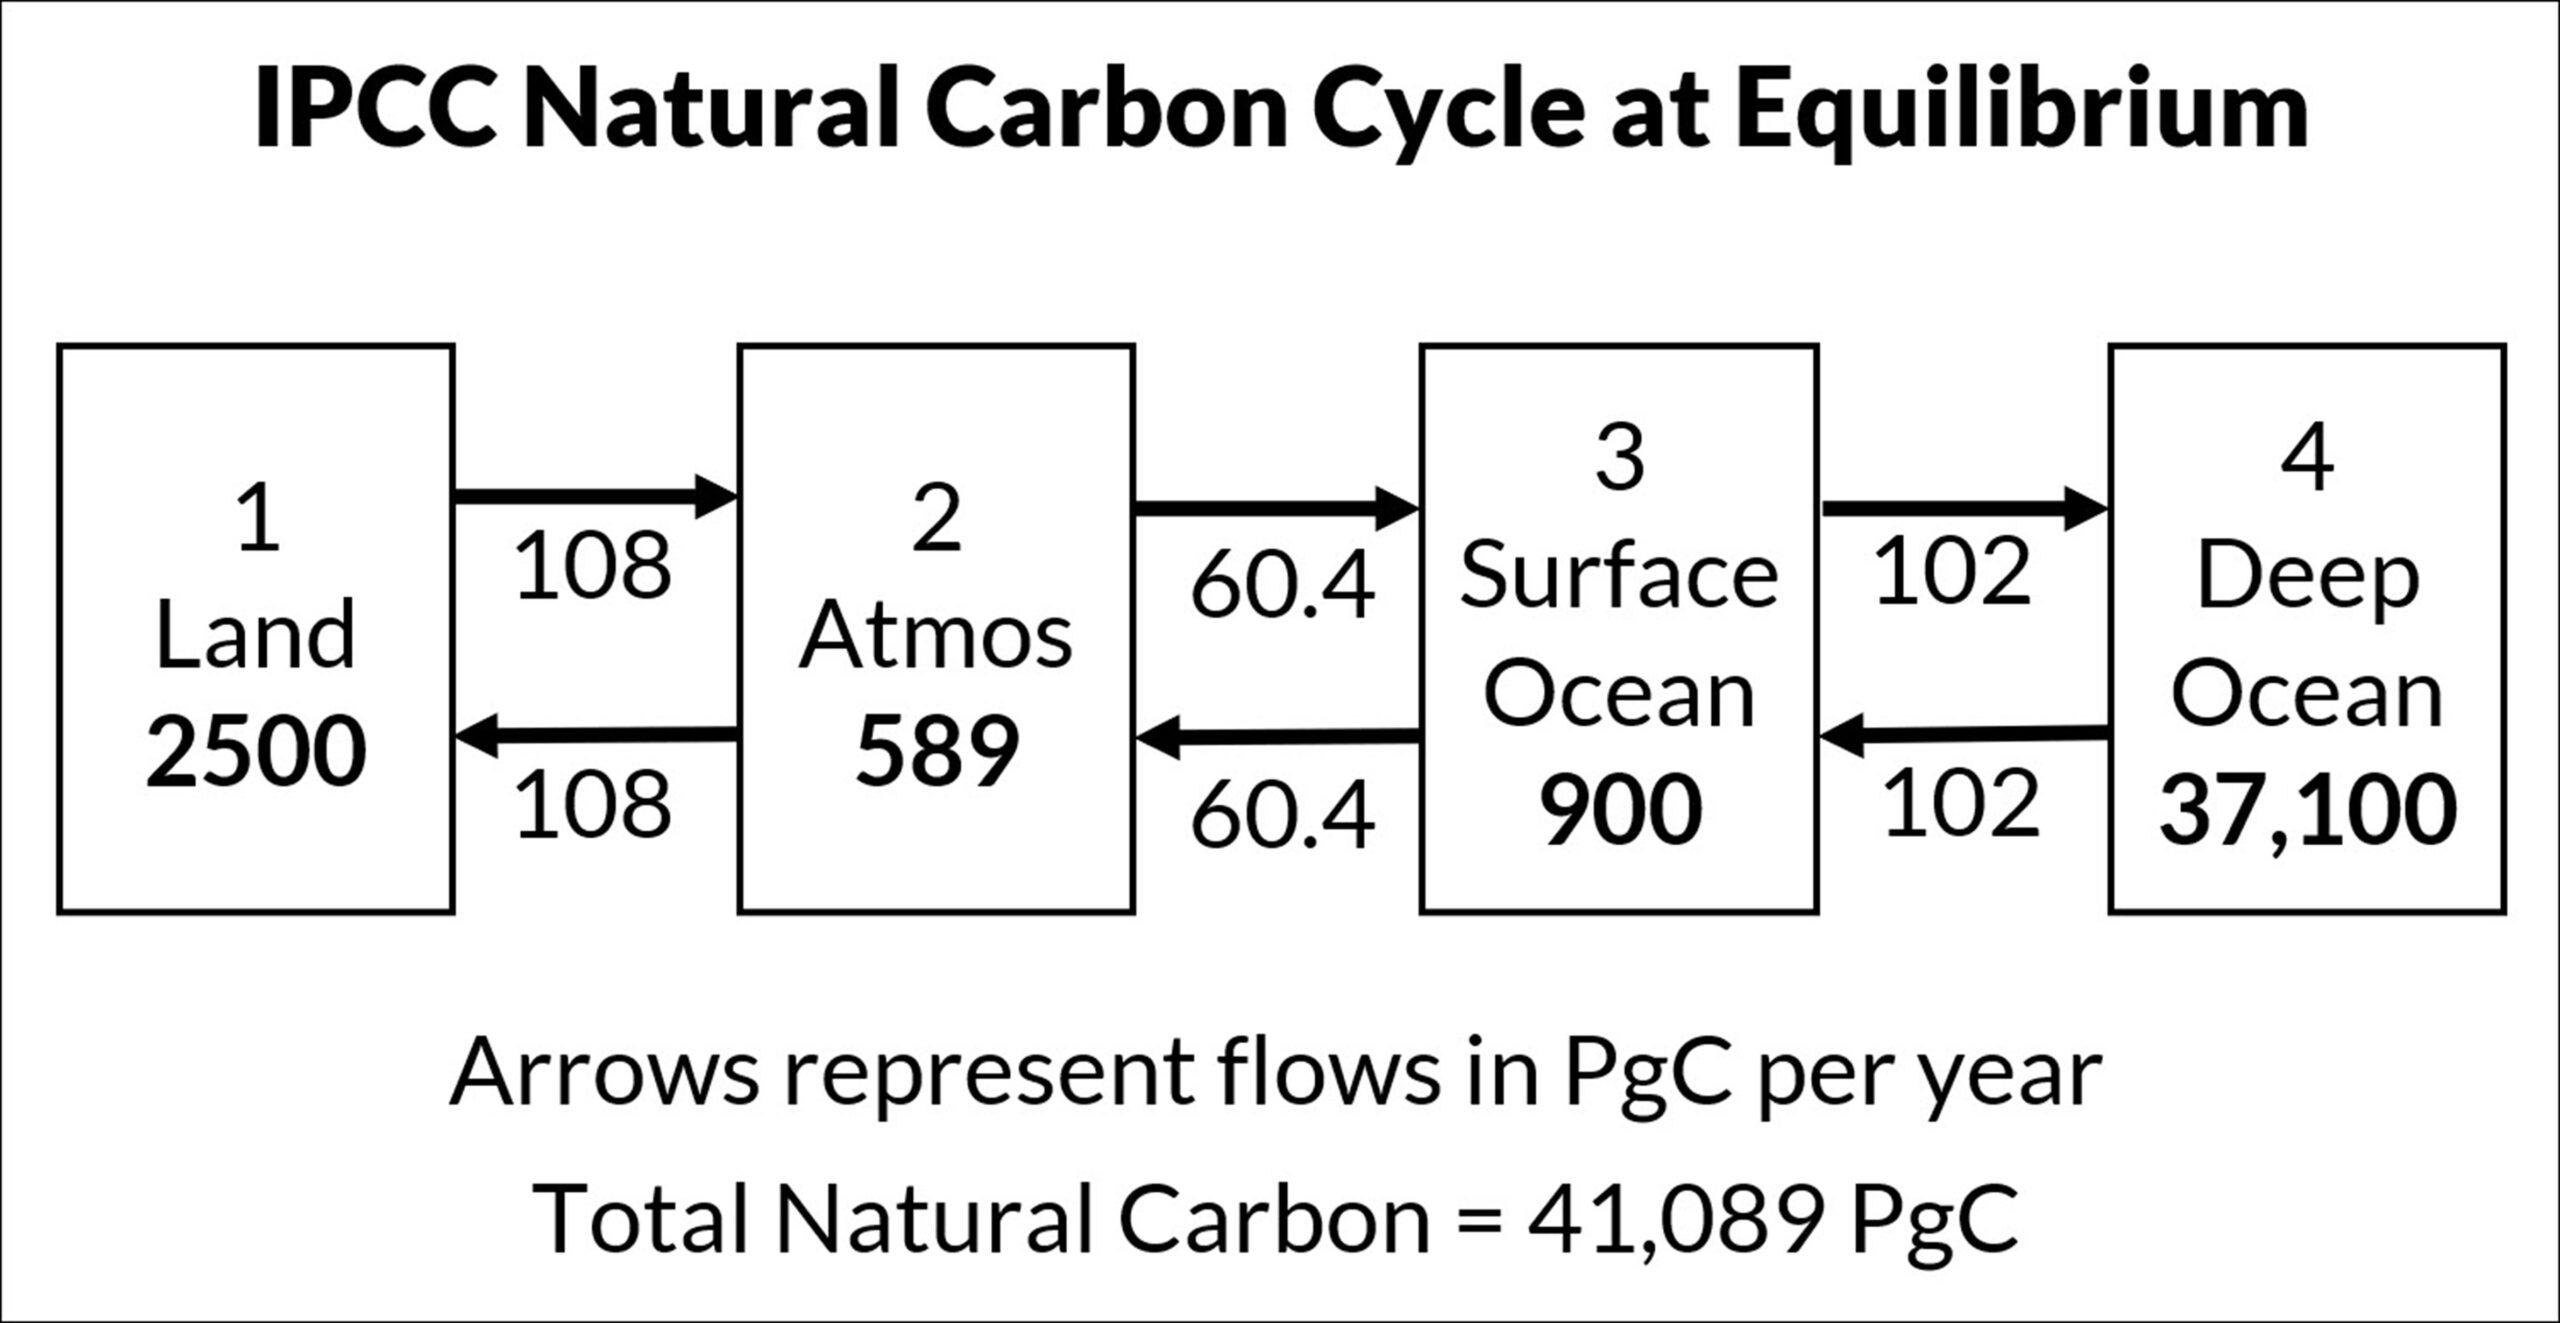
Figure 1 shows 1.4% of natural carbon is in the atmosphere and 90% is in the deep ocean. This is an equilibrium fingerprint that human carbon will approach.
5. Physics model applied to human carbon.
Figure 2 shows the physics carbon cycle model with IPCC’s four reservoirs and six outflows, where the arrows are all positive numbers.
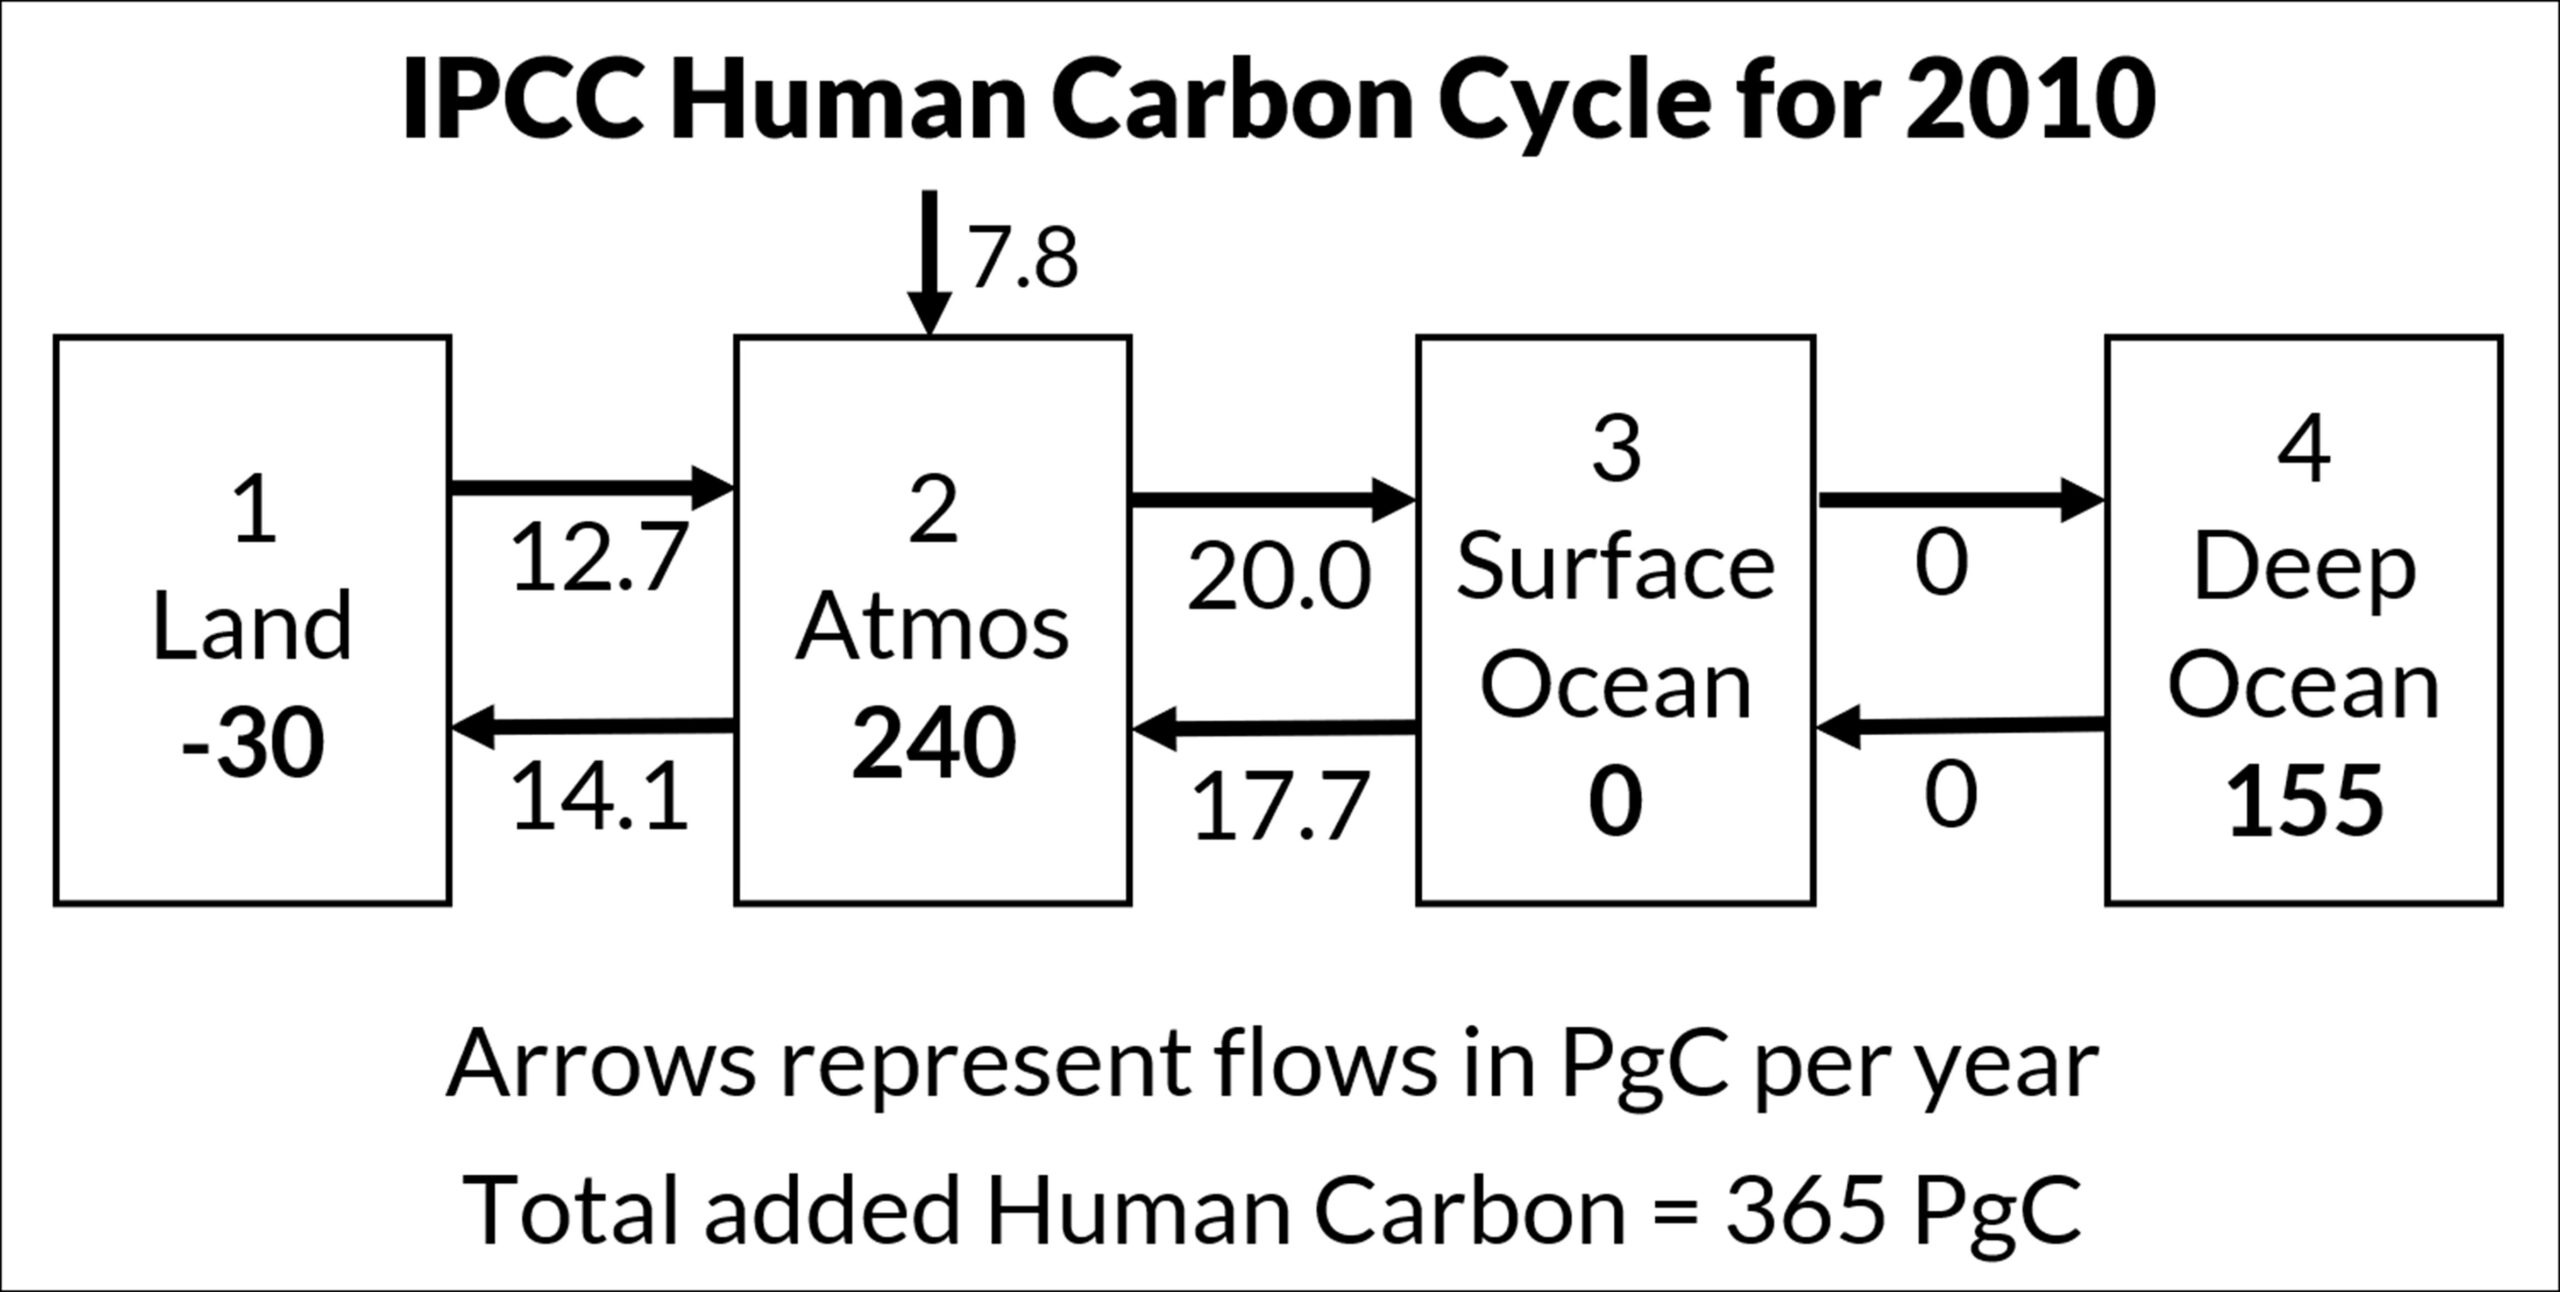
Human carbon has added only one percent to the total carbon in the natural carbon cycle.
Figure 3 shows how the reservoir levels change with time for human carbon.
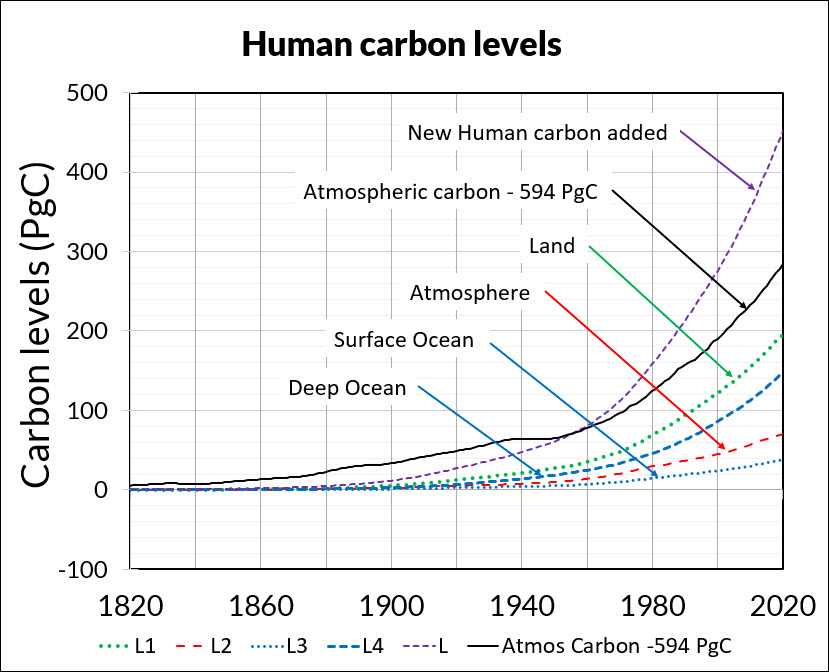
The purple dashed line shows the cumulative human carbon since 1750. The solid bold line shows the measured atmospheric carbon level above 280 ppmv.
Data alone prove natural CO2 increased the CO2 level above 280 ppm. The cumulative “New Human carbon added” before 1955 is less than measured “atmospheric carbon,” making it impossible for human carbon to have caused all the CO2 increase.
The red dashed line shows human CO2 added to the atmosphere is much less than the “New Human carbon added” because the CO2 e-time of 3.5 years lets CO2 flow out of the atmosphere much faster than it can accumulate.
6. The Bern model uses IPCC’s assumption.
Figure 4 compares the physics model with the Bern model.
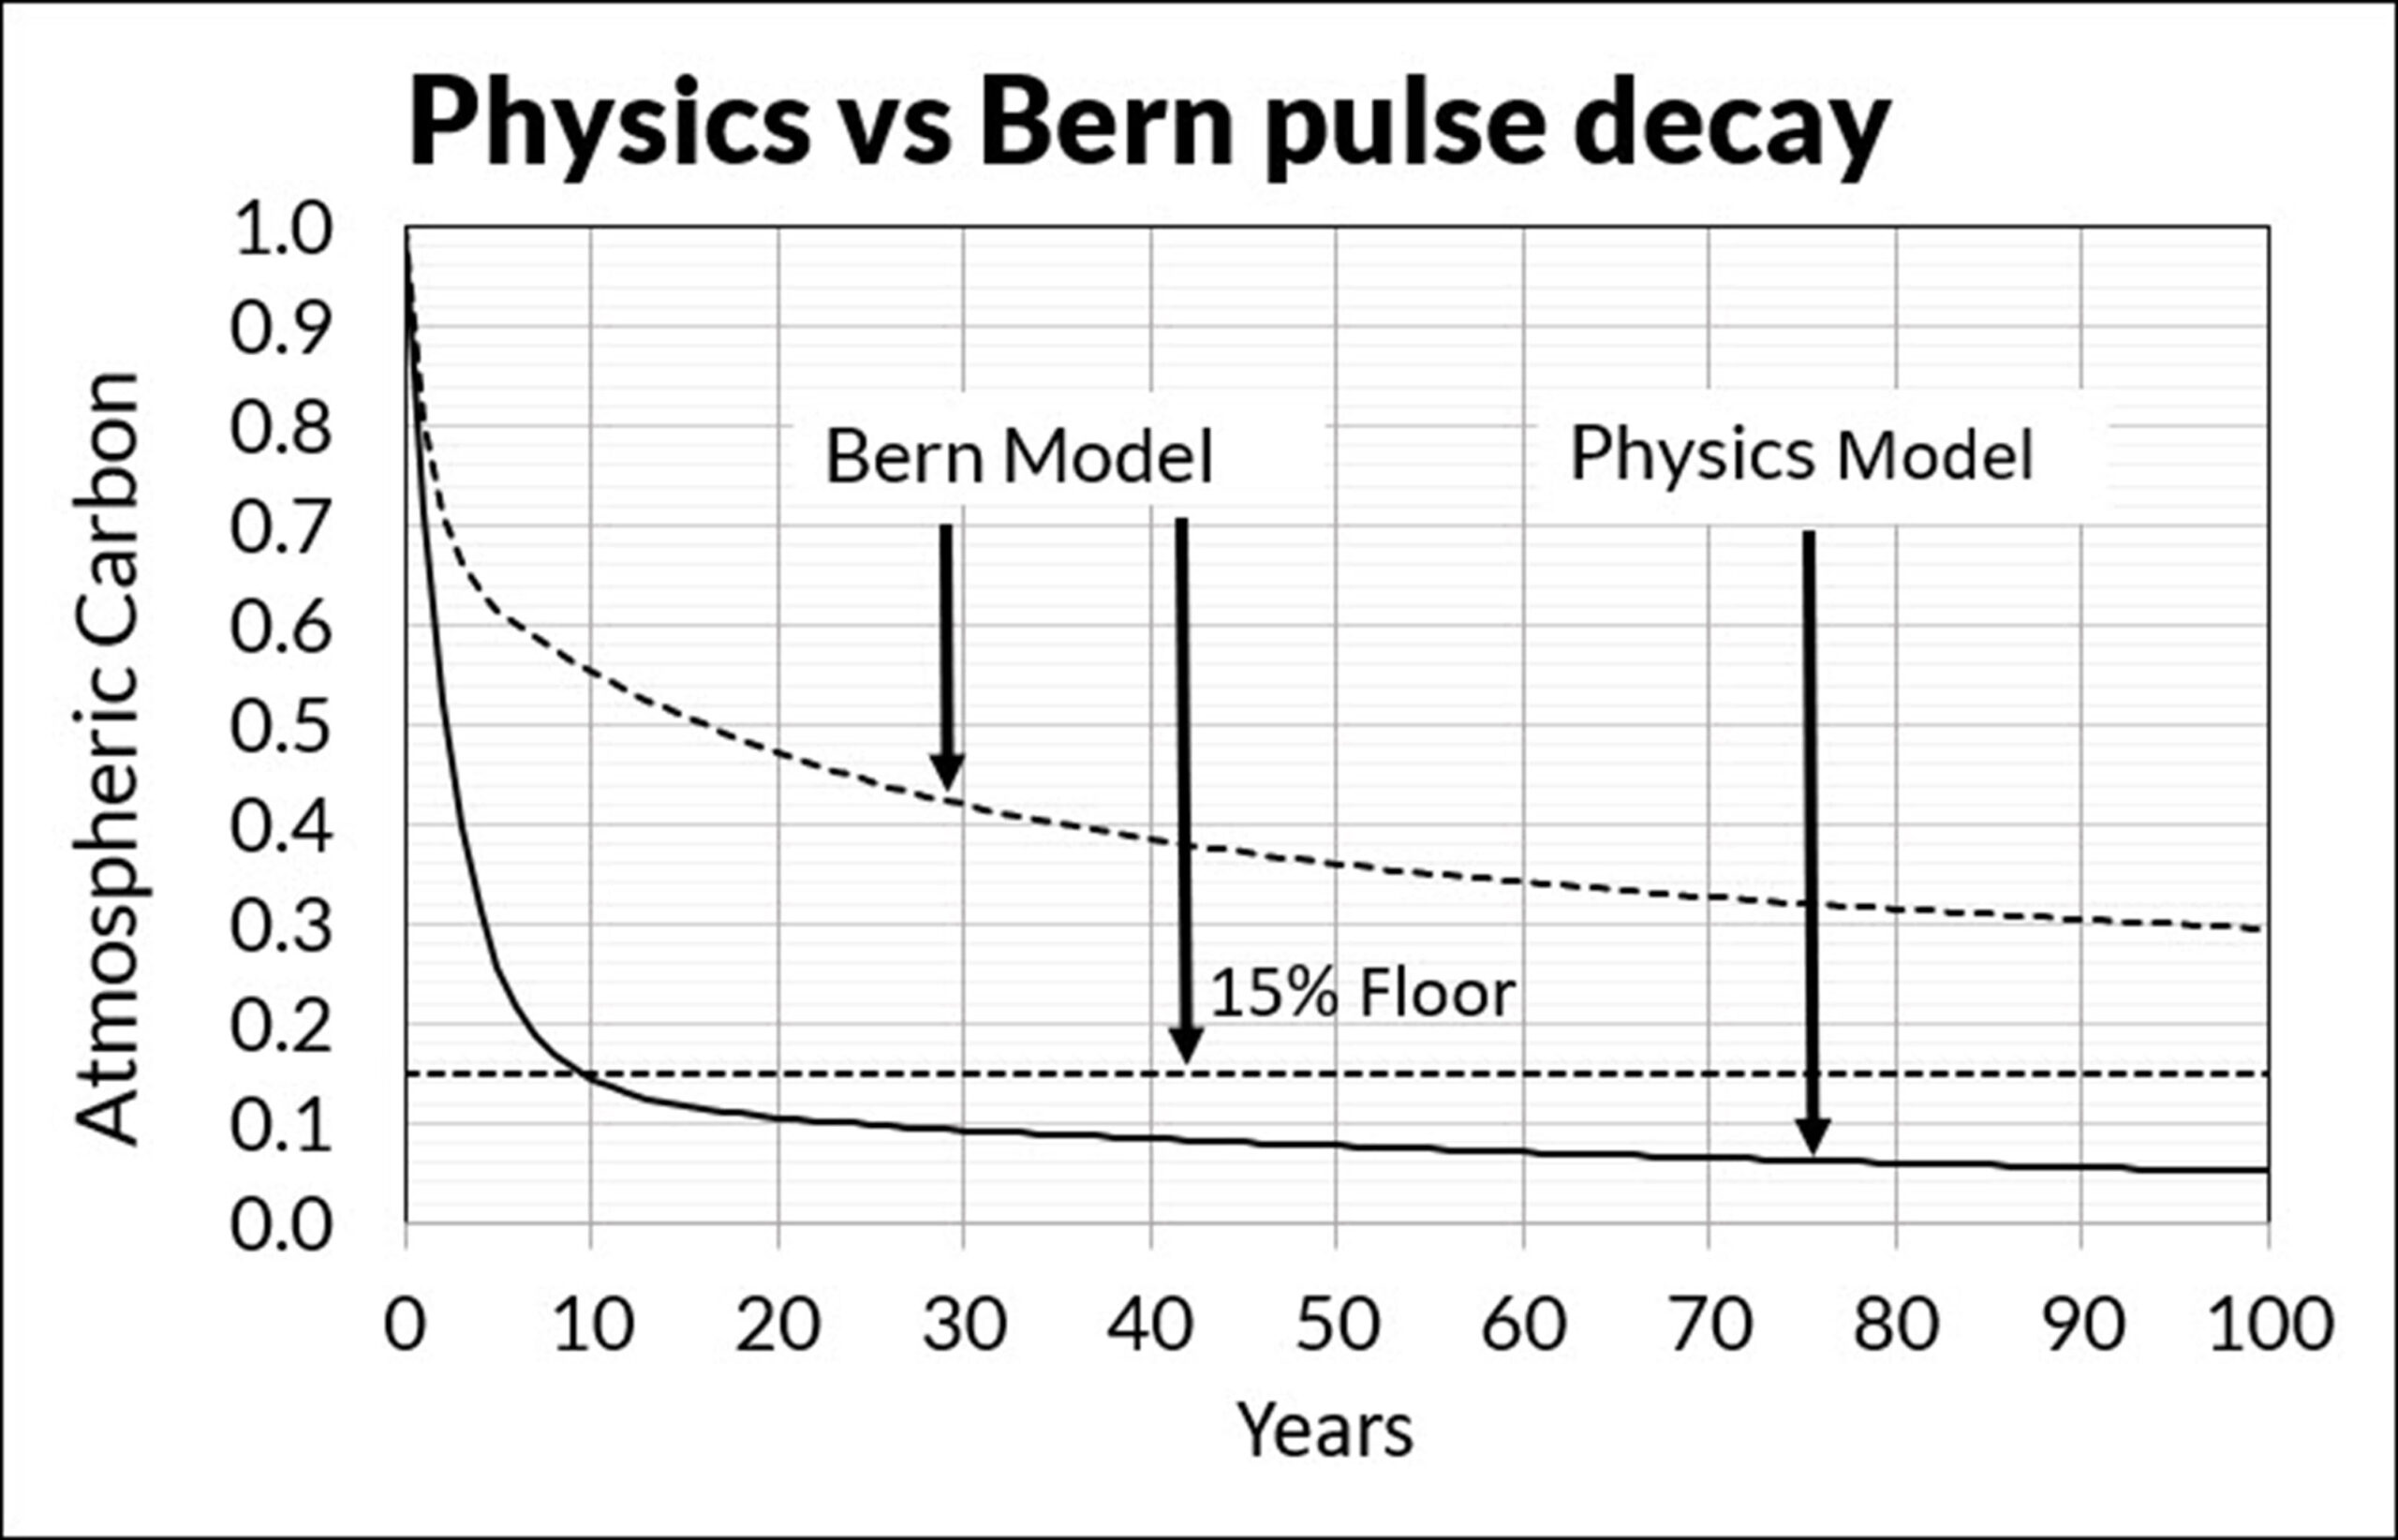
The key difference between the Bern model and the physics model is the Bern model uses IPCC’s invalid assumption that human CO2 causes all the CO2 increase while the physics model uses IPCC’s e-time of 3.5 years.
7. Isotope data show CO2 increase is natural.
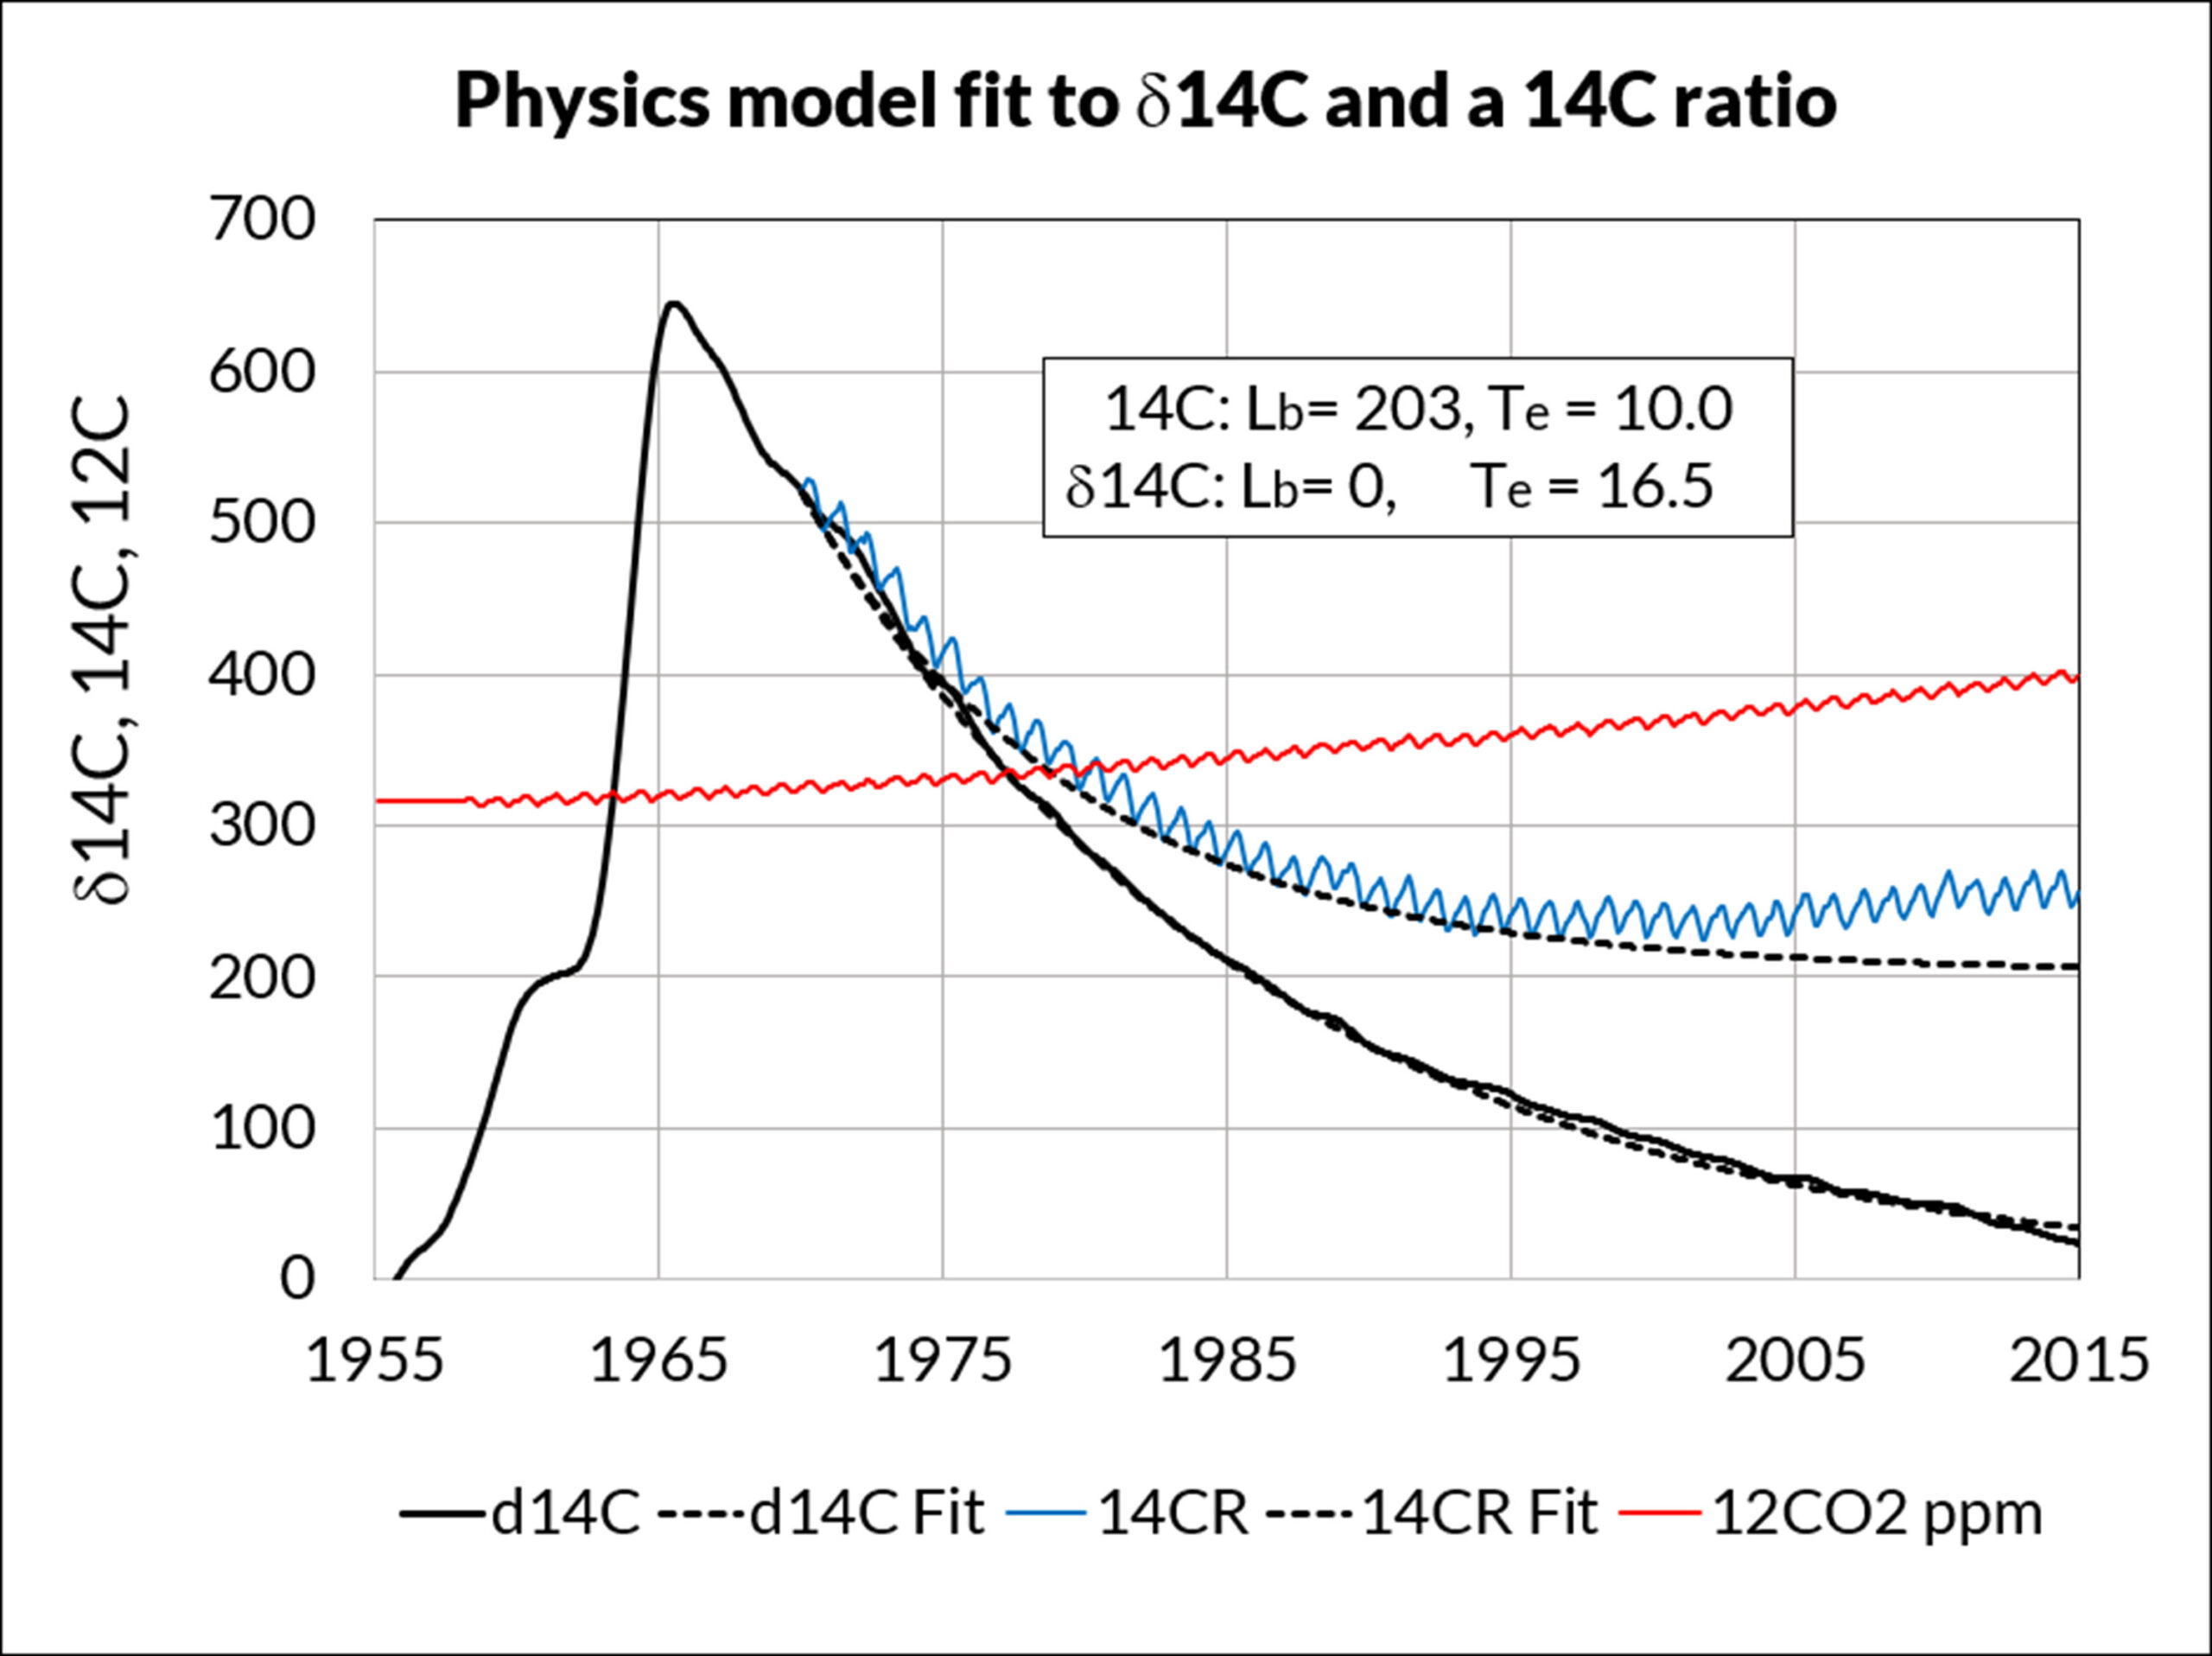
Figure 5 shows
- 14C data (black solid line) and its curve fit after 1970 (black dashed line).
- 14C data relative to the δ14C value in 1970 (blue sawtooth line) and its curve fit.
- 12CO2 data in ppm (red sawtooth line).
δ14C is a measure of the 14C / 12C ratio. The natural level of δ14C is zero.
Human CO2 has no 14C, so its δ14C is -1000. If human CO2 were 32% of the CO2 in the atmosphere, it would dilute the natural δ14C level from zero to -320.
Data show δ14C has returned to its natural level of zero even as 12C (red line) has increased, showing that natural CO2 has dominated the increase in atmosphere CO2.
The 14C curve fit shows 14CO2 e-time is 10.0 years (Hardy and Salby, 2021; Berry, 2021). The 12CO2 e-time is smaller than the 14CO2 e-time because the 14C atom is heavier than the 12C atom. This confirms that the e-time for 12CO2 is less than 10.0 years.
Conclusions
The simple physics model – using IPCC’s outflow proportional to level and e-times –proves natural CO2 controls atmospheric CO2. As of 2020, natural CO2 has added about 100 ppm, and human CO2 only 33 ppm, to IPCC’s CO2 level of 280 ppm in 1750.
References
Berry, E. X, 2021: The impact of human CO2 on atmospheric CO2. Science of Climate Change, December 14, 2021, The impact of human CO2 on atmospheric CO2 – SCC (klimarealistene.com); https://doi.org/10.53234/scc202112/212
Harde, H. and Salby, M. L., 2021: What Controls the Atmosphere CO2 Level? Science of Climate Change, August 2021. https://doi.org/10.53234/scc202111/28. https://scc.klimarealistene.com/produkt/what-controls-the-atmospheric-CO2-level/
IPCC, 2013: Ciais, P., Sabine, et al. 2013: Carbon and Other Biogeochemical Cycles. The Physical Science Basis. Contribution of Working Group I to the Fifth Assessment Report of the IPCC. Cambridge University Press, UK and New York, NY, USA. https://www.ipcc.ch/site/assets/uploads/2018/02/WG1AR5_Chapter06_FINAL.pdf
IPCC. 2007: Climate Change 2007 – The Physical Science Basis. Contribution of Working Group 1 to the Fourth Assessment Report of the IPCC. Annex 1: Glossary: Lifetime. https://www.ipcc.ch/site/assets/uploads/2018/02/ar4-wg1-annexes-1.pdf
Copyright (c) 2022 by Edwin X Berry. Permission to republish with link to Berry (2021) granted

Dr. Ed
WUWT just put up an article by Dr. Spencer about declining CO2 sink rates. (https://wattsupwiththat.com/2022/08/15/enso-impact-on-the-declining-co2-sink-rate/)
I have not had time to follow the links to Dr. Spenser’s paper but I think it is based on accepting the assumption that all the recent increase is human caused. I would really appreciate your take on it. When I previously commented on his earlier article my explanation of your work was rejected but never rebutted.
Dear DMA,
Thank you for the notice. I downloaded Spencer’s pdf and read it.
His Eq (1) is the continuity equation: The rate of change of level equals the inflow E(t) minus the outflow S(t). We can neglect his third term with the beta coefficient for this discussion.
The idea that S(t) = ks [ CO2 (t) – CO2eq] equals outflow has no physical basis. So, his Eq (2) is simply wrong.
CO2eq is a consequence of the condition where outflow equals inflow and outflow. But outflow is not a direct function of CO2eq.
Then he does meaningless curve fits. His conclusions are invalid because his physics is invalid.
You are correct that he incorrectly assumes human CO2 causes all the CO2 increase above 280 ppm. He compares the CO2 level for both nature and human inflows, but he uses only the human CO2 inflow. He has not separated the natural and human CO2 flows and levels as he should have done.
He should reference my 2021 paper because it shows the physics needed for his paper.
I put this comment on WUWT.
“The idea that S(t) = ks [ CO2 (t) – CO2eq] equals outflow has no physical basis.”
Isn’t this similar to Salby’s review of the Kohler equation that had sinks still taking out Co2 after there was nonr left? This looks to me like it is saying when the excess above equilibrium reaches the equilibrium amount sinks stop altogether. I think past concentrations of 5000 PPM would have to invalidate that .
By the way THANKS for responding. It will be interesting to see what goes on at WUWT.
Dear DMA,
Similar. In Kohler’s critique of Harde, Kohler referenced an equation by Cawley who had such an equation.
Spencer’s (2) says outflow is zero when the level is at equilibrium. That does not work. There will still be an outflow, but it will equal the inflow. The CO2eq does not belong in (2).
Pingback: The Impact of Human CO2 On Atmospheric CO2 – Summary – Watts Up With That?
Pingback: The Impact of Human CO2 On Atmospheric CO2 – Summary – Watts Up With That? - Lead Right News
Pingback: Impact of Human CO2 on Atmospheric CO2 - Summary - Increased by that? - News7g
Pingback: The Impact of Human CO2 On Atmospheric CO2 – Summary – Watts Up With That? - wtnzfox34.com
Pingback: The Impact of Human CO2 On Atmospheric CO2 – Summary - Climate- Science.press
You look at C12 and C14. Do you have any comment on the C12/C13 isotope ratio that some activists use as “evidence” to “prove” that most of the CO2 increase is anthropogenic? I have never bought into that hypothesis but haven’t been able to find where that argument fails (haven’t looked that hard at it to be honest).
Well I did not think I would initiate this much response. Thank you Dr. Ed for defending your work. I do hope that someone like Happer or Lindzen will really dig into your paper. I don’t think it will be refuted but if it is we will have learned more than we know now. If they can’t refute it they need to let the world know. I haven’t found any of the critiques convincing yet. Coincidentally I wrote to CO2 Coalition just last week to get their thoughts and Greg said they disagreed but would not give me any reasons. Keep making the commenters look at the paper. So many go off on tangents that the paper does not address. The most common problem with many of their comments is assuming nature is constant.
Pingback: The CO2 Coalition Is Wrong Because Its Physics Is Wrong
Pingback: The Impact of Human CO2 On Atmospheric CO2 – Summary Just another Online News & Entertainment Site
Pingback: If Republicans Support Climate Truth
Pingback: The Impact Of Human CO2 On Atmospheric CO2 - Published Paper
Hi Ed,
Are you aware that none of the links to your 2021 publication work?
Hopefully you can fix this as I’d love to share it with some people.
Also, you should consider joining Twitter as you can reach a wide audience easily there.
Best regards,
Jack
Ed
I sure wouldn’t want to hire you as my accountant. You fail at basic double-entry accounting.
You say: “IPCC’s data show the inflow of human CO2 into the atmosphere is about 5% of the total CO2 inflow and natural CO2 is about 95%. ”
You don’t spell out what the ‘natural’ is. From your first diagram I assume you are adding inflows from land and surface ocean so 108 + 60.4 = 168.4. Human inflow is 7.8.
7.8/168.4 = 0.046
So roughly 5%
Now lets look at the other flows. Outflows!
Outflows to land and surface oceans: 108 + 60.4 = 168.4. Human outflows: 0
0%
Now lets look at net flows
Net natural flows – Land Atmosphere Surface Ocean are
(108 + 60.4) – (108 + 60.4) = 0
Net human flows are (7.8 + 0) = 7.8
If the system is unperturbed, net flow changes to the atmosphere from all other sources are 7.8, all human derived.
That is that pesky double-entry accounting thing.
But the system is not unperturbed. Your second diagram shows changes to the flows Land Atmosphere Surface Ocean.
But your fig 2 doesn’t add up.
Net flow, LandAtmosphere is +1.4 inflow to the land, but the change in the land reservoir is -30?
Net flow, Atmosphere Surface ocean is +2.3 inflow to the Surface ocean of 2.3. but the change in the Surface Ocean reservoir is 0?
And the net flow to the Deep Ocean is zero, but it’s reservoir increases by 155?
Might I suggest that the 155 reservoir change figure for the Deep Oceans should actually be the Surface Oceans. Not just from a mathematical analysis, but from oceanography. Flows of anything dissolved in the ocean, between the surface and the deeps, are very, very slow. Timescales of many centuries or more. So much so that, to a 1st order analysis, you can ignore the deep oceans.
So if we allocate the 155 to the surface ocean instead, the part of the ocean in gas exchange with the atmosphere, we get a net atmospheric balance, +7.8 human into the atmosphere, -3.7 out of the atmosphere.
Human net inflow is perturbing the atmosphere, but natural net outflow change as a response is partly compensating.
Atmospheric change is actually 200% due to human actions. Just Mother Nature compensates for part of that.
Dear Glenn,
Thank you for your comment. It helps me explain things better in my future work… and this post relates to my 2021 paper. I think I improved my explanation in my 2023 paper.
Here, my Figures 1 and 2 are not my data. These figures are IPCC’s data. Figure 1 is IPCC’s natural carbon cycle that it assumes is at equilibrium and constant. Figure 2 is IPCC’s (claimed but false) human carbon cycle that does not balance, and it does not use the same physics as IPCC’s natural carbon cycle.
You are correctly pointing out the errors in IPCC’s data.
As my papers show, we can and should treat the natural and human carbon cycles independently, then add them up to get a total carbon cycle. So, what I did (as I explain in my 2021 paper) is to use IPCC’s natural carbon cycle, which is at equilibrium, to calculat the Te for each natural node. Then I calculate IPCC’s TRUE carbon cycle using the same Te. My paper shows all the math to do this.
My calculations show IPCC’s TRUE human carbon cycle, which follows the same physics as IPCC’s natural carbon cycle, does not cause all the CO2 increase. This means natural CO2 had to cause most of the CO2 increase above 280 ppm according to IPCC’s own data.
If you click on the link at the top of this post – Click here to read Ed Berry’s 2023 paper and debate – you can read my subsequent explanations that I think are better than this post.
Thank you again, Ed
Glenn, you state: Flows of anything dissolved in the ocean, between the surface and the deeps, are very, very slow. Timescales of many centuries or more. So much so that, to a 1st order analysis, you can ignore the deep oceans.
Sulpis et al claim 80 years or less.
Current CaCO3 dissolution at the seafloor caused by anthropogenic CO2
Olivier Sulpisa,b,1, Bernard P. Boudreauc , Alfonso Muccia,b, Chris Jenkinsd , David S. Trossmane , Brian K. Arbicf , and Robert M. Keyg
Key phrases
Oceanic uptake of anthropogenic CO2 leads to decreased pH, carbonate ion concentration, and saturation state with respect to CaCO3 minerals, causing increased dissolution of these minerals at the deep seafloor. This additional dissolution will figure prominently in the neutralization of man-made CO2
Seafloor dissolution of CaCO3 minerals will constitute a primary feedback to ocean acidification over timescales of centuries to tens of millennia (1). The overall dissolution reaction is as follows: CaCO3 +CO2 + H2O → Ca2+ + 2 HCO3 −, [1] where CaCO3 denotes solid carbonate in bottom sediments, mainly as calcite. This process is termed geochemical carbonate compensation. Consequently, CO2 entering the ocean, including that of anthropogenic origin, can be neutralized permanently by conversion to dissolved bicarbonate ions (HCO3 − ).
Both numerical ocean models and the presence in abyssal waters of transient tracers produced almost entirely after the end of the 1940s, that is chlorofluorocarbons and polychlorinated biphenyls, strongly imply the presence of anthropogenic CO2 in the deep oceans. Anthropogenic CO2 in deep and bottom waters is simply very difficult to measure because it is a small signal superimposed on a large natural background concentration.