by Dr. Ed Berry
Temperatures
Let us look at temperatures. Here is a plot of the reconstructed temperatures and CO2 concentrations for the past 600 million years.
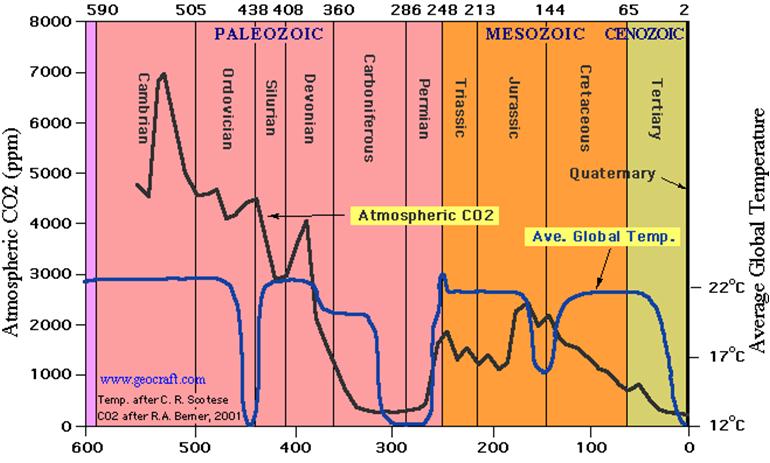
We observe that CO2 is near its lowest concentration for the past 600 million years. Historically, CO2 concentration has been much higher than it is now. We know there was no runaway heat effect or we would not be here.
About 450 million years ago the temperature dropped significantly even though the CO2 concentration was about 12 times higher than today. This disproves the hypothesis that CO2 causes global warming.

Here is a temperature record for the last 400,000 years. We are now in the last part of the Holocene warm period shown at the right. This plot shows that the earth spends most of its time as an ice ball. The last 12,000 years has been a good time to live. But history shows it will not always be that way.
In this perspective, we would want to develop the best possible energy sources in order for future humans to survive the coming ice age. This is a more certain future scenario than warming. Although we cannot predict when the next ice age will occur, it will occur.

Here is a temperature reconstruction of the last 11,000 years. This shows that we are not in any danger of global warming. It shows we have been warming out of the Little Ice Age of a few hundred years ago. Obviously, this warming had nothing to do with our carbon dioxide emissions which have occurred mostly in the last 50 years.

Here is the temperature reconstruction for the past 1000 years as published by the UN IPCC in its 1995 report. It shows the Medieval Warm Period (MWP), the Little Ice Age, and today’s temperatures lower than the MWP.

Here is the fabricated temperature history shown in the UN IPCC 2000 report known as the 
 Hockey Stick. The IPCC Third Assessment Report says: “Recent temperature increases follow over 1000 years of relative stability – and are projected to accelerate rapidly.”
A Climategate email said they had to “get rid of the MWP” and they did. Unfortunately for them, in 2003, McIntyre and McKindrick proved this temperature plot is totally bogus. The statistical methods used were erroneous. Any random numbers inserted into the calculations, like the numbers from a phone book, will produce this Hockey Stick plot.
Yet even today, university professors are showing this to their students as “proof of global warming.” To make this fictitious graph even more dramatic, it includes temperature scenarios after 2000 as generated by climate models. These temperature projections have no valid basis in science.
The elimination of the MWP is absurd since it has been confirmed by 776 scientists from 460 institutions in 42 countries.

This is a 2000-year global temperature reconstruction based on non-tree ring proxies,” by Craig Loehle and J. Huston McCulloch in Jan. 10, 2008. The MWP is back and it was warmer than temperatures today.
Carbon dioxide
Now, let’s look at carbon dioxide. Below is a chart of the carbon dioxide record used by the IPCC.

It shows an increasing CO2 concentration since 1740. The data after 1957 are real data. The data before 1957 are taken from ice cores. The problem with ice cores is that the CO2 in them diffuses through the core. This changes the data.

The above chart uses direct chemical measurements of CO2 ignored by the IPCC. It proves the CO2 concentration was much higher in 1820 and in 1940 than today.
In summary so far, the real data show that two of the four necessary legs of the global warming hypothesis have been sawed off. According to the rules of science, this alone is sufficient to invalidate the global warming hypothesis.
The other two pillars fail also, as we will demonstrate in separately.
Thanks for debunking eco-scare and junk science.
But unfortunately we are a irrational species where fear, eco-scare sell more than empirical science.
Me, I look at global warming as a good thing, I hope they are right as the alternative is a ice age. What would people eat if wheat growing areas were frozen over or we couldn't use CO2 to plant/harvest/deliver food?
Eco-nuts are an irrational bunch at best.
Love your charts….
Back when Carl Sagan was pushing "Nuclear Winter," I looked at his climate models for the Defense Nuclear Agency. Sagan's earth had no oceans–a good assumptions for values of 3 << 1. The model was over simplified. Each upgrade to the physics warmed nuclear winter a bit. Winter became spring before vanishing entirely.
The offsprings of Sagan's earth are the "climate models" of today. Way back then, I challenged the modelers to explain the effects of the eruptions of Mt. Tambora and Karkatoa. (One caused the "year without a summer" and the other didn't.)
WOW! Excellent! Five stars out of five: ⭐⭐⭐⭐⭐
Thanks.
Pingback: Crossroads Crises in Perspective (Part 2) – The Greatest Trek – Gypsy Café
Pingback: (2) A Crisis in Thinking and The Way Out – Energy Shifts