Chuck Wiese, Meteorologist
I often get asked by climate hysterics that if the increase in atmospheric CO2 isn’t responsible for the global warming of the last forty years of record in the satellite data, then what could have caused it?
They point at total solar irradiance and indicate any changes are far too small to account for any warming. While that appears true as best we can determine from solar records to date, what is not ever discussed is whether or not there is a change in the available solar radiation that reaches the ground or Earth’s surface over time.
The best measure of this is to determine the changes in Earth albedo, which is the reflectance of solar radiation due to clouds and aerosols in the environment that reflect this energy from the sun back to space. So let’s have a look at the at the records:
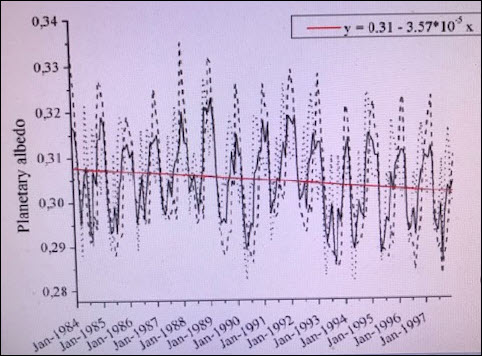
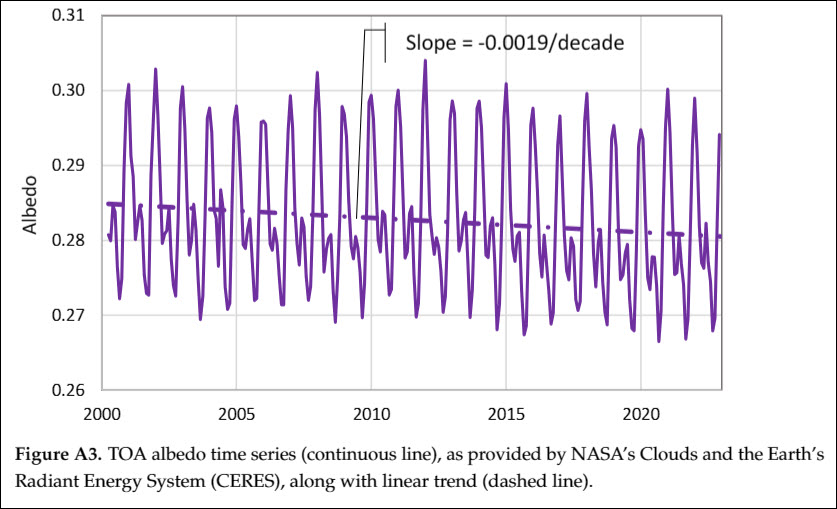
Figure 1 shows the measured albedo from 1984 to 1997. Figure 2 shows the measured albedo from 2000 to 2023.

Figure 1. Earth’s albedo from 1984 to 1997.

Figure 2. Earth’s albedo from 2000 to 2023.
The two records presented go back in time to 1984 from present. Like all NASA’s records that deal with solar radiation, many are co-joined without end and beginning point consistency as is the case with these two records. But what they show is significant.
To apply any meaning to this, because the end and start points do not match, I took the total change in albedo from each record from start to finish and summed the total change. It is -0.008 from 1984 to 1997 and -0.005 from 2000 until present. The total is -1.3% over 40 years of time, or a decrease in Earth albedo of 1.3%
The solar irradiance over the Earth’s disk area from space is 340 Wm-2 when averaged over the entire sphere. With an albedo in 1984 of 0.308, 69.2% or 235.28 Wm-2 of solar irradiance reached the Earth’s surface. The change in albedo of -1.3% caused + 4.42 Wm-2 of additional solar energy to reach the Earth’s surface.
At the mean Earth temperature of 289 degrees Kelvin, the rate of change with respect to Planck solar energy is:
5.47 Wm-2K-1 or 5.47 Watts per square meter per degree Kelvin.
Dividing this change by Plank’s rate of change gives a temperature increase of +0.81 degC of global warming since 1984.
The UAH satellite record shows the mean decadal rate of warming since 1979 has been +0.19 degC/decade for the global land value and +0.14 degC/decade including the oceans. When making this comparison, it is much more appropriate to use the land value changes because of a lower specific heat and the fact that the global land is static and does not move, whereas the oceans with their circulation systems constantly move and transport heat poleward.
Extrapolating the land value change over 40 years, gives a total warming of +0.76 degC, which is very close (within 0.05 degC) the change calculated here from the change in albedo. This is not cherry picking. It is a realistic and straightforward comparison of the data. The radiative change in CO2 as a stand-alone constituent doesn’t even come close. In 1984, atmospheric CO2 was 345 ppmv and today it is 422 ppmv.
The change in radiative forcing as a stand-alone constituent from those values is 1.08 Wm-2. Using the same Planck rate of change, this gives a warming of +0.20 degC, which is nowhere close to the real value. As I have stated before, it is inappropriate to use the CO2 values in the presence of the Earth’s hydrological cycle because the cycle negates the effect with a negative feedback.
I discussed this finding with Dr. John Christy at UAH and he pointed at the albedo decline likely having come from the use of cleaner burning fuels and therefore lower aerosol concentrations that lead to haze and smog. Apparently, Climatologist Dr. Judith Curry has also discussed this on her blog.
These albeda data show the warming since the start of the satellite record did not come from atmospheric CO2, but from this change in solar irradiance that reaches the Earth’s surface due to the reduced Earth albedo.
These solar records are from the “Climate of Doom” blog that contained the early solar record from NASA and the later record from NASA plotted from the paper “On Hens, Eggs, Temperatures and CO2: Causal Links in Earth’s Atmosphere” by Demitris Koutsoyiannis et. al. who obtained the 2000-2023 record from NASA.
solar-in-out-albedo-timeseries-hatzianastassiou-20041.png (687×1594) (wordpress.com)

Excellent work! Many thanks.
Richard
Can you give a source and reference for the data presented?
Henrik Svensmark (DMI) proved this years ago
I have mentioned to the climate alarmists a few times that if China stops burning coal, it will warm the earth because the coal dust reflects the sun. And nobody ever talks about this. But now the data is showing an effect most likely from our efforts to clean up coal power plants and reduce diesel particulates quite significantly, with particulate traps now being required. Unintended consequence. Not to mention the very fine particulates that come out are actually much worse because they get in your lungs and pretty much stays there as it is hard to expel it compared to the larger particulates. Another unintended consequence.