by Howard C. Hayden, Prof. Emeritus of Physics, UConn
Traditionally, climatology has made good use of chemistry, economics (records of food production), art (paintings of people skating on the Thames), history, astronomy, biology (leaf stomata, leaves, seeds), paleontology, archaeology, literature, limnology, oceanography, cave drawings, depictions of a veldt-like Sahara in Egyptian tombstones, and practically everything else, including physics (isotopes 2H, 18O, 10Be and others).
Recent climate science, heavily reliant on supercomputers, is a different matter. The most direct answer to the question posed by Nadir Jeevanjee (“Is Climate Science Physics?” APS News Backpage, Sept 2023) is “Climate science will start to become science when its practitioners start rejecting models that do not agree with the real world.”
Upon learning that Geophysical Fluid Dynamics Laboratory’s (GFDL’s) Suki Manabe had received the Nobel Prize in Physics in 2021 for his climate model, Dr Jeevanjee became convinced that climate science really is physics. The logic that an imprimatur from the Nobel Committee assures that climate science is physics is tenuous at best. There certainly is physics in climate science, but there is also a lot of nonsense.
For example, GFDL’s model of the tropical “hot spot” is farther from reality than any of the other models, as shown in Figure 1. Manabe’s algorithm may be wonderful, but something fed to it is clearly wrong.
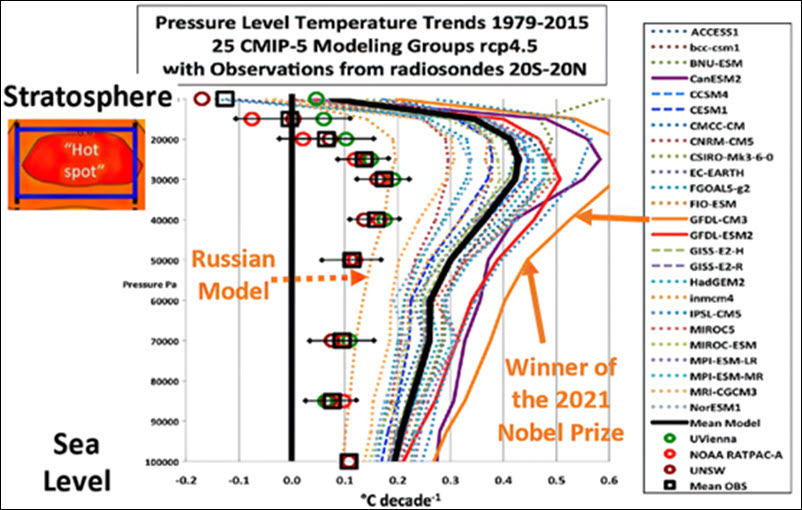
- Figure 1: The measured (symbols on left) and modeled (lines) temperature trends vs. altitude. The Russian model comes closest to the data, and the worst fit is GFDL-CM3. (Fig. 3 from John R. Christy and Richard T. McNider, DOI:10.1007/s13143-017-0070-z, annotated.)
Similarly, Dr Jeevanjee’s spaghetti graph of temperature vs. time shows that climate science is not ready for prime time: predicting all possible futures is predicting nothing. The graph also shows that the overwhelming majority of the 138 models disagreed with measurements by 2012. There are four data sets in the figure corresponding to four notions of how much CO2 society will emit in the future. If everything otherwise were deterministic, there would be precisely four lines, rather than 138 lines, representing future temperature increases.
Of course, it is impossible to compare any of the models with what happens in (say) 2080, because there are no data, so it looks like a no-holds-barred game. However, there are some very real constraints that apply to all models, most notably the conservation of energy.
In IPCC jargon, radiative forcing comprises changes in solar intensity at orbit, changes in albedo, and changes in the greenhouse effect occasioned by changes in GHG concentration (usually referenced to the “pre-industrial period” of 1850-1900). For example, IPCC has calculated that the radiative forcing due to doubling CO2 concentration is in the range of 3.7-to-4.0 Wm–2. By way of comparison, the greenhouse effect (G, as defined in IPCC’s Sixth Assessment Report. AR6 of 2021) is 159 Wm–2, the numerical difference between the surface radiation (Isurf) of 398 Wm–2 and the IR radiated to space (Iout) of 239 Wm–2, all numbers averaged over the sphere. The 2.5% increase in the greenhouse effect due to CO2 doubling hardly justifies the frightening headlines that are attributed to climate scientists.
Under equilibrium conditions, the heat absorbed from the sun must equal the heat radiated to space, a law as applicable to Venus, where the surface temperature is high enough to melt lead, as it is to Earth and Mars.
That is,
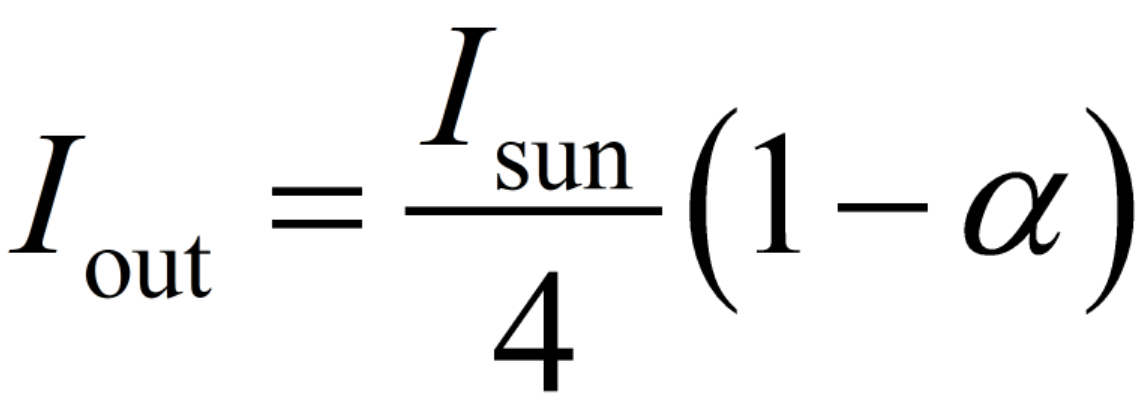
where Isun is the solar flux at orbit, approximately 1360 Wm–2 and a = albedo, approximately 0.3 (both figures for Earth). Further, as noted above,

where G is the greenhouse effect, e is the emissivity (usually taken to be 1.0, although 0.95 would be more realistic), s is the Stefan-Boltzmann constant, and Tsurf is the surface temperature. Climate is chaotic, but even chaotic systems have constraints; these two equations, which can easily be combined into one, are constraints on the climate system.
Let us look first at what IPCC calls the Equilibrium Climate Sensitivity (ECS), the expected temperature increase caused by doubling CO2. Their most probable value is 3ºC. They have failed to see a big contradiction. The increase in surface radiation, calculated from the Stefan-Boltzmann law, would be about 16.5 Wm–2, and somehow this would be due to a GHG suppression of IR amounting to 3.7-to-4 Wm–2. Some positive feedback from increased atmospheric H2O content would, of course, increase G by more than 3.7 Wm–2. Figure 2, taken from AR6 shows the positive feedback to be small.
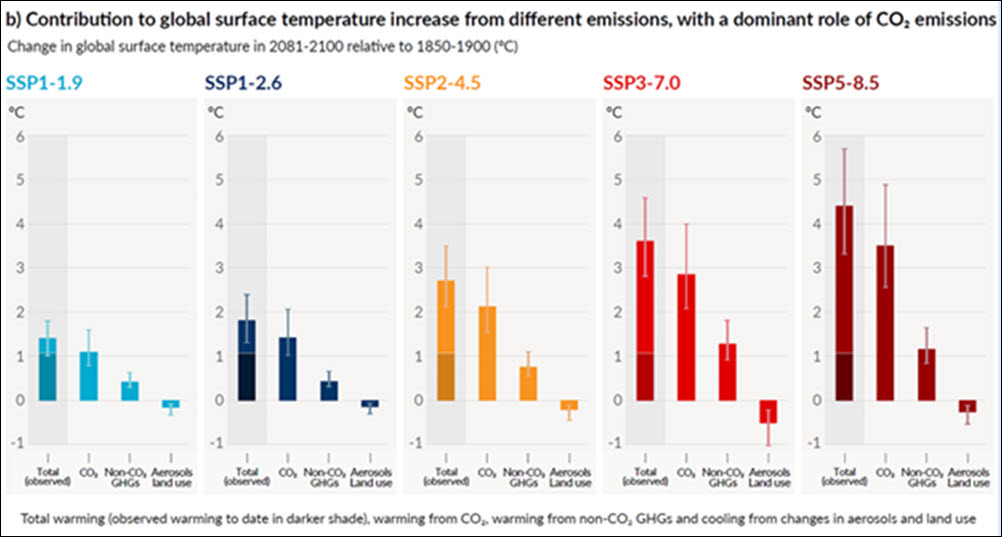
- Figure 2. Figure SPM.4 (b) from AR6 showing model-dependent temperature increases since 1850-1900 due to CO2, non-CO2 GHGs, and albedo changes due to aerosols and land use. The total effect at present is the dark part of the bars at the left. All models shown indicate that the non-CO2 GHGs are about one-third as effective as CO2.
If the left side of

which equals the right side of

remains constant, so must the right, thereby equating the increase in surface radiation to the increase in the greenhouse effect. That is, if absorbed sunlight remains constant, the increase in the greenhouse effect must be matched exactly by the increase in surface radiation. For example, a 6 Wm–2 increase in G, would imply a surface temperature increase of 0.9ºC. However, Figure 2 shows that the models predict an increase in albedo, hence a decrease in the left member. Therefore
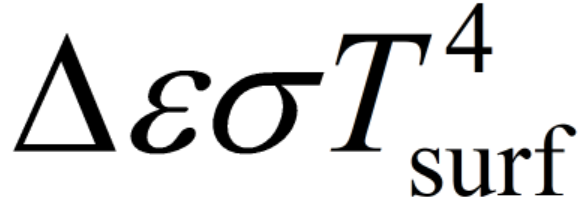
must be less than DG, and for this case DTsurf < 0.9ºC.
In AR6, IPCC uses the designation SSPx-y, where x is a chosen Socioeconomic Pathway (1 through 5), and y is the total radiative forcing in Wm–2 from changes in CO2, non-CO2 GHGs, and albedo in the year 2100. All changes are measured against the 1850-1900 time period. Figure 3 shows that IPCC expects 2.6 Wm–2 of radiative forcing (SSP1-2.6) to suppress between about 7 Wm–2 and 15 Wm–2 of increased surface radiation. They also expect 7 Wm–2 of radiative forcing (SSP3-7.0) to suppress between about 15 Wm–2 and 30 Wm–2 increased surface radiation. It is apparent that climate scientists have failed to apply the Stefan-Boltzmann equation to the temperatures they predict for the future. If, after the choice of SSP, everything were deterministic, there would be precisely two lines in Figure 3.
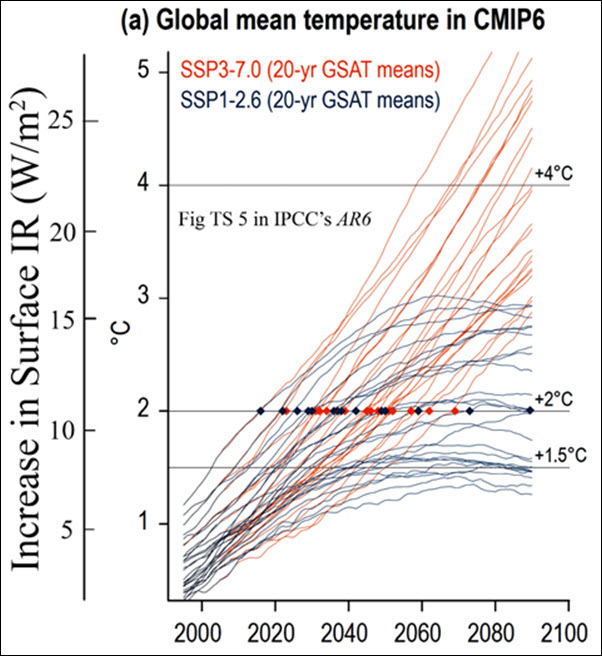
- Figure 3: Figure TS 5 from AR6, showing temperature changes vs. time for various models built around SSP3-7.0 (red) and SSP1-2.6 (blue). The added scale shows the increases in surface IR emission calculated from the Stefan-Boltzmann law corresponding to those temperature increases.
The individual graphs in Figure 2 could also benefit from a scale showing increased radiation from the Stefan-Boltzmann law. See Figure 4.
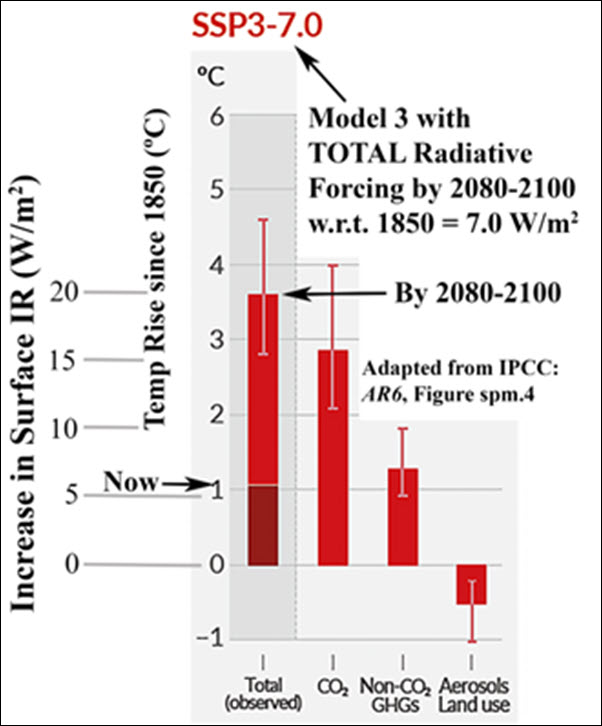
- Figure 4: The SSP3-7.0 example from Figure SPM.4 (b) from AR6 with appended S-B scale showing increase in surface IR. Somehow, radiative forcing of 7.0 Wm–2 is supposed to cause the surface to emit 20 Wm–2 more IR.
Starting with the Second Assessment Report (SAR, 1995), the IPCC has presented heat-balance drawings for the earth at present. The values of quantities like the radiation to space have varied a bit from time to time (235 Wm–2 in 1995, 2001 and 2207; 239 Wm–2 in 2014 and 2021), but the differences were fractionally small. With any given drawing, one can easily find at least 5 sets of numbers satisfying the conservation of energy within the limits of measurement.
Why has the IPCC never published a heat balance drawing for any RCP, any SSP or any scenario for any time in the future? It would seem to be a trivial exercise on a supercomputer running at petaflop speed. While a heat balance drawing for the future would not be the same as comparing calculated results with reality, it would assure that the models were consistent with the conservation of energy.
The key issue is to apply the Stefan-Boltzmann law to predicted temperatures to assure that the increase in surface IR emission is commensurate with the radiative forcing. The examples above clearly show that climate models are seriously deficient in this regard.
Is Climate Science Physics? Not yet!
