by Bryce Johnson (Revised, January 31, 2011)
The SpectralCalc™ Code
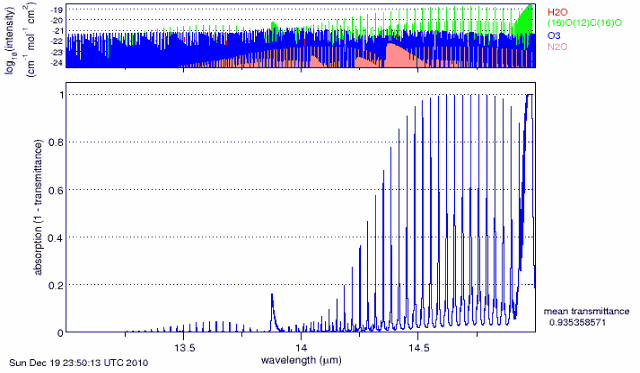
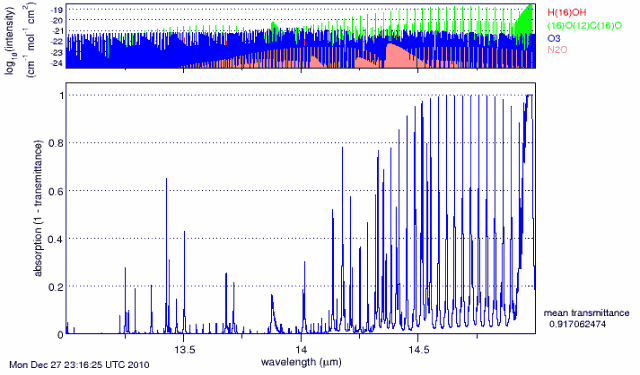
In a recent publication (1) Richard J. Petschauer utilized the SpectralCalc™ computer code (2) to demonstrate that carbon dioxide is but a “bit player” in earth warming by greenhouse gases (ghg’s). The code is extremely detailed and sophisticated, containing all the needed atmospheric and IR absorption parameters needed for an accurate description of “greenhouse” heating throughout the entire atmosphere. Figure 1 is an example of the detail available.
The colored plot at the top with logarithmic values indicates where in that particular range the atmospheric ghg components are active. The colors of the lines correspond to the color of the printed name of the molecule on the right. Absorption is plotted, but the value printed out on the bottom right is for transmittance (1 – absorption). The detail of the code limits it to a few microns of range and 20 such increments were utilized to cover the region where infrared absorption occurs.
A verification of Petschauer’s results using a different approach is reported in this document. The study is limited to the effect of carbon dioxide on heating of the earth.
Figure 1. Absorption Spectrum for Carbon Dioxide from 13- to 15-microns.
Results
The power and versatility of the SpectralCalc code offers insights into the subject of greenhouse heating that enhance the general knowledge of the subject. The major findings resulting from the application of SpectralCalc are as follows.
Petschauer’s results of the insignificance of CO2 in global warming are verified and reinforced (results here indicate that the effect of CO2 is even less than that predicted by Petschauer).
Most greenhouse activity occurs in the troposphere. Almost nothing happens at higher altitudes.
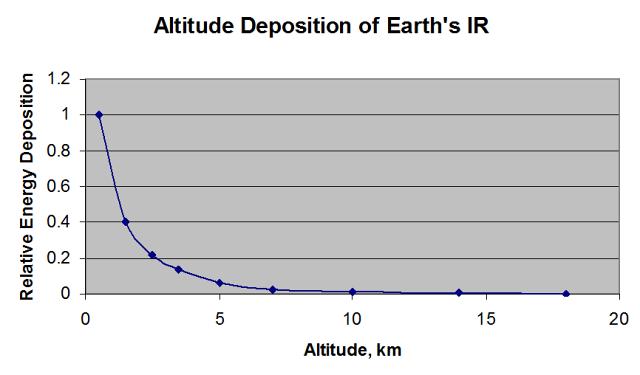
The code permits an altitude distribution of the deposition of ghg heat
Numerically, the total concentration of the CO2 in the atmosphere can be increased by a factor of 8 without exceeding a 1-degree C rise in temperature. At the past century’s rate of increased atmospheric CO2, this will require 2000 years.
The CO2 contribution to earth warming is low enough to call into question the entire issue of feedback.
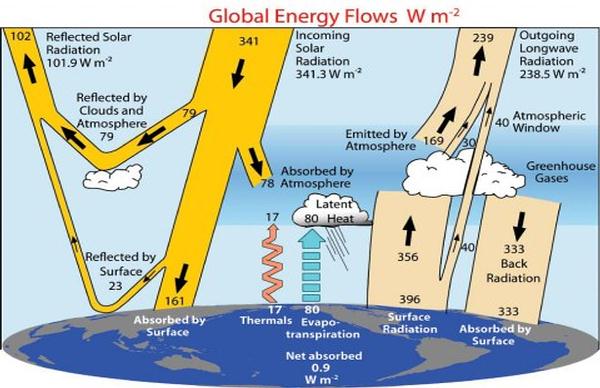
Figure 2. IPCC Earth-Atmosphere Energy Balance (Reference 3)
Assumptions
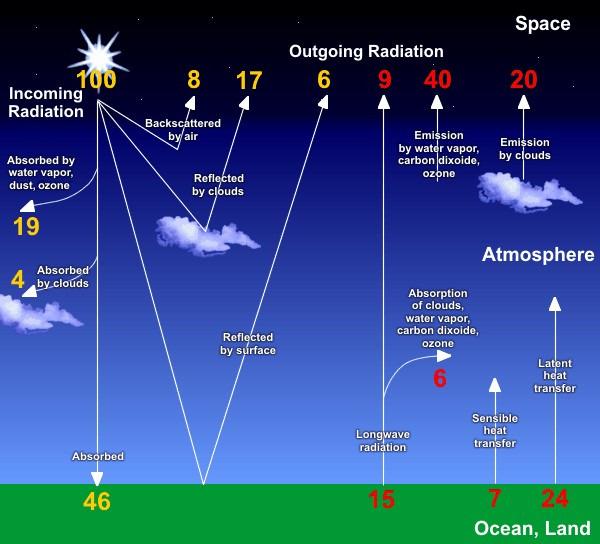
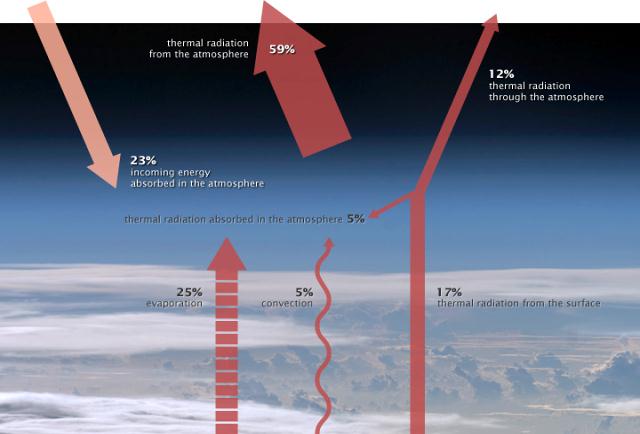
The calculations are based only on water and carbon dioxide. The other greenhouse gases in the atmosphere are not sufficient contributors to warrant the effort to include them. Water plus carbon dioxide then are considered to be the total greenhouse contribution. The greenhouse contribution to total atmospheric heat is assumed to be ten percent. This is derived from the values indicated in Figures 2, 3 and 4 which are heat balances from the IPCC, the National Weather Service and from NASA. Figures 2 and 3 are for the earth-atmosphere and 4 is for the atmosphere, only. The results are 0.096, 0.10 and 0.085, respectively. Ten percent is then an appropriately conservative value.
Figure 3. Earth-Atmosphere Energy Balance Diagram (from U. S. Weather Service)
The only contribution of greenhouse heat to the atmosphere considered is that generated at the earth’s surface due to its average temperature of 288K (396 watts/m2 by Figure 2 and 390 watts/m2 by SpectralCalc). The infrared fraction of the solar energy impinging on the earth is considered negligible compared to this value. The 355 watts/m2 back radiation value shown in Figure 2 returns some of its heat to the atmosphere by augmenting the temperature of the earth’s surface. There is some controversy about its contribution to global warming (5) but this analysis determines earth radiation by its known temperature eliminating the need for its consideration.
Figure 4. Atmospheric Energy Balance (from NASA).
The internally generated IR radiation of the atmosphere, of which back radiation is a part, is a product of its own heat and no substance can spontaneously increase its own temperature.
The analysis is dependent on two ratios: that of CO2 ghg effect to H2O effect and that of greenhouse-generated heat to total atmospheric heat. The ratio calculation is much less prone to error than calculation of absolute heat rates. By varying these ratios valuable temperature insights are afforded. Feedback is not addressed in this analysis and it is not considered an appropriate concern.
Calculations
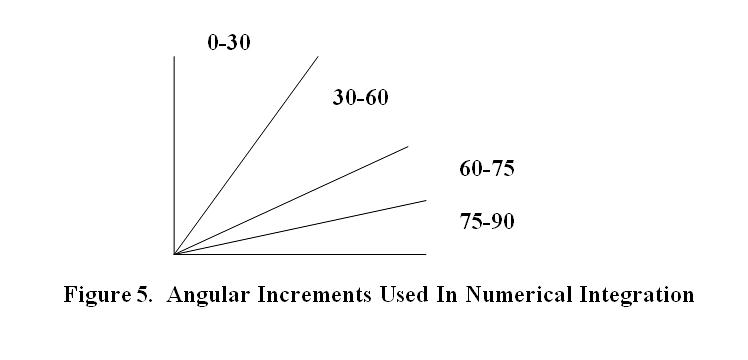
In Figure 5 below are shown the angular increments used for numerical integration. Four sectors are used between 0 and 90-degrees and these are rotated around the vertical to give the total solid angle for that sector. Two 30-degree sectors and two 15-degree sectors are used as shown. Near 90 degrees the angle-dependent absorption increases rapidly due both to the longer path required to reach the 20km altitude (the maximum altitude of the integration) and the increased density at paths nearer the earth which is why only a 15-degree increment is used there. Rotating the system 360 degrees around the vertical of the unit hemisphere generates the total solid angle associated with the increment dq about q, which is
sin q * 2p*dq. (1)
The total flow through it from an isotropic unit source on the surface in the q direction is
cos q*sin q*2p*dq (2)
Where cos q projects the flat surface of the earth onto an area perpendicular to q direction.
Equation 2 is exactly integrable to p*sin2 q. Evaluation of this expression over the four increments of solid angle produces these values:
0-30 degrees: 3.141593
30-60 degrees: 2.299806
60-75 degrees: 0.627693
75-90 degrees: 0.214084
These values can be described as the total solid angle subtended by the increment times the average cosine over the associated angle. To obtain total greenhouse gas absorption in that solid angle this value is multiplied times the fraction of IR energy absorbed (as determined by SpectralCalc) in the angular increment times the earth’s IR emission per unit steradian in the IR wavelength interval used. The average of this value in the angular increment is determined by the average of the values on each of its boundaries.
The sum over the angular increments is the total for that wave-length interval and the sum of all the wave length intervals is the earth total for that particular combination of water and carbon-dioxide percentages. So 100 separate SpectralCalc determinations are required for each C02-H2O combination. Eight such combinations were used. Table 1 is a summary of the calculations required for absorption in the13-15 micron increment of earth radiation with 0.0125 and 0.004 as the volume fractions for CO2 and H2O, respectively. The maximum-angle that can be calculated by SpectralCalc without earth interference is 84.9 degrees and it is substituted for the 90-degree angle in Table 1.
Table 1 Sample Calculation for Absorbed Greenhouse Energy
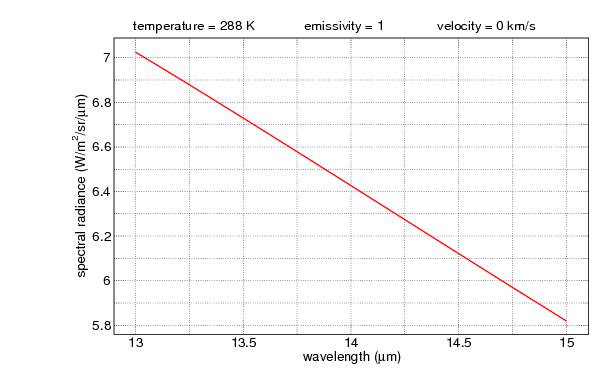
Figure 6 is a plot of the SpectralCalc calculation that produced the transmission probability for the 60-degree angle in Table 1.Figure 7 is the plot of the earth’s blackbody spectrum between 13 and 15 microns. The total emitted energy for this plot is 12.8508 watts/m2/sr
Converting Atmospheric Heat Addition to Temperature Increase
By the first law of thermodynamics, any body, or substance, at steady temperature has to lose as much heat as it gains. Therefore, we simply equate the heat input of the atmosphere to its heat loss and utilize the only mechanism available to the atmosphere for heat loss, and that is by radiation to outer space. The atmosphere has only two boundaries, the earth and outer space, and it cannot lose heat to the earth because the earth’s surface is warmer than the entire atmosphere. The only mechanism for transfer to outer space is by radiation, which by the Stefan Boltzmann Law is proportional to T4, with T in absolute degrees, as in degrees Kelvin. Since some radiation from the earth’s surface goes directly to outer space, we can assume radiation at all levels in the atmosphere with their associated temperatures also transmits directly to outer space. It is impractical to try to determine all of these and it is totally unnecessary. It can
be assumed that some temperature between the earth’s surface temperature and that at the atmosphere’s outer limits is an effective temperature for calculating its heat rejection, and that the outer space temperature is 0 degrees Kelvin (it’s actually about 3 degrees, but the
Figure 6. SpectralCalc Determination Absorption-Transmittance for 13-15 Microns
Figure 7. Blackbody Earth Radiation Emittance Between 13 and 15 Microns
added convenience is well worth the slight inaccuracy. With these assumptions the relation between temperature and heat addition is:
Th/T = (1 + Ha)0.25 …………………………… (3)
Where Th is the new temperature after the heat Ha is added to the atmosphere whose average or effective temperature was T before the addition. Using the highest value of atmospheric temperature for T, 288 K at the earth’s surface, produces the highest (most conservative) temperature increase. Some have suggested that the temperature at the “top of the atmosphere,” 255 K, is appropriate (6). CO2 contribution is low enough that the difference in this choice is insignificant.
Results
Temperature effect of CO2 addition
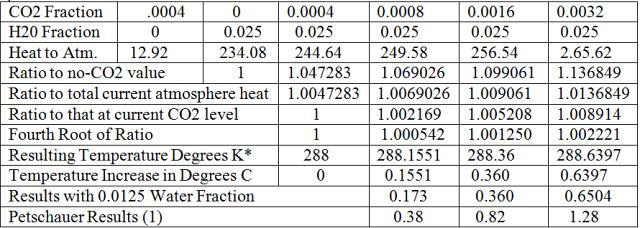
Table 2 shows the results of this calculation and compares them with those of Petschauer (1)
Table 2. Variation of Heat and Temperature Increase due to Atmosphere with C02
This study values are roughly half those of Petschauer. Petschauer included back radiation as a source of heat to the atmosphere(1) and this is sufficient to explain the difference. As explained under ‘Assumptions’ above, back radiation is a product of heat in the atmosphere and, therefore, cannot be a source of it. But both these results and those of Petschauer predict a much lower temperature rise than has been previously reported.
Using half the water density (but still considering greenhouse heating to be ten percent of total atmospheric heating) increases the temperature effect of added CO2, which is to be expected. However, the increase is small. This would indicate that CO2 saturation does not depend on overlapping water absorption at its absorption bands in the IR spectrum to push it to its limit.
SpectralCalc code predicts IR energy emissions and subsequent atmospheric energy absorption all the way out to 200 microns. But most analysts consider the limit of IR wavelengths to be 70 microns. Using this cutoff instead of 200 microns would increase the calculated effect of CO2 because only water absorbs out in the long wave lengths. If for the 0.0125 percent water vapor case, 70 microns had been the cutoff, doubling CO2 would have increased the temperature rise from 0.156 degrees C to 0.181 degrees C; quadrupling would have increased the temperature rise from 0.36 to 0.43 C and octupling would have changed it from 0.65 these 0.72. These are noticeable but not very significant.
Two additional studies were performed with the code. These used a single angle to represent the total angles shown in Figure 5 (60 degrees) to map the altitude deposition of IR energy emerging from the earth and to estimate the exchange of IR radiation between the altitude locations of the earth. To have used the same angular integration indicated in Figure 5 would have been untenable because of the vast number of calculations with SpectralCalc that would have been required. The results are of academic interest only since they don’t impact greenhouse warming and they are approximations. Table 3 illustrates the fate of the earth’s IR upon interaction with the atmosphere.
“Back radiation” is defined as that radiation which returns to the earth as a result of IR capture in the incident IR radiation to the atmosphere, mainly from the earth. But since such radiation is isotropic it sends radiation out to space also. This analysis accounts for both directions. Table 3 illustrates the calculation for the 13-15mm wave-length range.
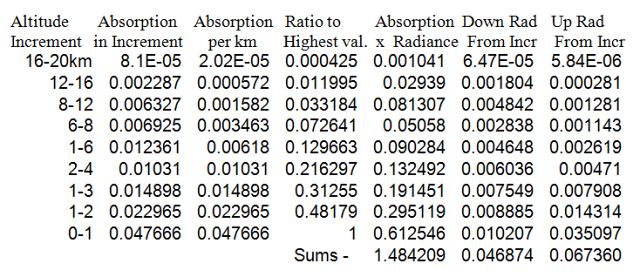
Table 3. Calculating Secondary Radiation From Earth IR
The fourth column of Table 3 shows the altitude distribution of absorption from Earth IR. That plotted in Figure 8 is for the sum of all four increments summarized in Table 4.
Table 4. Secondary Radiation for Wave-Length Increments
The secondary radiation was also computed from the IR of the ranges of 20-22, 13-1510-12 and 4.4-5.4mm. The first interaction from the earth produces a fraction, f, of the incident energy absorbed, the second produces ff, the third fff, etc, and the sum of all such successive encounters is
S f n from n = 1 to infinity. (3)
As long as f < 1, the series sums to the unique finite value of f/(1-f), which is the source of the values for the fourth column of Table 4. The reason the absorption in the up direction is greater than that in the down direction is that most primary absorption occurs at very low altitudes (Figure 8) and the down directed radiation therefrom soon encounters an abrupt end to its source of air molecules. Using the same f value for successive interactions is approximate because the distribution of successive radiant energies emitted cannot duplicate those of the previous ones. But the f values are small enough that the infinite series can be reasonably approximated by the first term, so the error in this approximation is tolerable.
The purpose of this exercise is to demonstrate how quickly the absorbed IR radiation is converted to heat. For the wave-length increments calculated, over 90 percent of the energy is converted on the first interaction. And this first interaction from the earth’s IR is the only one contributing to greenhouse heat of the atmosphere because the subsequent ones are from that fraction of the earth’s IR that has already heated the atmosphere.
Figure 8. Altitude Deposition of Earth’s IR.
Additional calculation with SpectralCalc determined IR exchange between different locations in the atmosphere. These are of academic interest, only, since this exchange alters only the spatial distribution of atmospheric heat, it does not impact its overall increase or decrease. The main difference noted between that exchange and IR radiation from the earth was the decreased saturation effect within the atmosphere. This is because the exchange internal to the atmosphere involves receipt of a large fraction of IR impingement from nearby molecules where the IR radiation has not traversed sufficient moles to be significantly impacted by saturation. This is true for earth IR for only those molecules close to the earth.
Significance of Results
The adequacy and accuracy of these results depends entirely on the SpectralCalc™ code (2). The author has neither access to the inner workings of the code nor the technical background to be able to assess its validity and accuracy. It has been accessible to the public for a number of years. So it has had ample user interface and opportunity for “bug” elimination. The Internet providers of the code have been supplied with an early draft of this document with the request for a review for proper use of their code. No response has been received as yet. They are also being provided with this final version.
The code instructions for use include a caveat that it should not be used to prove or disprove global warming. That is not the use that has been made in this document. This document is limited to determining the maximum role that carbon dioxide can play in global warming. The code documentation would indicate that it is adequate for this purpose.
The study results depart substantially from previous predictions of the effect of carbon dioxide. They are very much lower, and only about half of Petschauer’s predictions (1) which were, themselves, significantly lower than previous predictions. These results are sufficiently low that, if they are accepted, all justification for continued effort at carbon dioxide reduction is eliminated.
At less than 0.2 degrees C for doubling today’s content, they are surely lower than even the daily variation in the effect of water vapor and likely well below the accuracy with which atmospheric temperature can determined. At today’s rates, 2000 years of increase will still leave the temperature increase less than one degree centigrade. Today’s research and argument regarding climate change center on feedback mechanisms and whether they are positive or negative. But with such a low trigger temperature, how can any feedback be generated, either positive or negative?
References
- Petschauer, Richard J., “Carbon Heat Trapping: Merely a Bit Player in Global Warming,” 2008. (posted on Climate Clash)
- SpectralCal.com of GATS, inc.
- Trenberth, Kevin E. et al “Earth’s Global Energy Budget,” BAMS, March 2009
- IPCC Third Assessment Report, Climate Change 2001
- Roy H. Spencer, PhD, “Help! Back Radiation has Invaded my Backyard!” Home/Blog, August, 2010
- The Climate System, EESC, Spring, 2007
Availability of Calculations
All calculations with the results of SpectralCalc, were performed and recorded with Microsoft Excel Spreadsheets. These are too voluminous to include with the report, but can be made available by email to anyone requesting them from brycenuc@gmail.com.
About the Author
Bryce W. Johnson is a native of Idaho with a BS Degree in Mechanical Engineering from the University of Idaho, an MS Degree in Nuclear Engineering from North Carolina State University and a PhD in Mechanical/Nuclear Engineering from Stanford University. He is a registered professional nuclear engineer (retired) in the State of California. Following two years in the Air Force his active career spanned 48 years of research in nuclear technology, the last 32 of which were as a Senior Staff Scientist at Science Applications International Corporation. He is a lifetime member of the American Nuclear Society. He has been actively investigating climate change for over two years as a private citizen.



Bryce, here is additional information that was sent to me privately that may help you. I quote:
To begin with, the article claims that the calculated "backradiation" that is 1/10 of IPCC/K&T numbers. There is a clear problem because the "backradiation" (a.k.a. "sky temperature" or "Downwelling Longwave Irradiance") has been routinely measured at many observatories and universities. Here is an example of the device they are using
http://www.eppleylab.com/PrdPrecInfRadmtr.htm
The K&T/IPCC number comes from these direct wideband measurements, not from some theory. Therefore the calculated 10x discrepancy is direct evidence that the article is fundamentally wrong. Strangely, it is hard to get data about all-sky radiation measurements. Maybe it is because this subject was settled 50 years ago.
Here are some references, once you find the right term to search, "Downwelling Longwave Irradiance":
http://journals.ametsoc.org/doi/pdf/10.1175/1520-…
http://www.icess.ucsb.edu/esrg/Catherines_Homepag…
http://www.esrl.noaa.gov/gmd/publications/annrpt2…
http://www.urbanclimate.net/matzarakis/papers/Izi…
I cannot argue against the measurements have been made to show that the Trenberth-IPCC back radiation values match the measure values of "downwelling" radiation. However, I can question the appropriateness of using that value in greenhouse heating calculations based on the assumption I made. Namely that we should start with the earth IR and go from there in caclulating CO2's effect on earth temperature. If we use both the earth's temperature (288 C) and the downwelling radiation as sources of IR radiation for greenhouse heating, we are double counting because the "downwelling" heat contributes to making the earth's temperature what it is. There is a current controversy over use of back radiation.
If you read my paper all the way through, you'll note that I did use the back radiation as a source so I could compare my methodology directly to what Petschauer had done. When I did this, I verified Petschauer's results, namely that CO2 is merely "a bit player" in earth warming. When I use the back radiation value that I calculate with SpectralCalc, I show that CO2 doesn't even get "walk on" role. My methodolgy doesn't depend on assumptions about the magnitude of back-radiation. It still shows that the effect of CO2 has been greatly exaggerated.
The comments that appeared regarding Petshauer's paper (G5) do not apply to mine (G4).
Bryce Johnson
@00, Does anyone here have hands-on experience running Hartcode?
I understand Hartcode is the accepted standard for doing atmospheric radiation calculations. If this is true, do we know what result Hartcode would produce using the same initial conditions as the calculations run by Bryce?
Did the IPCC use Hartcode to run its calculations?
Bryce, do you know how your calculation method differs fundamentally from Hartcode?
Brice,
There is a lot to discuss here, but it is so involved that I need to simplify to basic issues. The long wave gas absorption near the ground does not matter except to prevent most of the long wave radiation from the ground from going directly to space. The net result is that the radiation to space occurs above the ground, and the approximate average location is about 5 km. The radiation to space has to match (on average) the incoming solar absorbed radiation. The "effective" temperature of the clouds and average source gas for the match generate the equivalent black body temperature of near 255 K at that effective altitude. The environmental lapse rate (wet and dry adiabatic lapse rates, plus some selected inversions) average -6.5 C per km, and thus the 5 km altitude adds about 33 C added to reach 288 K average surface temperature (this is crude but basically valid far as I can see). The adiabatic lapse rates are driven directly by convection from solar heating at the ground and day/night and latitude variation in heating.
The effect of adding CO2 would not be from changing the optical properties of most of the atmosphere but from changing the location of outgoing radiation. The effect is to slightly raise the average altitude (due to more absorbing/radiating gas at the higher altitude), so the lapse rate times added altitude adds a bit more surface temperature. The atmosphere is partially long wave radiation insulating, but open to free convection, and this results in the atmospheric greenhouse effect.
the so called back radiation is nothing but the long wave radiation (globally radiated) from the atmosphere back toward the ground based on the LTE of the local atmosphere temperature and presence of suitable absorbing/radiating gas (mostly water vapor) .
Bryce wrote, "I can question the appropriateness of using that value [333W/m2] in greenhouse heating calculations based on the assumption I made."
I am unsure how this statement fits into scientific method we try to practice here. There is a measured quantity, it directly affects energy flow balance at the surface. You cannot dismiss this value and consider it "inappropriate" based on your own assumptions and your unconventional vision of heat-mass transfer model.
Now, you say: "Namely that we should start with the earth IR and go from there in caclulating CO2′s effect on earth temperature."
Yes, this is a noble goal. However, your theory seems to assume only one factor at Earth surface, the blackbody IR emission. You even don't count the necessary and inseparable process of downward radiation on the surface energy balance. This is not any "double count", nor there is any controversy: the heat TRANSFER from a surface is always a net transfer, a difference between incoming EM wave and outgoing EM wave. They are inseparable. Convection and latent heat transfer are also excluded from your consideration.
Your model is in fact a well-known radiative-only "glass-slab" model, which was employed 50-100 years ago and was shown to be vastly inadequate to the task. The radiative transfer science is far past this point. Why the article has no references to any radiative transfer papers? The approach is no different, so if you would do all calculations correctly, you would have the same standard CO2 "forcing" of 3.7W/m2 from AGW.
The article language is vague and uncertain. It is difficult to wage through refrigeration engineering terminology of "heat rejection" and "energy deposition profile". Instead of general references to "first law of thermodynamics", you should specify more explicitly which "body" you are talking about, which "steady temperature" it has and where (because it does not have it), why do you believe that rarefied gas emits as blackbody.
The article seems to assume that the only change in "heat input" happens due to changes in "fractional heat addition" due to increase in amount of absorbent [CO2]. This is not true. In fact, changes in radiation balance at surface level have no effect whatsoever on overall "heat input", because convective instabilities and corresponding stirring would re-arrange any changes and restore the necessary lapse rate. The only effect of increased air opacity happens at the radiative top. Please consult with Article G2 for details, and tell where do you disagree with described physical picture.
Response to Dr. Ed:
The descriptions of Hartcode and SpectralCalc are very similar, but I can't tell if they are the same. They both have enough internally generated atmospheric parameters that one would have to have good control on these to do a test case. And it may be difficult to get those parameters from the code providers.
Response to Leonard Weinstein
Thank you for responding to my request for a review.
It seems to me that you are relegating too much insignificance to the direct IR radiation from the earth's surface to outer space. All energy balances I have seen report this as roughly ten percent of the total insolation to the earth and atmosphere. Admittedly ghg's do lower that value but since direct radiation is 60 percent of all the long-wave radiation that starts out, the lowering cannot be very significant. I think your analysis did cover this OK.
I agree that the effective altitude of emission to outer space moves outward as the greenhouse heat increases, but I think it is due only to the change in temperature decline (lapse rate) which is cause by added heat to the atmosphere at elevations where molecular concentration is sufficient and where complete saturation has not yet occurred. A flatter temperature decline moves the average temperature outward.
My analysis showed that as the effective emission temperature moves outward, the calculated average heat increase to the atmosphere decreases.
I agree with your description of back radiation.
Response to Al Tekhasski.
Thank you for responding to my request for a review.
Other commenters have pointed out that the actual measured back radiation matches that of Trenberths heat balance. You are right that I should not dismiss this. And for the case where I included it, it may not have been included correctly. This obviously needs more work and thought on my part.
I don't disagree that heat TRANSFER is always a net heat transfer, but that does not preclude the incoming and the outgoing from being treated separately. I believe that convection and latent heat transfer have only a secondary effect on what is happening relative to IR transfer and that it is OK to neglect them.
I was totally unaware either of the "glass-slab" model, that it matched my model or that it is vastly inadequate for the task. Thanks for the education.
My radiative transfer calculations were all done with the SpectralCalc code. I felt that referencing it obviated the need for references to additional radiative transfer papers.
What is the approach no different than? I presume you are stating that because I did not reference "radiative transfer papers" that my analysis is incorrect. If this is your inference then I flatly reject it.
I apologize for my lack of articulation and clarity and the use of engineering terminology. If you are troubled with "heat rejection" and "energy deposition profile" I am willing to substitute more scientific terminology. My specific application of the first law of thermodynamics was to the atmosphere as a whole as the body I was talking about. I thought this would be evident. I recognize that its temperature is not steady, but that there is no compromise of results if I assume that it is steady or at least stable for a relatively short period of time. To do otherwise would complicate the analysis without adding information.
I am only interested in the results of change in "heat input" due to CO2 absorption. Why should I include everything else? If you are inferring that such exclusion invalidates my analysis then that is a different matter and you should say so and say why. One thing that my analysis did show (and you may not agree) is that the temperature lapse rate per se has but a minor effect on average temperature of the atmosphere. All the sophisticated studies of convective instabilities and corresponding stirring in the world will not alter the lapse rate enough to amount to anything. And, as I stated, lapse rate is a minor parameter in determining overall atmospheric temperature. Using 288, 255, or 233 as the effective Kelvin temperature of outbound radiation won't alter the average atmospheric temperature by more than a small fraction of a degree centigrade.
I don't believe the statement that "the only effect of increased air opacity happens at the “radiative top" whatever that is. Maybe that's the only place where it has to be accounted for in analyses. But the effect of increased opacity is manifest everywhere in the atmosphere that it exists.
I read your G2 article and I have no disagreement with it. What I don't have, however, is any sense of how I should alter my analysis because of it.
Bryce, regarding "actual measured back radiation matches that of Trenberths heat balance."
This is not that the measured radiation "matches" the number on K&T picture; almost all numbers on K&T pictures are taken from observations, that's why they "match". For example, the "latent heat" part is estimated from data on rainfall — whichever comes down must evaporate from somewhere. SW reflections are measured, long-wave radiation from surface is estimated from measured temperatures and known surface emmissivities, etc. etc. I don't understand why people are so against this diagram. It represents approximate current heat fluxes, nothing more, it is a static balance. It is nearly impossible to derive from this balance any projections for climate sensitivity to any changes.
Regarding "Spectralcalc code", there are several different sections. I assume that you are using a subscription version for calculating of atmospheric path irradiance,
http://www.spectralcalc.com/atmospheric_paths/pat…
Is this correct? I cannot understand from your article how do you obtain changes in surface temperature from that, and how do you change "backradiation" at will. All you show are transmittance spectra. In my understanding, every layer of air is in Local Thermodynamic Equilbrium (LTE), so whatever temperature it has is translated into radiative fluxes invariably. Each layer has its own transmission-absorption properties and is held at its own temperature, all of them are changing with height, including line broadening. Therefore each layer emits accordingly and differently, and each individual frequency has different mean free path before being absorbed in adjacent layer. Every line must behave differently. Please explain.
@ 7 Bryce,
There is a small portion of direct radiation to space and some radiation absorption and some radiation in the atmosphere from greenhouse gases (and aerosols and water drops), but the main transfer of heat from the surface to high altitude is evapotransporation and convection up of air heated by conduction and buoyancy. The radiation to space occurs at all altitudes, with the effective average altitude about 5 km. Due to free convection and LTE, the average lapse rate DOES NOT directly change due to changes in the greenhouse gas concentration, but can change slightly due to changes in average cloud cover. The effective temperature of the average altitude where radiation to space occurs (and this average includes the surface direct to space) does not drop as the average altitude for radiation to space increases. The effective increase in altitude times the effective lapse rate is then the CAUSE of increased ground temperature. The increased ground temperature, and increased atmosphere temperature close to the ground then both increase radiation levels, but the heat transfer stays the same.
Brice,
Consider a gas that is nearly totally opaque to outgoing radiation (all wavelengths), but radiates to space at the same altitude as present. The radiation heat transfer is zero. The temperature profile and ground temperature would be the same as present if the location of outgoing radiation to space was the same, and the specific heat of the gas was the same. All energy would be transported from the ground to the radiation height by convection. The fact that the gas absorbed more radiation has no effect due to LTE and free convection.
This is a test, only. The last comment failed to post.
Reply to Comment 8, Al Tekhasski
Hope this goes, the last one failed. You are correct on your question about SpectralCalc. In my use of SpectralCalc, I didn't calculate any surface temperatures, only the temprature increse in the atmosphere. I used he 288K temperature of the earth's surface as the starting point for SpectralCalc and I maintained it constant.
SpectralCalc divides the atmosphere into think concentric spherical annuli out to 120 km. Each annulus has its own atmospheric parameters, so that any one calculation has as many sets of parameters as annuli crossed by the total path length. Each line is calculated separately. That's why the wavelength interval whih can be calculated is limited. I used 20 inervals in getting across the IR specrum of the earth. SpectralCalc rejects you input if you exceed its million-point calculation limit and has you reduce a least one of the limiting parameters. It tells you what point count would be required to help you adjust the limits (as path length of wavelength interval). I don't remember, if I ever knew, the thickness of the radial annuli used. If the code accepts your input it gives you all the accuracy needed. I.e., you don't improve on the accuracy by dividing up the interval for more calculations.
I tried to use it to calculate back radiation, but you noted that my effort fell short of the IPCC value by a factor of ten. The scheme i used for that is described in the paper. I now have a scheme using the down-directed path scheme to see if I can determine the atmount of heat dumped in the atmosphere while it is delivering 333 watts/m^2 to the earth's surface. I'll describe it to you if it works (maybe even if it doesn't work, so I can get your input on it). I found that the parts of spectralcalc that were free did not meet my needs, the $25/month fee was well worth it.
If you need more clarification, ask.
Bryce
Bryce, the text says:
"2. From 1, altitude energy deposition profile was obtained and is shown in Figure 9."
Where is Figure 9?
Could you please explain what is the "altitude energy deposition profile"?
Reply to number 13 from Al Tekhasski
Figure 9 is actually Figure 8. I caught that error and a few others, unfortunately, after I'd sent off the original. I sent a corrected one, but Dr. Ed has been too busy to replace the first one. I apologize for that.
The energy deposition profile is the relative energy depositied in the atmosphere at the specific altitude. It was obtained by normalizing to the top energy deposition, calculated at 0.5 km. Meaning the plotted values are the values calculated by dividing by that at 0.5 km. I obtained that because I wanted to know far into the atmosphere effective depoisition was seen.
Bryce
KUDOS to Richard for taking a pragmatic view of the the"greenhouse" phenomenon. About everything he did was according to my instincts, as I have been expressing here for the last month or two. Way to go!
Two items:
1- The 10:1 disparity between G 3 back-radiation from the atmosphere and your results means that there is a fundamental difference in the assumption made by you and by them. This needs searching out. One thought was the geometrical modeling of the diffuse back-flow of energy by the two camps, the watts per micron per steradian metric, has fundamental differences in detail. I think you said that the G5 result was based on actual measurements a century ago. This task now seems clear: You must obtain those papers and reports that produced those (high flux) results and very carefully extract their underlying diffuse geometry assumptions. For instance, I believe that you are basically expressing a one-dimensional model of the progression of radiation from the surface up (+) into the atmosphere and then back (-) to the ground. One needs to carefully consider whether radiation traveling to the right, left, fore and aft are to be counted, or not.
2- In my brief study, I found a graph that shows atmospheric temperature from the ground through the Exosphere toward outer space (produced in these general "Ed vs Eric" writings as @20 therein, I believe). There it is clear that the stratosphere is VERY cold while the outer Exosphere is VERY hot. How do we now explain this stark contrast having your excellent computational capability… I say that this is due to the rather complete absence of polar molecules of gas that are responsible for IR absorption/re-radiation. Mix in with this the likelihood that CO2 concentration out there might be lower percentage wise because of its greater molecular weight. This high temperature exists in the face of no visible or IR absorption. But this layer is first in line to be exposed to ultraviolet, whose interactions cannot be polar where there re no polar molecules, but UV interactions can be atomic; amongst the outer atomic electrons. Ergo, this uppermost layer is warmed by ultraviolet energy absorption by day, but cannot re-radiate it at night. This is then the perfect greenhouse envelope! The natural extension of this conclusion is that any addition of polar molecules to the atmosphere results in its cooling!
What say you?
Ange
Reply to Dr. Eric, comment 16.
There is no theory here, it is just an application of the simplest physics that adequately describes the situation.
All the "facts" appropriate to the situation have been applied and results compared.
Perhaps you and Mr. Twain can consult with each other and explain to me which facts have been omitted
Bryce Johnson
Reply to comment 17.
This comment obviously addresses G5 by Petschauer, but posted under G4, apparently in error.
Bryce Johnson
Richard Petschauer says:
February 5, 2011 at 7:31 am (Edit)
My comments on this are rather late, but I have noticed a number of problems.
But first regarding the general approach. It appears you are trying to improve on my paper from 2008 that only considered the heat transfer between the surface and the atmosphere. However this method has the shortcoming in that the constraint of the outgoing radiation must balance the net incoming radiation is not considered. All the current models invoke this balance at the planet level. However in doing so these methods seem to then ignore the surface to atmosphere coupling and assume a constant temperature relation between the surface and the top of the atmosphere. My latest paper “Climate Science’s Blind Spot – Evaporation Cooling” attempts to combine both methods and solves for heat balance at all three levels: the surface, the atmosphere and the entire planet to outer space.
Some detail questions about your paper.
The “saturation” region for CO2 after 20 km of travel is from 12 to 18 microns, but you seem to use only the left side of this, or 13 to 15 microns.
Also your Figure 1 shows very low absorption in the 13 to 15 micron region, about 7%. Why is this being shown? What is the path in the atmosphere for it? Figure 6 shows only about 9% absorption in the 13 to 5 micron region.
Your absorption numbers in Table 1 look low. For example for present CO2 and water vapor you show absorption of 244.64 w/m^2. This is only about 62% of the 396 leaving the surface. My results and Trenberth’s estimates are close to 75% for clear skies.
But then in Table 1 from line 4 to 5, the values are reduced by 10 to 1 (1.047283 drops to 1.004723). What is the basis for such a large reduction? That implies the total absorption is 10 times 244.64 which is much larger than 396 leaving the surface. Apparently this comes from a statement earlier, “The greenhouse contribution to total atmospheric heat is assumed to be ten percent.” Looking at Figure 2 including clouds it is 356 / (356 + 78 + 17 + 80) or 67% about half of that if clouds low intercept about 49%. However all that the atmosphere can capture by GH gases is the radiation of 390 or 396 leaving the surface.
You show two values of water vapor content whereas it drops with altitude with temperature. How was this handled?
Richard
Thanks for your comments.
I used the known temperature of the earth's surface (288K) as the starting point for my calculation. The value already contains the effects of exchange of IR at the earth's interface.
I used all the IR range for my calculations. The increment between 13 and 15 is only one of these. Did I fail to note that this was only and example of one of the twenty increments used? I used the average of 5 paths through the atmosphere for each increment of wavelength. This is described in the paper.
All three of the atmospheric heat balances show only about 40 percent of the surface heat absorbed in the atmosphere. Secondary emissions don't count as heat to the atmosphere because these are produced by the heat that is already there.
I omitted any direct concern with clouds, assuming that was covered in my average moisture in the atmosphere. My goal was to obtain a reasonable estimate of the CO2 contribution with minimal necessary calculations.
CO2 contributed about a 0.04 fraction of the greenhouse heat which I assumed was ten percent of the total heat. So CO2 contributes 0.004 to total atmospheric heat.
Bryce Johson
addendum to comment 22.
Richard.
I did not vary moisture content with altitude but used an average value throughout the 20 km calculation altitude.
Bryce
I’m very sorry to report that I’ve learned that Bryce died in 2018 (sometime in the last half of the year).